 RSS Feed
 by Calculated Risk on 4/27/2020 10:35:00 AM
Monday, April 27, 2020
Dallas Fed: "Contraction in Texas Manufacturing Sector Worsens", Record Low Activity Index
From the Dallas Fed: Contraction in Texas Manufacturing Sector Worsens
Texas factory activity declined further in April, according to business executives responding to the Texas Manufacturing Outlook Survey. The production index, a key measure of state manufacturing conditions, pushed further negative from -35.3 to -55.3, suggesting the contraction in output has steepened since last month.The last of the regional Fed surveys for April will be released tomorrow (Richmond Fed).
Other measures of manufacturing activity also point to a sharper decline in April. The new orders index dropped 26 points to -67.0, its lowest reading since the survey began in 2004. Similarly, the growth rate of orders index fell to -62.2. The capacity utilization and shipments indexes fell to -54.5 and -56.6, respectively. The capital expenditures index declined 20 points to -54.3. Each of these April readings represents a historical low.
Perceptions of broader business conditions remained very pessimistic in April. The general business activity index inched down from -70.0 to -73.7, pushing to a new historical low. The company outlook index remained near an all-time low but inched up from -65.6 to -62.6. The index measuring uncertainty regarding companies’ outlooks retreated slightly to 54.4, a reading still indicative of sharply increased uncertainty.
Labor market measures indicate further employment declines and shorter workweeks this month. The employment index held steady at -21.2. Three percent of firms noted net hiring, while 24 percent noted net layoffs. The hours worked index dropped 18 points to -40.2, signaling a notably reduced workweek length.
emphasis added
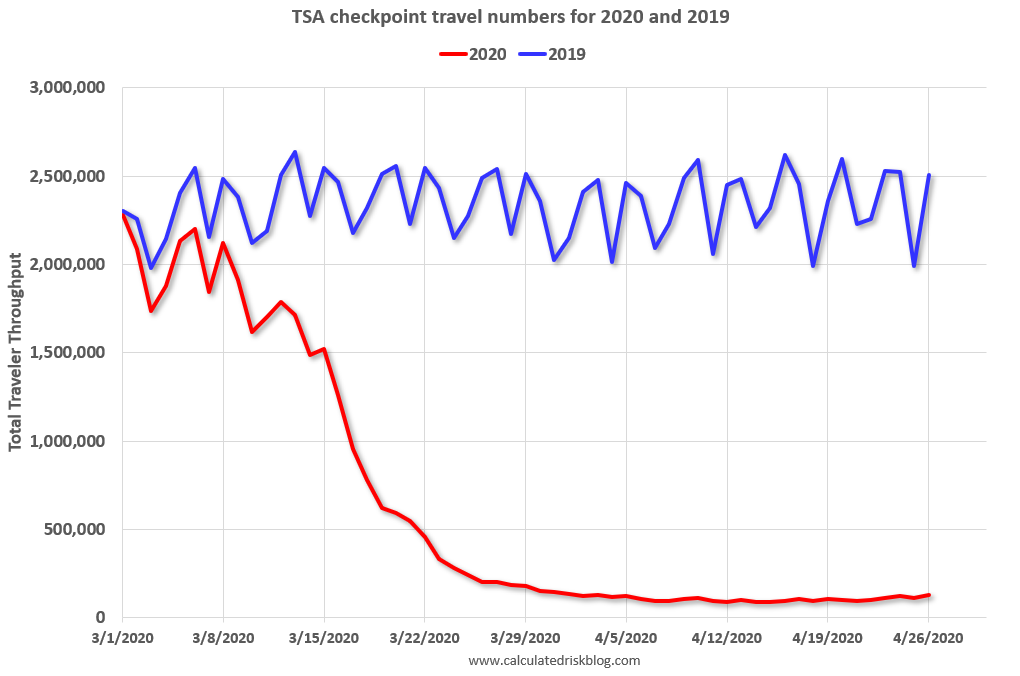
TSA checkpoint travel numbers
by Calculated Risk on 4/27/2020 09:37:00 AM
The TSA is providing daily travel numbers.
This is another measure that will be useful to track when the economy starts to reopen.
 Click on graph for larger image.
This data shows the daily total traveler throughput from the TSA for 2019 (Blue) and 2020 (Red).
On April 26th there were 128,875 travelers compared to 2,506,809 a year ago.
That is a decline of 95%.
Sunday, April 26, 2020
Sunday Night Futures
by Calculated Risk on 4/26/2020 09:51:00 PM
Weekend:
• Schedule for Week of April 26, 2020
Monday:
• At 10:30 AM ET, Dallas Fed Survey of Manufacturing Activity for April.
From CNBC: Pre-Market Data and Bloomberg futures S&P 500 and DOW futures are up slightly (fair value).
Oil prices were down over the last week with WTI futures at $15.52 per barrel and Brent at $21.00 barrel. A year ago, WTI was at $63, and Brent was at $71 - so WTI oil prices are down about 75% year-over-year.
Here is a graph from Gasbuddy.com for nationwide gasoline prices. Nationally prices are at $1.74 per gallon. A year ago prices were at $2.88 per gallon, so gasoline prices are down $1.14 per gallon year-over-year.
April 26 Update: US COVID-19 Test Results: Fauci Expects Testing to Double
by Calculated Risk on 4/26/2020 05:01:00 PM
From The Hill: Fauci confident US will double coronavirus testing capacity over next several weeks
Fauci said in a webcast hosted by the National Academy of Sciences that that the U.S. is currently averaging between 1.5 million and 2 million tests per week.Based on these comments, the US might be able to test 400,000 to 600,000 people per day in several weeks - and that would probably be sufficient for test and trace.
"We probably should get up to twice that as we get into the next several weeks, and I think we will," Fauci said. "Testing is an important part of what we’re doing, but it is not the only part."
…
"You need enough tests so when you’re doing what we’re trying to do right now, which is trying to ease our way back, that you can very easily identify, test, contact trace and get those who are infected out of society so they don’t infect others," he said, adding that positive test results should account for less than 10 percent of tests administered.
There were 256,444 test results reported over the last 24 hours.
 Click on graph for larger image.
This data is from the COVID Tracking Project.
The percent positive over the last 24 hours was 10.7% (red line). The US probably needs enough tests to push the percentage positive below 5%, although Dr. Fauci said below 10% (probably much lower based on testing in New Zealand).
April 2020: Unofficial Problem Bank list Decreased to 64 Institutions
by Calculated Risk on 4/26/2020 08:11:00 AM
The FDIC's official problem bank list is comprised of banks with a CAMELS rating of 4 or 5, and the list is not made public (just the number of banks and assets every quarter). Note: Bank CAMELS ratings are also not made public.
CAMELS is the FDIC rating system, and stands for Capital adequacy, Asset quality, Management, Earnings, Liquidity and Sensitivity to market risk. The scale is from 1 to 5, with 1 being the strongest.
As a substitute for the CAMELS ratings, surferdude808 is using publicly announced formal enforcement actions, and also media reports and company announcements that suggest to us an enforcement action is likely, to compile a list of possible problem banks in the public interest.
DISCLAIMER: This is an unofficial list, the information is from public sources and while deemed to be reliable is not guaranteed. No warranty or representation, expressed or implied, is made as to the accuracy of the information contained herein and same is subject to errors and omissions. This is not intended as investment advice. Please contact CR with any errors.
Here is the unofficial problem bank list for April 2020.
Here are the monthly changes and a few comments from surferdude808:
Update on the Unofficial Problem Bank List for April 2020. During the month, the list declined by one to 64 banks after one removal. Aggregate assets were little changed at $48.4 billion. A year ago, the list held 73 institutions with assets of $52.1 billion. Exiting the list via failure was The First State Bank, Barboursville, WV ($152 million). This was the second failure in 2020 and the first failure in West Virginia since 2008 when Ameribank, Northfork, WV ($104 million) failed on September 19, 2008.The first unofficial problem bank list was published in August 2009 with 389 institutions. The number of unofficial problem banks grew quickly and peaked at 1,003 institutions in July, 2011 - and has steadily declined to well below 100 institutions.
Saturday, April 25, 2020
April 25 Update: US COVID-19 Test Results: Making Progress!
by Calculated Risk on 4/25/2020 05:16:00 PM
Test-and-trace is a key criterion in starting to reopen the country. My current guess is test-and-trace will require around 300,000 tests per day at first since the US is far behind the curve. Some scientists believe we need around 800,000 tests per day.
Note: The Financial Times reports that Germany is doing more than 50,000 tests per day (with about one-fourth of the US population). That would be 200,000 in the US. I rounded up to 300,000 per day since the US is so behind on testing. But there are recommendations that Germany needs 200,000 tests per day to do test-and-trace. (800,000 adjusted for population).
This is just test results reported daily.
There were 300,833 test results reported over the last 24 hours.
 Click on graph for larger image.
This data is from the COVID Tracking Project.
The percent positive over the last 24 hours was 13.5% (red line). The US probably needs enough tests to push the percentage below 5% (probably much lower based on testing in New Zealand).
All experts agree: We appear to be making progress.
Hotels: Occupancy Rate Declined 64.4% Year-over-year; 4-Week Average at All Time Record Low
by Calculated Risk on 4/25/2020 10:39:00 AM
From HotelNewsNow.com: STR: US hotel results for week ending 18 April
Reflecting the continued impact of the COVID-19 pandemic, the U.S. hotel industry reported significant year-over-year declines in the three key performance metrics during the week of 12-18 April 2020, according to data from STR.The following graph shows the seasonal pattern for the hotel occupancy rate using the four week average.
In comparison with the week of 14-20 April 2019, the industry recorded the following:
• Occupancy: -64.4% to 23.4%
• Average daily rate (ADR): -42.2% to US$74.53
• Revenue per available room (RevPAR): -79.4% to US$17.43
“Absolute occupancy and ADR were actually up slightly from the previous week, but it is important to state that this is not any type of early-recovery sign,” said Jan Freitag, STR’s senior VP of lodging insights. “Rather, more demand can be attributed to frontline workers. A perfect example, the most notable occupancy level (33.3%) came in the New York City market, which has welcomed an influx of workers from the medical community.”
emphasis added
 Click on graph for larger image.
The red line is for 2020, dash light blue is 2019, blue is the median, and black is for 2009 (the worst year probably since the Great Depression for hotels).
2020 was off to a solid start, however, COVID-19 has crushed hotel occupancy.
Note: Y-axis doesn't start at zero to better show the seasonal change.
This is the lowest 4-weekly average occupancy on record, even considering seasonality. It appears that around 20% occupancy could be the bottom.
Schedule for Week of April 26, 2020
by Calculated Risk on 4/25/2020 08:11:00 AM
The key report scheduled for this week is Q1 GDP.
Other key reports include Case-Shiller house prices, ISM Manufacturing survey, Vehicle Sales and Personal Income and Outlays for March.
For manufacturing, the April Dallas and Richmond manufacturing surveys will be released.
The FOMC meets this week, and no change to policy is expected at this meeting.
10:30 AM: Dallas Fed Survey of Manufacturing Activity for April.
 9:00 AM: S&P/Case-Shiller House Price Index for February.
This graph shows the nominal seasonally adjusted National Index, Composite 10 and Composite 20 indexes through the most recent report (the Composite 20 was started in January 2000).
The consensus is for a 3.1% year-over-year increase in the Comp 20 index for February.
10:00 AM: Richmond Fed Survey of Manufacturing Activity for April. This is the last of regional manufacturing surveys for April.
10:00 AM: the Q1 2020 Housing Vacancies and Homeownership from the Census Bureau.
7:00 AM ET: The Mortgage Bankers Association (MBA) will release the results for the mortgage purchase applications index.
8:30 AM: Gross Domestic Product, 1st quarter 2020 (Advance estimate). The consensus is that real GDP decreased 4.0% annualized in Q1, down from 2.1% in Q4.
10:00 AM: Pending Home Sales Index for March. The consensus is for a 10.0% decrease in the index.
2:00 PM: FOMC Meeting Announcement. No change to policy is expected at this meeting.
2:30 PM: Fed Chair Jerome Powell holds a press briefing following the FOMC announcement.
8:30 AM: The initial weekly unemployment claims report will be released. The consensus is for a 3.500 million initial claims, down from 4.427 million the previous week.
8:30 AM ET: Personal Income and Outlays, March 2020. The consensus is for a 1.4% decrease in personal income, and for a 5.0% decrease in personal spending. And for the Core PCE price index to decrease 0.1%.
9:45 AM: Chicago Purchasing Managers Index for April.
 10:00 AM: ISM Manufacturing Index for April. The consensus is for the ISM to be at 36.7, down from 49.1 in March.
Here is a long term graph of the ISM manufacturing index.
The PMI was at 49.1% in March, down from 50.1% in February. The employment index was at 43.8% and the new orders index was at 42.2%.
10:00 AM: Construction Spending for March. The consensus is for a 3.9% decrease in construction spending.
 All day: Light vehicle sales for April. The consensus is for light vehicle sales to be 6.5 million SAAR in April, down from 11.4 million in March (Seasonally Adjusted Annual Rate).
This graph shows light vehicle sales since the BEA started keeping data in 1967. The dashed line is the sales rate for the previous month.
Friday, April 24, 2020
April 24 Update: US COVID-19 Test Results
by Calculated Risk on 4/24/2020 05:22:00 PM
NOTE: California sometimes clears the backlog of tests, and this shows a spike in testing. We need to look at the trend.
Test-and-trace is a key criterion in starting to reopen the country. My current guess is test-and-trace will require around 300,000 tests per day at first since the US is far behind the curve. Some scientists believe we need around 800,000 tests per day.
Note: The Financial Times reports that Germany is doing more than 50,000 tests per day (with about one-fourth of the US population). That would be 200,000 in the US. I rounded up to 300,000 per day since the US is so behind on testing. But there are recommendations that Germany needs 200,000 tests per day to do test-and-trace. (800,000 adjusted for population).
This is just test results reported daily.
There were 223,552 test results reported over the last 24 hours.
 Click on graph for larger image.
This data is from the COVID Tracking Project.
The percent positive over the last 24 hours was 14% (red line). The US probably needs enough tests to push the percentage below 5% (probably much lower based on testing in New Zealand).
All experts agree: We need many more tests! But we appear to be making progress.
Q1 GDP Forecasts: Around -7% SAAR
by Calculated Risk on 4/24/2020 05:04:00 PM
Note 1: Economists at both Merrill Lynch and Goldman Sachs expect significant downward revisions to the advance report due to incomplete source data. The consensus is the advance report will show a decline of 4.0% SAAR in Q1.
Note 2: The NY Fed Nowcast and Atlanta Fed GDPNow models are based on released data and aren't capturing the collapse in the economy in the 2nd half of March. All forecasts, including the Merrill Lynch and other forecasts, are for the seasonally adjust annual rate (SAAR) of decline.
From Merrill Lynch:
We expect real GDP to plunge 7% in 1Q. Consumption and business capex should plummet. [SAAR Apr 24 estimate]From Goldman Sachs:
emphasis added
On net, we lowered our estimate for GDP growth in next Wednesday’s report by three tenths to -4.8% (qoq ar). We also see increased scope for downward revisions to the source data in coming months, and we estimate the final vintages will show growth of -8.3% (vs. -7.0% previously), with the 3.5pp wedge reflecting non-response bias and incomplete source data. [SAAR Apr 24]From the NY Fed Nowcasting Report
The New York Fed Staff Nowcast stands at -0.4% for 2020:Q1 and -7.8% for 2020:Q2. [Apr 24 estimate]And from the Altanta Fed: GDPNow
The GDPNow model estimate for real GDP growth (seasonally adjusted annual rate) in the first quarter of 2020 is -0.3 percent on April 24, unchanged from April 16 after rounding. There are no subjective adjustments made to GDPNow—the estimate is based solely on the mathematical results of the model. In particular, it does not capture the impact of COVID-19 beyond its impact on GDP source data and relevant economic reports that have already been released. It does not anticipate the impact of COVID-19 on forthcoming economic reports beyond the standard internal dynamics of the model. [Apr 24 estimate]CR Note: It appears GDP declined around 7% SAAR in Q1. The decline in Q2 will be much larger; the CBO is projecting a decline of close to 40% SAAR in Q2.


