 RSS Feed
 by Calculated Risk on 9/01/2017 03:23:00 PM
Friday, September 01, 2017
U.S. Light Vehicle Sales at 16 million annual rate in August
Based on an estimate from WardsAuto, light vehicle sales were at a 16.03 million SAAR in August.
That is down 6% from August 2016, and down 3.9% from last month.

Click on graph for larger image.
This graph shows the historical light vehicle sales from the BEA (blue) and an estimate for August (red, light vehicle sales of 16.03 million SAAR mostly from WardsAuto).
This was well below the consensus forecast of 16.7 million for August (However Hurricane Harvey pushed down sales over the last week - and there will be some bounce back).
After two consecutive years of record sales, vehicle sales will be down in 2017.
 The second graph shows light vehicle sales since the BEA started keeping data in 1967.
Note: dashed line is current estimated sales rate.
Comment: A Disappointing Employment Report
by Calculated Risk on 9/01/2017 12:31:00 PM
The headline jobs number was below expectations, and there were downward revisions to the previous two months. And the unemployment increased slightly. Overall a disappointing report.
Earlier: August Employment Report: 156,000 Jobs, 4.4% Unemployment Rate
In August, the year-over-year change was 2.097 million jobs. This is still decent year-over-year job growth, but this is the lowest year-over-year growth since early 2013.
Note that August has been the second weakest month for job growth over the previous three years; only January has been weaker. This is the 3rd consecutive August report below 200 thousand jobs: 157 thousand in August 2015, 176 thousand in August 2016, and now 156 thousand in August 2017. This recent history was a key reason I took the under versus the consensus view.
On the impact of Hurricane Harvey from the BLS:
Hurricane Harvey had no discernable effect on the employment and unemployment data for August. Household survey data collection was completed before the storm. Establishment survey data collection for this news release was largely completed prior to the storm, and collection rates were within normal ranges nationally and for the affected areas.So the impact from the hurricane on employment will be in the September, and probably October, reports.
Average Hourly Earnings
 Click on graph for larger image.
This graph is based on “Average Hourly Earnings” from the Current Employment Statistics (CES) (aka "Establishment") monthly employment report. Note: There are also two quarterly sources for earnings data: 1) “Hourly Compensation,” from the BLS’s Productivity and Costs; and 2) the Employment Cost Index which includes wage/salary and benefit compensation.
The graph shows the nominal year-over-year change in "Average Hourly Earnings" for all private employees. Nominal wage growth was at 2.5% YoY in August.
Wage growth has generally been trending up.
Part Time for Economic Reasons
 From the BLS report:
The number of persons employed part time for economic reasons (sometimes referred to as involuntary part-time workers) was essentially unchanged at 5.3 million in August and has shown little movement in recent months. These individuals, who would have preferred full-time employment, were working part time because their hours had been cut back or because they were unable to find a full-time job.The number of persons working part time for economic reasons decreased slightly in August. The number working part time for economic reasons suggests a little slack still in the labor market.
These workers are included in the alternate measure of labor underutilization (U-6) that was unchanged at 8.6% in August.
Unemployed over 26 Weeks
 This graph shows the number of workers unemployed for 27 weeks or more.
 According to the BLS, there are 1.74 million workers who have been unemployed for more than 26 weeks and still want a job. This was down from 1.79 million in July.
This is generally trending down, but still a little elevated.
Overall this was a disappointing report.
Construction Spending decreased in July
by Calculated Risk on 9/01/2017 11:08:00 AM
Earlier today, the Census Bureau reported that overall construction spending decreased in July:
Construction spending during July 2017 was estimated at a seasonally adjusted annual rate of $1,211.5 billion, 0.6 percent below the revised June estimate of $1,219.2 billion. The July figure is 1.8 percent above the July 2016 estimate of $1,189.8 billion.Private and public spending both decreased in July:
Spending on private construction was at a seasonally adjusted annual rate of $945.5 billion, 0.4 percent below the revised June estimate of $949.4 billion. ...
In July, the estimated seasonally adjusted annual rate of public construction spending was $266.0 billion, 1.4 percent below the revised June estimate of $269.8 billion.
emphasis added
 Click on graph for larger image.
This graph shows private residential and nonresidential construction spending, and public spending, since 1993. Note: nominal dollars, not inflation adjusted.
Private residential spending has been increasing, but is still 24% below the bubble peak.
Non-residential spending is now 3% above the previous peak in January 2008 (nominal dollars).
Public construction spending is now 18% below the peak in March 2009, and only slightly above the austerity low in February 2014.
 The second graph shows the year-over-year change in construction spending.
On a year-over-year basis, private residential construction spending is up 12%. Non-residential spending is down 4% year-over-year. Public spending is down 6% year-over-year.
This was well below the consensus forecast of a 0.6% increase for July, however spending for previous months were revised up. Still a disappointing report.
ISM Manufacturing index increased to 58.8 in August
by Calculated Risk on 9/01/2017 10:05:00 AM
The ISM manufacturing index indicated expansion in August. The PMI was at 58.8% in August, up from 56.3% in July. The employment index was at 59.9%, up from 55.2% last month, and the new orders index was at 60.3%, down from 60.4%.
From the Institute for Supply Management: August 2017 Manufacturing ISM® Report On Business®
Economic activity in the manufacturing sector expanded in August, and the overall economy grew for the 99th consecutive month, say the nation's supply executives in the latest Manufacturing ISM® Report On Business®.
The report was issued today by Timothy R. Fiore, CPSM, C.P.M., Chair of the Institute for Supply Management® (ISM®) Manufacturing Business Survey Committee: "The August PMI® registered 58.8 percent, an increase of 2.5 percentage points from the July reading of 56.3 percent. The New Orders Index registered 60.3 percent, a decrease of 0.1 percentage point from the July reading of 60.4 percent. The Production Index registered 61 percent, a 0.4 percentage point increase compared to the July reading of 60.6 percent. The Employment Index registered 59.9 percent, an increase of 4.7 percentage points from the July reading of 55.2 percent. The Supplier Deliveries Index registered 57.1 percent, a 1.7 percentage point increase from the July reading of 55.4 percent. The Inventories Index registered 55.5 percent, an increase of 5.5 percentage points from the July reading of 50 percent. The Prices Index registered 62 percent in August, the same reading as July, indicating higher raw materials’ prices for the 18th consecutive month. Comments from the panel reflect expanding business conditions, with new orders, production, employment, backlog and exports all growing in August, as well as supplier deliveries slowing (improving) and inventories increasing during the period. The Customers’ Inventories Index experienced a sharp decline in August compared to July."
emphasis added
 Click on graph for larger image.
Here is a long term graph of the ISM manufacturing index.
This was above expectations of 56.6%, and suggests manufacturing expanded at a faster pace in August than in July.
A solid report.
August Employment Report: 156,000 Jobs, 4.4% Unemployment Rate
by Calculated Risk on 9/01/2017 08:42:00 AM
From the BLS:
Total nonfarm payroll employment increased by 156,000 in August, and the unemployment rate was little changed at 4.4 percent, the U.S. Bureau of Labor Statistics reported today. Job gains occurred in manufacturing, construction, professional and technical services, health care, and mining.
...
The change in total nonfarm payroll employment for June was revised down from +231,000 to +210,000, and the change for July was revised down from +209,000 to +189,000. With these revisions, employment gains in June and July combined were 41,000 less than previously reported.
...
In August, average hourly earnings for all employees on private nonfarm payrolls rose by 3 cents to $26.39, after rising by 9 cents in July. Over the past 12 months, average hourly earnings have increased by 65 cents, or 2.5 percent.
emphasis added
 Click on graph for larger image.
The first graph shows the monthly change in payroll jobs, ex-Census (meaning the impact of the decennial Census temporary hires and layoffs is removed - mostly in 2010 - to show the underlying payroll changes).
Total payrolls increased by 156 thousand in August (private payrolls increased 165 thousand).
Payrolls for June and July were revised down by a combined 41 thousand.
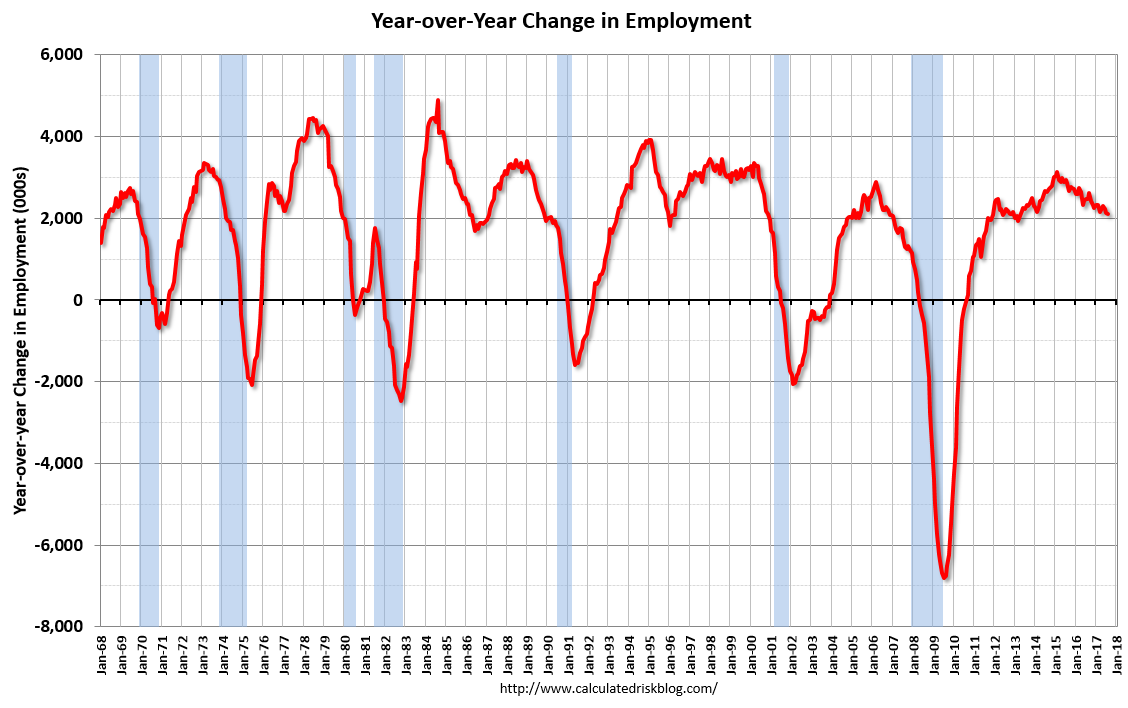 This graph shows the year-over-year change in total non-farm employment since 1968.
In August the year-over-year change was 2.10 million jobs. This is a decent year-over-year gain.
The third graph shows the employment population ratio and the participation rate.
 The Labor Force Participation Rate was unchanged in August at 62.9%. This is the percentage of the working age population in the labor force. A large portion of the recent decline in the participation rate is due to demographics.
 The Employment-Population ratio decreased to 60.1% (black line).
I'll post the 25 to 54 age group employment-population ratio graph later.
 The fourth graph shows the unemployment rate.
 The unemployment rate increased in August to 4.4%.
This was below expectations of 180,000 jobs, and the previous two months were revised down. A somewhat disappointing report.
I'll have much more later ...
Thursday, August 31, 2017
Friday: Employment Report, ISM Mfg Index, Construction Spending, Vehicle Sales
by Calculated Risk on 8/31/2017 08:22:00 PM
Note: August vehicle sales might be the first economic report impacted by Hurricane Harvey. Next Thursday, weekly unemployment claims will probably be impacted.
Earlier:
My August Employment Preview
and Goldman: August Payrolls Preview
Friday:
• At 8:30 AM ET, Employment Report for August. The consensus is for an increase of 180,000 non-farm payroll jobs added in August, down from the 209,000 non-farm payroll jobs added in July. The consensus is for the unemployment rate to be unchanged at 4.3%.
• At 10:00 AM, ISM Manufacturing Index for August. The consensus is for the ISM to be at 56.6, up from 56.3 in August.
• Also at 10:00 AM, Construction Spending for July. The consensus is for a 0.6% increase in construction spending.
• Also at 10:00 AM, University of Michigan's Consumer sentiment index (final for July). The consensus is for a reading of 97.2, unchanged from the preliminary reading 97.6.
• All day: Light vehicle sales for August. The consensus is for light vehicle sales to be 16.7 million SAAR in August, unchanged from 16.7 million in July (Seasonally Adjusted Annual Rate).
Fannie Mae: Mortgage Serious Delinquency rate declined in July, Lowest since December 2007
by Calculated Risk on 8/31/2017 05:09:00 PM
Fannie Mae reported that the Single-Family Serious Delinquency rate declined to 1.00% in July, from 1.01% in June. The serious delinquency rate is down from 1.30% in July 2016.
This is the lowest serious delinquency rate since December 2007.
These are mortgage loans that are "three monthly payments or more past due or in foreclosure".
The Fannie Mae serious delinquency rate peaked in February 2010 at 5.59%.
 Click on graph for larger image
Although the rate is declining, the "normal" serious delinquency rate is somewhat under 1%.
The Fannie Mae serious delinquency rate has fallen 0.30 percentage points over the last year, and at that rate of improvement, the serious delinquency rate should be below 1% next month.
By vintage, for loans made in 2004 or earlier (4% of portfolio), 2.63% are seriously delinquent. For loans made in 2005 through 2008 (7% of portfolio), 5.71% are seriously delinquent, For recent loans, originated in 2009 through 2017 (89% of portfolio), only 0.32% are seriously delinquent. So Fannie is still working through poor performing loans from the bubble years.
Note: Freddie Mac reported earlier.
Goldman: August Payrolls Preview
by Calculated Risk on 8/31/2017 12:57:00 PM
A few brief excerpts from a note by Goldman Sachs economist Spencer Hill:
We estimate nonfarm payrolls increased by 160k in August, below consensus of +180k ... Our forecast reflects somewhat more mixed labor market fundamentals and a drag from residual seasonality, as first-reported August payroll growth has been consistently weak in recent years.
We expect household job growth will be sufficient to leave the unemployment rate unchanged at 4.3%, but due to particularly unfavorable calendar effects, we estimate a 0.1% monthly rise in average hourly earnings (+2.5% year-over-year).
August Employment Preview
by Calculated Risk on 8/31/2017 11:53:00 AM
On Friday at 8:30 AM ET, the BLS will release the employment report for August. The consensus, according to Bloomberg, is for an increase of 180,000 non-farm payroll jobs in August (with a range of estimates between 140,000 to 200,000), and for the unemployment rate to be unchanged at 4.3%.
The BLS reported 209,000 jobs added in July.
Here is a summary of recent data:
• The ADP employment report showed an increase of 237,000 private sector payroll jobs in August. This was well above consensus expectations of 182,000 private sector payroll jobs added. The ADP report hasn't been very useful in predicting the BLS report for any one month, but in general, this suggests employment growth above expectations. However, the ADP number has frequently been above the BLS number for August.
• The ISM manufacturing and non-manufacturing indexes have not been released yet.
• Initial weekly unemployment claims averaged 237,000 in August, down from 242,000 in July. For the BLS reference week (includes the 12th of the month), initial claims were at 232,000, down from 234,000 during the reference week in July.
The decrease during the reference week suggests slightly fewer layoffs during the reference week in August than in July. This suggests a similar employment report in August as in July.
• The final August University of Michigan consumer sentiment index increased to 97.6 from the July reading of 93.4. Sentiment is frequently coincident with changes in the labor market, but there are other factors too like gasoline prices and politics.
• Conclusion: Unfortunately the ISM reports will be released after the employment report this month, and those reports are helpful. Also August tends to be below the ADP report (and frequently below consensus). My sense (mostly based on history) is that job gains will be below consensus in August.
NAR: Pending Home Sales Index decreased 0.8% in July, down 1.3% year-over-year
by Calculated Risk on 8/31/2017 10:03:00 AM
From the NAR: Pending Home Sales Lessen 0.8 Percent in July
Pending homes sales stumbled in July for the fourth time in five months as only the West saw an increase in contract activity, according to the National Association of Realtors®.This was below expectations of a 0.8% increase for this index. Note: Contract signings usually lead sales by about 45 to 60 days, so this would usually be for closed sales in August and September.
The Pending Home Sales Index, a forward-looking indicator based on contract signings, decreased 0.8 percent to 109.1 in July from a downwardly revised 110.0 in June. After last month’s decline, the index is now 1.3 percent below a year ago and has fallen on an annual basis in three of the past four months.
...
The PHSI in the Northeast inched backward 0.3 percent to 97.7 in July, but is still 2.4 percent above a year ago. In the Midwest the index decreased 0.7 percent to 103.3 in July, and is now 2.8 percent lower than July 2016.
Pending home sales in the South declined 1.7 percent to an index of 123.1 in July and are now 0.2 percent below last July. The index in the West expanded 0.6 percent in July to 102.3, but is still 4.0 percent below a year ago.
emphasis added


