 RSS Feed
 by Calculated Risk on 2/09/2017 08:40:00 AM
Thursday, February 09, 2017
Weekly Initial Unemployment Claims decrease to 234,000
The DOL reported:
In the week ending February 4, the advance figure for seasonally adjusted initial claims was 234,000, a decrease of 12,000 from the previous week's unrevised level of 246,000. The 4-week moving average was 244,250, a decrease of 3,750 from the previous week's unrevised average of 248,000. This is the lowest level for this average since November 3, 1973 when it was 244,000.The previous week was unrevised.
emphasis added
The following graph shows the 4-week moving average of weekly claims since 1971.
 Click on graph for larger image.
The dashed line on the graph is the current 4-week average. The four-week average of weekly unemployment claims decreased to 244,250.
This was below the consensus forecast.
The low level of claims suggests relatively few layoffs.
Wednesday, February 08, 2017
Mortgage rates decline for the third straight day
by Calculated Risk on 2/08/2017 06:22:00 PM
From Matthew Graham at Mortgage News Daily: Mortgage Rates Doing Very Well This Week
Mortgage rates fell for the third straight day today. Each day has seen moderate improvement. Taken together, they add up to a strong move lower from last week's levels (which were roughly in the lower-middle of the post-election range). The result is that some lenders are at or near their lowest rates in nearly 3 MONTHS (yesterday it was 3 WEEKS). The average lender has only had 3 days during that time where rates were any better.Here is a table from Mortgage News Daily:
There are plenty of opinions about what's behind this week's falling rates ranging from politics to last week's jobs report causing a shift in Fed rate hike expectations. All that matters is that investors have shifted to a more risk-averse stance resulting in better demand for less risky assets like bonds. Higher demand for bonds means lower rates.
4.125% remains the most common conventional 30yr fixed quote for top tier scenarios. There are now very few lenders still stuck up at 4.25% (keep in mind that we're talking about a perfect loan file with no negative adjustments for loan-to-value, FICO, etc..)
emphasis added
Update: Framing Lumber Prices Up Year-over-year
by Calculated Risk on 2/08/2017 02:22:00 PM
Here is another update on framing lumber prices. Early in 2013 lumber prices came close to the housing bubble highs.
The price increases in early 2013 were due to a surge in demand (more housing starts) and supply constraints (framing lumber suppliers were working to bring more capacity online).
Prices didn't increase as much early in 2014 (more supply, smaller "surge" in demand).
In 2015, even with the pickup in U.S. housing starts, prices were down year-over-year. Note: Multifamily starts do not use as much lumber as single family starts, and there was a surge in multi-family starts. This decline in 2015 was also probably related to weakness in China.
Prices in 2017 are up year-over-year.
 Click on graph for larger image in graph gallery.
This graph shows two measures of lumber prices: 1) Framing Lumber from Random Lengths through early February 2017 (via NAHB), and 2) CME framing futures.
Right now Random Lengths prices are up 17% from a year ago, and CME futures are up about 40% year-over-year.
Lawler on Household Projections
by Calculated Risk on 2/08/2017 10:51:00 AM
From housing economist Tom Lawler: Household Projections: New Population Estimates + New Administration = Time for an Update
When the Census Bureau released its estimates for the U.S. population in December, most press coverage focused on which states saw the fastest population growth last year. What many missed, however, was that the Census Bureau significantly reduced its population estimates for each of the past several years, with the major reason for the downward revisions stemming from reduced estimates of net international migration. The latter reductions were the result up an updated methodology used to estimate foreign-born emigration, as discussed in the following excerpt from the 2016 vintage “release notes.”
“The Vintage 2016 net international migration estimates reflect the following changes to the methodology since the release of the Vintage 2015 estimates:Here are some summary statistics on “Vintage 2016” population estimates (resident population” compared to “Vintage 2015” population estimates. I’m including Census projections for 2016 that had been based on Vintage 2015 estimates (used for CPS-based data for 2016) as well as a December 1, 2016 estimate based on Vintage 2016.
“We updated the foreign-born emigration subcomponent in two ways: 1) we modified the emigrant group definitions used to calculate estimates of foreign-born emigration; 2) we applied averaged rates from multiple 5-year ACS files for non-recent arrivals (Mexican born who arrived more than 10 years ago, Asian born who arrived more than five years ago, and Non-Mexican born who arrived more than 10 years ago). These changes resolve negative rates produced by the previous residual method, which had resulted in zero emigration for certain emigrant groups. Consequently, foreign-born emigration will be higher and net international migration will be lower than the previous vintage.”
| U.S. Resident Population, Vintage 2015 vs. Vintage 2016 | |||
|---|---|---|---|
| Vintage 2015 | Vintage 2016 | Change | |
| 7/1/2010 | 309,346,863 | 309,348,193 | 1,330 |
| 7/1/2011 | 311,718,857 | 311,663,358 | -55,499 |
| 7/1/2012 | 314,102,623 | 313,998,379 | -104,244 |
| 7/1/2013 | 316,427,395 | 316,204,908 | -222,487 |
| 7/1/2014 | 318,907,401 | 318,563,456 | -343,945 |
| 7/1/2015 | 321,418,820 | 320,896,618 | -522,202 |
| 7/1/2016 | 323,889,854 | 323,127,513 | -762,341 |
| 12/1/2016 | 325,032,763 | 324,142,480 | -890,283 |
The next table shows Census estimates of Net International Migration from the “Vintage 2015” population estimates compared to the most recent (“Vintage 2016”) estimates.
| Net International Migration, July 1 - July 1, Vintage 2015 vs. Vintage 2016 | |||
|---|---|---|---|
| Vintage 2015 | Vintage 2016 | Change | |
| 2011 | 910,951 | 854,172 | -56,779 |
| 2012 | 948,321 | 899,576 | -48,745 |
| 2013 | 992,215 | 873,972 | -118,243 |
| 2014 | 1,133,261 | 977,801 | -155,460 |
| 2015 | 1,150,528 | 1,036,826 | -113,702 |
| 2016* | 1,160,000 | 999,163 | -160,837 |
| *Estimate for Vintage 2015 projections | |||
These downward population revisions were reflected in last Friday’s employment report, which showed the impact of updated population estimates on the 16+ year civilian non-institutional population assumptions used to produce employment and labor force estimates based on the “household” (CPS) survey.
| 16+ Civilian Non-Institutional Population, Household Employment Report, December 2016 (000’s) | |||
|---|---|---|---|
| Vintage 2015 | Vintage 2016 | Change | |
| Total | 254,742 | 253,911 | -831 |
| White | 198,845 | 198,376 | -469 |
| Black | 32,105 | 32,029 | -76 |
| Asian | 15,433 | 15,175 | -258 |
| Other | 8,359 | 8,331 | -28 |
| Hispanic or Latino Ethnicity* | 41,190 | 40,838 | -352 |
| *Persons whose ethnicity is described as Hispanic or Latino may be of any race | |||
While Census has not yet updated its estimates of age distribution of the population, data released as part of last Friday’s report allow one to estimate downward revisions in the 16+ civilian non-institutional population by age.
| 16+ Civilian Non-Institutional Population by Age Group Derived from* Household Employment Report, December 2016 (000's) | |||
|---|---|---|---|
| Age Group | Vintage 2015 | Vintage 2017 | Change |
| 16-24 | 38,348 | 38,265 | -83 |
| 25-34 | 43,839 | 43,692 | -147 |
| 35-44 | 39,919 | 39,763 | -156 |
| 45-54 | 42,212 | 42,103 | -109 |
| 55-64 | 41,587 | 41,468 | -119 |
| 65-74 | 28,913 | 28,794 | -119 |
| 75+ | 19,924 | 19,826 | -98 |
| Total | 254,742 | 253,911 | -831 |
| *LEHC estimates | |||
These new population estimates will, of course, be used by Census to produce household estimates based on the 2017 CPS/ASEC. However, Census typically does not revise previous-year estimates to reflect revisions in population estimates. As such, the change in the CPS/ASEC household estimate for March 2017 compared to the March 2017 estimate will probably be about 450,000 or so lower than it would have been without the recent methodological change used to estimate net international migration
These latest population revisions, including updated projections from Census for 2017, suggest that household projections based on the latest long-term population projections made by Census in December 2014 are woefully out of date. Here is a table comparing the population projections in that report for 2014, 2015, 2016, and 2017 compared to the most recent population estimates and projections (the latter of which only extend to 2017).
| 2015 Population Projections vs. Latest Estimates/Projections, U.S. Resident Population (000’s) | |||
|---|---|---|---|
| Projection from December 2014 | Latest Estimates/ Projections | Change | |
| 7/1/2014 | 318,748 | 318,563 | -185 |
| 7/1/2015 | 321,369 | 320,877 | -492 |
| 7/1/2016 | 323,996 | 323,128 | -868 |
| 7/1/2017 | 326,626 | 325,534 | -1,092 |
As the table shows, the most recent projection of the US resident population for 2017 is almost 1.1 million lower than the projection from late 2014.
 Given (1) the improved methodology to estimate net international migration, and (2) the Trump administration’s potential policies on immigration, it seems extremely likely that an updated long-term population projection would produce hugely different population projections for years subsequent to 2017 than those shown in the “latest” Census projections from late 2014. E.g., here is a table showing the components of change from Census’ long-term population projections from late 2014.
While updated estimates suggest that net international migration averaged about 900,000 over the past 5 years, the late 2014 projections assumed an average of about 1.256 million from 2015 to 2020. Even without the “Trump win” that number would currently be considered way to high, and today such a projection seems, in the words of demographer Dr. Vizzini, “inconceivable.”
For folks wondering why I am comparing recent estimates to a Census projection from December 2014, the reason is that the December 2014 projection is that latest the Census has released, and those projections have been used by quite a few analysts/institutions/organizations/etc. to produce and publish long-term projections of the number of US households. Indeed, in an unluckily-timed report released just eight days before the Census released it “Vintage 2016” population numbers, the Joint Center for Housing Studies published new household projections based on Census population projections from December 2014! (There are other serious problems with the JCHS report, but I won’t dwell on those).
So ... If one both incorporated the latest Census population projections (including its new methodology for measuring net international migration), AND used updated assumptions on births, deaths, and net international migration for the next several years, what would an updated population projection look like? E.g., how should one translate what Trump and Trump officials (as well as Congressional officials) have said about immigration into a projection of net international migration? Frankly, I don’t know.
But let’s just make an “educated guess” that net international migration would be at a level lower than it recently has been, and let’s arbitrarily pick an average of 750,000. Combed with reasonable projections for birth and dealt rates, that would produce a population projection of something like that shown in the table below. (I am not adjusting Census’ latest projection for 2017).
| US Resident Population Estimates and Projections (000's) | |||
|---|---|---|---|
| December 2014 Projection | "More Trumpian" | Difference | |
| 7/1/2015 | 321,369 | 320,877 | -492 |
| 7/1/2016 | 323,996 | 323,128 | -868 |
| 7/1/2017 | 326,626 | 325,534 | -1,092 |
| 7/1/2018 | 329,256 | 327,647 | -1,609 |
| 7/1/2019 | 331,884 | 329,751 | -2,133 |
| 7/1/2020 | 334,503 | 331,840 | -2,663 |
If such a lower net international migration number were to occur, then a “more reasonable” projection of the US resident population in 2020 would be a whopping 2.663 million below the projection in Census’ December 2014 population forecast used by quite a few analysts to project US household growth. The vast bulk of this reduction would be (1) in the adult population, and (2) in the foreign-born population. I have not yet attempted to see how such a different population projection would translate into a household projection, but some might call it “YUGE” enough to warrant throwing out household projections based on the “latest official” Census population projections, and instead focus on an updated forecast based on more reasonable population projections.
MBA: Mortgage Applications Increase in Latest Weekly Survey
by Calculated Risk on 2/08/2017 07:00:00 AM
From the MBA: Mortgage Applications Increase in Latest MBA Weekly Survey
Mortgage applications increased 2.3 percent from one week earlier, according to data from the Mortgage Bankers Association’s (MBA) Weekly Mortgage Applications Survey for the week ending February 3, 2017.
... The Refinance Index increased 2 percent from the previous week. The seasonally adjusted Purchase Index increased 2 percent from one week earlier. The unadjusted Purchase Index increased 9 percent compared with the previous week and was 4 percent higher than the same week one year ago.
...
The average contract interest rate for 30-year fixed-rate mortgages with conforming loan balances ($424,000 or less) decreased to 4.35 percent from 4.39 percent, with points remaining unchanged at 0.34 (including the origination fee) for 80 percent loan-to-value ratio (LTV) loans.
emphasis added
 Click on graph for larger image.
The first graph shows the refinance index since 1990.
It would take a substantial decrease in mortgage rates to see a significant increase in refinance activity - although we might see more cash-out refis.
 The second graph shows the MBA mortgage purchase index.
 Even with the recent increase in mortgage rates, purchase activity is still holding up.
However refinance activity has declined significantly.
Tuesday, February 07, 2017
Las Vegas Real Estate in January: Sales up 13.9% YoY, Inventory down Sharply
by Calculated Risk on 2/07/2017 02:11:00 PM
This is a key distressed market to follow since Las Vegas has seen the largest price decline of any of the Case-Shiller composite 20 cities.
The Greater Las Vegas Association of Realtors reported Southern Nevada Home Prices Rise to Start 2017, GLVAR Housing Statistics for January 2017
The Greater Las Vegas Association of REALTORS® (GLVAR) reported Tuesday that Southern Nevada home prices started 2017 with a relatively rare January jump while the number of homes available for sale continued to shrink.1) Overall sales were up 13.9% year-over-year.
...
The total number of existing local homes, condos and townhomes sold in January was 2,675, up from 2,348 in January 2016. Compared to one year ago, sales were up 14.1 percent for homes and up 13.2 percent for condos and townhomes. According to GLVAR, a total of 41,720 such properties were sold in 2016. That was more than the 38,577 properties sold during 2015. It was also more than in 2014, but fewer than during each of the previous five years.
...
By the end of January, GLVAR reported 5,852 single-family homes listed for sale without any sort of offer. That’s down 21.2 percent from one year ago. For condos and townhomes, the 811 properties listed without offers in January represented a 63.4 percent decrease from one year ago.
...
In recent years, GLVAR has been reporting fewer distressed sales and more traditional home sales, where lenders are not controlling the transaction. That trend continued in January, when 4.2 percent of all local sales were short sales – which occur when lenders allow borrowers to sell a home for less than what they owe on the mortgage. That’s down from 7.0 percent of all sales in January 2016. Another 6.8 percent of all January sales were bank-owned, down from 7.9 percent one year ago.
emphasis added
2) Active inventory (single-family and condos) is down sharply from a year ago (A very sharp decline in condo inventory).
3) Fewer distressed sales.
BLS: Job Openings "little changed" in December
by Calculated Risk on 2/07/2017 10:06:00 AM
From the BLS: Job Openings and Labor Turnover Summary
The number of job openings was little changed at 5.5 million on the last business day of December, the U.S. Bureau of Labor Statistics reported today. Over the month, hires and separations were also little changed at 5.3 million and 5.0 million, respectively. ...The following graph shows job openings (yellow line), hires (dark blue), Layoff, Discharges and other (red column), and Quits (light blue column) from the JOLTS.
...
The number of quits was little changed in December at 3.0 million. The quits rate was 2.0 percent. Over the month, the number of quits was little changed for total private and for government.
emphasis added
This series started in December 2000.
Note: The difference between JOLTS hires and separations is similar to the CES (payroll survey) net jobs headline numbers. This report is for December, the most recent employment report was for January.
 Click on graph for larger image.
Note that hires (dark blue) and total separations (red and light blue columns stacked) are pretty close each month. This is a measure of labor market turnover. When the blue line is above the two stacked columns, the economy is adding net jobs - when it is below the columns, the economy is losing jobs.
Jobs openings were mostly unchanged in December at 5.501 million compared to 5.505 million in November. Job openings are mostly moving sideways at a high level.
The number of job openings (yellow) are up 4% year-over-year.
Quits are down 3% year-over-year. These are voluntary separations. (see light blue columns at bottom of graph for trend for "quits").
This is another solid report.
CoreLogic: House Prices up 7.2% Year-over-year in December
by Calculated Risk on 2/07/2017 09:07:00 AM
Notes: This CoreLogic House Price Index report is for December. The recent Case-Shiller index release was for November. The CoreLogic HPI is a three month weighted average and is not seasonally adjusted (NSA).
From CoreLogic: CoreLogic US Home Price Report Shows Prices Up 7.2 Percent in December 2016
Home prices nationwide, including distressed sales, increased year over year by 7.2 percent in December 2016 compared with December 2015 and increased month over month by 0.8 percent in December 2016 compared with November 2016, according to the CoreLogic HPI.
...
“As of the end of 2016, the CoreLogic national index was 3.9 percent below the peak reached in April 2006,” said Dr. Frank Nothaft, chief economist for CoreLogic. “We expect our national index to rise 4.7 percent during 2017, which would put homes prices at a new nominal peak before the end of this year.”
“Last year ended with a bang with home prices up over 7 percent nationally, led largely by major metro areas,” said Anand Nallathambi, president and CEO of CoreLogic. “We expect prices to continue to rise just under 5 percent in 2017 buoyed by lack of supply and continued high demand.”
emphasis added
 Click on graph for larger image.
 This graph shows the national CoreLogic HPI data since 1976. January 2000 = 100.
The index was up 0.8% in December (NSA), and is up 7.2% over the last year.
This index is not seasonally adjusted, and this was another solid month-to-month increase.
The index is still 3.9% below the bubble peak in nominal terms (not inflation adjusted).
 The second graph shows the YoY change in nominal terms (not adjusted for inflation).
The YoY increase had been moving sideways over the last two years, but might have picked up recently (the recent pickup could be revised away).
The year-over-year comparison has been positive for almost five consecutive years since turning positive year-over-year in February 2012.
Trade Deficit at $44.3 Billion in December
by Calculated Risk on 2/07/2017 08:51:00 AM
From the Department of Commerce reported:
The U.S. Census Bureau and the U.S. Bureau of Economic Analysis, through the Department of Commerce, announced today that the goods and services deficit was $44.3 billion in December, down $1.5 billion from $45.7 billion in November, revised. December exports were $190.7 billion, $5.0 billion more than November exports. December imports were $235.0 billion, $3.6 billion more than November imports.The trade deficit was smaller than the consensus forecast.
...
For 2016, the goods and services deficit increased $1.9 billion, or 0.4 percent, from 2015. Exports decreased $51.7 billion or 2.3 percent. Imports decreased $49.9 billion or 1.8 percent.
The first graph shows the monthly U.S. exports and imports in dollars through December 2016.
 Click on graph for larger image.
Imports and exports increased in December.
Exports are 15% above the pre-recession peak and up 4% compared to December 2015; imports are slightly above the pre-recession peak, and up 5% compared to December 2015.
It appears trade might is picking up a little.
The second graph shows the U.S. trade deficit, with and without petroleum.
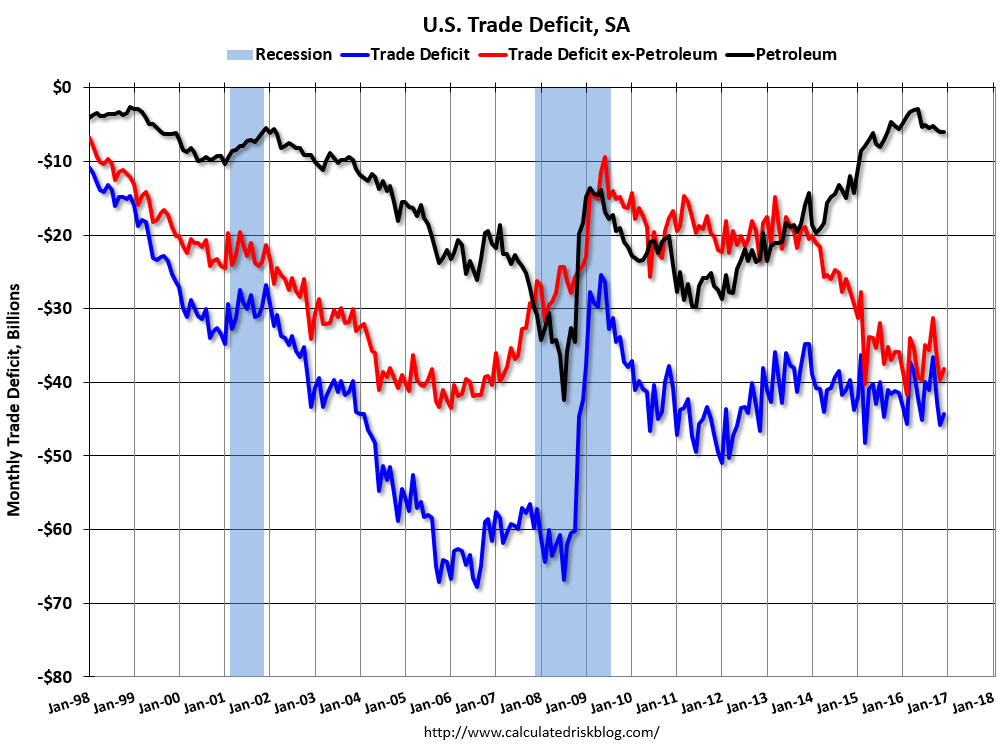 The blue line is the total deficit, and the black line is the petroleum deficit, and the red line is the trade deficit ex-petroleum products.
Oil imports averaged $41.45 in December, up from $40.82 in November, and up from $36.63 in December 2015. The petroleum deficit has generally been declining and is the major reason the overall deficit has declined a little since early 2012.
The trade deficit with China decreased to $27.8 billion in November, from $27.9 billion in December 2015. The deficit with China is a substantial portion of the overall deficit, but the deficit with China has generally been declining.
Monday, February 06, 2017
Tuesday: Trade Deficit, Job Openings
by Calculated Risk on 2/06/2017 07:27:00 PM
Tuesday:
• At 6:00 AM ET, NFIB Small Business Optimism Index for January.
• At 8:30 AM, Trade Balance report for December from the Census Bureau. The consensus is for the U.S. trade deficit to be at $44.9 billion in December from $45.2 billion in November.
• At 10:00 AM, Job Openings and Labor Turnover Survey for December from the BLS. Jobs openings increased in November to 5.522 million from 5.451 million in October. The number of job openings (yellow) were up 6% year-over-year, and Quits were up 7% year-over-year.
• At 3:00 PM, Consumer credit from the Federal Reserve. The consensus is for a $20.0 billion increase in credit.


