 RSS Feed
 by Calculated Risk on 2/03/2017 08:49:00 AM
Friday, February 03, 2017
January Employment Report: 227,000 Jobs, 4.8% Unemployment Rate (Graphs included)
From the BLS:
Total nonfarm payroll employment increased by 227,000 in January, and the unemployment rate was little changed at 4.8 percent, the U.S. Bureau of Labor Statistics reported today. Job gains occurred in retail trade, construction, and financial activities.
...
The change in total nonfarm payroll employment for November was revised down from +204,000 to +164,000, and the change for December was revised up from +156,000 to +157,000. With these revisions, employment gains in November and December combined were 39,000 lower than previously reported.
...
In January, average hourly earnings for all employees on private nonfarm payrolls rose by 3 cents to $26.00, following a 6-cent increase in December. Over the year, average hourly earnings have risen by 2.5 percent.
...
[Annual Benchmark Revision] The total nonfarm employment level for March 2016 was revised downward by 60,000 (-81,000 on a not seasonally adjusted basis, or -0.1 percent). ... The effect of these revisions on the underlying trend in nonfarm payroll employment was minor.
emphasis added
 Click on graph for larger image.
The first graph shows the monthly change in payroll jobs, ex-Census (meaning the impact of the decennial Census temporary hires and layoffs is removed - mostly in 2010 - to show the underlying payroll changes).
Total payrolls increased by 227 thousand in January (private payrolls increased 237 thousand).
Payrolls for November and December were revised down by a combined 39 thousand.
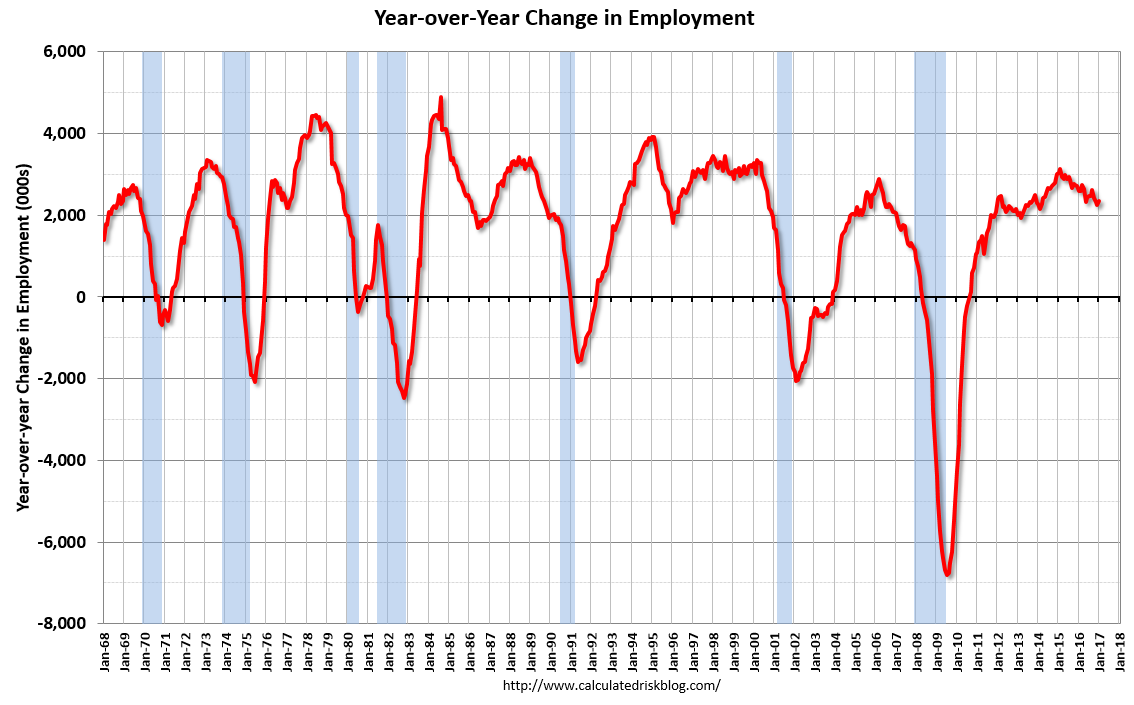 This graph shows the year-over-year change in total non-farm employment since 1968.
In January, the year-over-year change was 2.34 million jobs. This is a solid year-over-year gain.
The third graph shows the employment population ratio and the participation rate.
 The Labor Force Participation Rate increased in January to 62.9%. This is the percentage of the working age population in the labor force. A large portion of the recent decline in the participation rate is due to demographics.
 The Employment-Population ratio was increased to 59.9% (black line).
I'll post the 25 to 54 age group employment-population ratio graph later.
 The fourth graph shows the unemployment rate.
 The unemployment rate increased in January to 4.8%.
This was above expectations of 175,000 jobs, however the previous two months were revised down. Another solid report.
I'll have much more later ...
January Employment Report: 227,000 Jobs, 4.8% Unemployment Rate
by Calculated Risk on 2/03/2017 08:32:00 AM
From the BLS:
Total nonfarm payroll employment increased by 227,000 in January, and the unemployment rate was little changed at 4.8 percent, the U.S. Bureau of Labor Statistics reported today. Job gains occurred in retail trade, construction, and financial activities.This was above the consensus forecast.
...
The change in total nonfarm payroll employment for November was revised down from +204,000 to +164,000, and the change for December was revised up from +156,000 to +157,000. With these revisions, employment gains in November and December combined were 39,000 lower than previously reported.
...
In January, average hourly earnings for all employees on private nonfarm payrolls rose by 3 cents to $26.00, following a 6-cent increase in December. Over the year, average hourly earnings have risen by 2.5 percent.
...
[Annual Benchmark Revision] The total nonfarm employment level for March 2016 was revised downward by 60,000 (-81,000 on a not seasonally adjusted basis, or -0.1 percent). ... The effect of these revisions on the underlying trend in nonfarm payroll employment was minor.
emphasis added
Note: I'll post graphs soon - the data is being updated due to the annual benchmark revision.
Thursday, February 02, 2017
Friday: Jobs and Wages
by Calculated Risk on 2/02/2017 08:27:00 PM
Earlier:, my January Employment Preview and Goldman: January Employment Preview
Friday:
• At 8:30 AM ET, Employment Report for January. The consensus is for an increase of 175,000 non-farm payroll jobs added in January, up from the 156,000 non-farm payroll jobs added in December. The consensus is for the unemployment rate to be unchanged at 4.7%.
• At 10:00 AM, Manufacturers' Shipments, Inventories and Orders (Factory Orders) for December. The consensus is a 0.9% increase in orders.
• Also at 10:00 AM: the ISM non-Manufacturing Index for January. The consensus is for index to increase to 57.2 from 57.1 in December.
Some Random Concerns and Observations ...
by Calculated Risk on 2/02/2017 05:33:00 PM
In addition to Captain Chaos (aka Agent Orange) ... here are a few random concerns and observations:
• From Bloomberg: China’s Army of Global Homebuyers Is Suddenly Short on Cash
China’s escalating crackdown on capital outflows is sending shudders through property markets around the world. ... In Silicon Valley, Keller Williams Realty says inquiries from China have slumped since the start of the year. And in Sydney, developers are facing “big problems” as Chinese buyers pull back, according to consultancy firm Basis Point.If this continues, it could have a significant impact on housing, especially in some areas of the west coast.
“Everything changed’’ as it became more difficult to send money offshore, said Coco Tan, a broker associate at Keller Williams in Cupertino, California.
• After the election, many analysts thought the priorities of the new administration would be tax cuts, infrastructure spending, and deregulation. Goldman Sachs analysts thought the negative policies - immigration and trade - would be delayed until at least 2018. So far the new administration has delayed the policies with potential short term economic benefits - and pushed the negative policies. This could have negative economic consequences.
• An airplane broker mentioned to me this morning that the high end used airplane business has slowed recently. Maybe this is related to less money from China and the strong dollar (fewer foreign buyers).
• A couple of observation about coastal California housing: There are many new high end homes under construction (this is all replacing existing stock with high end homes). I've never seen this many homes under construction in the coastal areas. Also there are many homes for rent (maybe this is just seasonal). It just seems odd.
Goldman: January Employment Preview
by Calculated Risk on 2/02/2017 02:47:00 PM
A few excerpts from a note by Goldman Sachs economist Spencer Hill: January Payrolls Preview
We forecast that nonfarm payrolls rose 200k in January, following an increase of 156k in December, with reacceleration reflecting a combination of lower-than-usual year-end layoffs, favorable weather effects, and further improvement in labor market indicators.CR note: the consensus is for a 175k jobs added in January, and for the unemployment rate to be unchanged at 4.7%.
We believe the U3 unemployment rate is likely to fall one-tenth to 4.6% – which would mark a return to the cycle low – in part driven by reduced year-end retail layoffs. We expect average hourly earnings to rise 0.3% month over month and 2.8% year over year, reflecting firming labor markets and state-level minimum wage hikes.
The report will also be accompanied by the annual benchmark revision to the establishment survey as well as the annual introduction of new population controls in the household survey.
January Employment Preview
by Calculated Risk on 2/02/2017 01:03:00 PM
On Friday at 8:30 AM ET, the BLS will release the employment report for January. The consensus, according to Bloomberg, is for an increase of 175,000 non-farm payroll jobs in January (with a range of estimates between 155,000 to 195,000), and for the unemployment rate to be unchanged at 4.7%.
The BLS reported 156,000 jobs added in December.
Important note: Friday morning the BLS will also release the annual revision to "reflect the annual benchmark adjustment for March 2016 and updated seasonal adjustment factors." The preliminary estimate of the benchmark revision was for a decrease of 150,000 jobs as of March 2016.
Here is a summary of recent data:
• The ADP employment report showed an increase of 246,000 private sector payroll jobs in January. This was above expectations of 168,000 private sector payroll jobs added. The ADP report hasn't been very useful in predicting the BLS report for any one month, but in general, this suggests employment growth above expectations.
• The ISM manufacturing employment index increased in January to 56.1%. A historical correlation between the ISM manufacturing employment index and the BLS employment report for manufacturing, suggests that private sector BLS manufacturing payroll increased 14,000 in January. The ADP report indicated 15,000 manufacturing jobs added in January.
The ISM non-manufacturing employment index for January has not been released yet.
• Initial weekly unemployment claims averaged 248,000 in January, down from 257,000 in December. For the BLS reference week (includes the 12th of the month), initial claims were at 237,000, down from 275,000 during the reference week in December.
The increase during the reference suggests more layoffs during that week in December as compared to November. This suggests an above consensus employment report.
• The final December University of Michigan consumer sentiment index increased to 98.5 from the December reading of 98.2. Sentiment is frequently coincident with changes in the labor market, but there are other factors too like gasoline prices and politics.
• Conclusion: Unfortunately none of the indicators alone is very good at predicting the initial BLS employment report. However the ADP report, ISM manufacturing and weekly unemployment claims all suggest stronger job growth. So my guess is the January report will be above the consensus forecast.
Lawler: The Household Conundrum, Part II: The American Community Survey (ACS) Data
by Calculated Risk on 2/02/2017 11:02:00 AM
Earlier:
• Lawler: The Household Conundrum, Part I: The CPS/ASEC Data
• Lawler: The Household Conundrum, Part I Continued: The CPS/ASEC Data for 18-29 Year Olds
From housing economist Tom Lawler: The Household Conundrum, Part II: The American Community Survey (ACS) Data
Not including the Decennial Census, the American Community Survey is the largest survey that the Census Bureau administers, and it collects detailed socioeconomic information previously collected in the so-called “long form” of the Decennial Census from about one in every six households. The ACS is also a “mandatory” survey, as opposed to other Census surveys such as the CPS making “non-response” issues less of (though still somewhat of) an issue. Given its substantially larger sample (and in the past more timely sampling frame) than other periodic surveys, the ACS is widely viewed as the most reliable (though far from perfect) source of information on socioeconomic trends in the United States (and more especially for regional data).
From the perspective of certain types of housing analysis, however, the ACS data is of limited usefulness. For one, the ACS has only been fully up and running since 2005, and as such there is not a lot of historical data.
For another, ACS data are only available annually, and annual estimates (which are yearly averages) are based on population and housing units estimates available at the time of that year’s survey, that is, prior year estimates not updated to reflect revisions in historical population and housing unit counts. Stated a different way, the “time series” of ACS estimates is not consistent with the latest historical estimates either of the US population or of the US housing stock. (Time series estimates of households from the CPS/ASEC are also not consistent with revised estimates of population counts.)
There are also a few “technical” issues: e.g., the ACS’ “residence” rule (has the householder lived in the surveyed unit for over two months) is different from that of the Decennial Census (is this home the “usual residence” of the householder). While there is no clear evidence that this “residence rule” results in materially different household estimates, it’s still worth noting.
Having said that, below are comparisons of various household estimates from the ACS, the Decennial Census, and the CPS/ASEC for 2010. I have adjusted the CPS/ASEC estimates to reflect by “best guess” of what the estimates would have been if the CPS/ASEC had used Census 2010 counts. I have also adjusted the ACS estimates to reflect the estimated undercount of the housing unit count form the Decennial Census from the post Census Coverage Measurement Study (almost all of that undercount was in vacant housing units). The Census 2010 household counts are also adjusted to reflect the post-Census Coverage Measurement Study, although that undercount was extremely small. Also shown are homeownership rates estimates.
| Table 1: Various US Household Estimates by Age Group, 2010 (000's) | |||
|---|---|---|---|
| Census (Apr. 1) | ACS (Average) | CPS/ASEC (Mar.) | |
| Total | 116,752 | 115,255 | 118,760 |
| 15-24 | 5,403 | 4,931 | 6,325 |
| 25-34 | 17,963 | 17,901 | 19,173 |
| 35-44 | 21,298 | 21,387 | 21,729 |
| 45-54 | 24,915 | 24,793 | 25,113 |
| 55-64 | 21,347 | 21,220 | 20,777 |
| 65-74 | 13,509 | 13,296 | 13,400 |
| 75+ | 12,319 | 11,727 | 12,243 |
| Table 2: Various US Homeownership Rates by Age Group, 2010 (000's) | |||
|---|---|---|---|
| Census (Apr. 1) | ACS (Average) | CPS/ASEC (Mar.) | |
| Total | 65.1% | 65.4% | 67.1% |
| 15-24 | 16.1% | 14.7% | 22.8% |
| 25-34 | 42.0% | 41.3% | 45.0% |
| 35-44 | 62.3% | 61.9% | 65.5% |
| 45-54 | 71.5% | 71.7% | 73.5% |
| 55-64 | 77.3% | 77.9% | 78.6% |
| 65-74 | 80.2% | 81.1% | 82.0% |
| 75+ | 74.5% | 75.7% | 78.5% |
The ACS household counts are derived via a multi-stage process, but in effect the number is “controlled” to estimates of the US housing stock. Since the ACS vacancy rate estimate was higher than the “actuals” from the Decennial Census, the “occupied” housing unit count (or “households) was lower. The CPS/ASEC household estimates, in contrast, are controlled to population count estimates and do not take into account housing unit estimates. Thus even though CPS-based estimates of housing vacancy rates in 2010 were much higher than both Census and ACS estimates, the CPS/ASEC household estimate is higher. (The CPS-based household estimate from the Housing Vacancy Survey, which is controlled to the housing unit estimates, is materially lower than the ACS estimate). It is worth noting that if ACS estimates were controlled solely to population estimates and ignored housing unit count estimates, the household estimate would probably be higher (as was the case in 2005.)
Focusing on Table 1, ACS estimates by age group on balance match those of the Decennial Census better that those from the CPS/ASEC, though the ACS estimates for under 25-year old householders is a bit low (the CPS/ASEC estimates for this age group are way too high), and the same is true for householders 75 years or older.. Interestingly, household estimates for 35-64 year old householders are very similar in all three columns.
On the homeownership front, ACS estimates are significantly closer to Decennial Census results than CPS/ASEC estimates not just in aggregate, but across all age groups.
From the standpoint not just of aggregate household estimates but also household estimates by age and homeownership estimates, the ACS appears to be superior to the CPS/ASEC. It is still true, however, that ACS household estimates vary significantly from Decennial Census estimates.
The major reason the latter is true is that the ACS estimate of the housing vacancy rate in 2010 (13.07%) was well above the Decennial Census estimate adjusted to reflect post-Census coverage measurement (11.88%). (The CPS/HVS housing vacancy rate for all of 2010 was 14.34%).
It appears as if part of the ACS’s higher vacancy rate reflected misclassification of occupancy status (a “matching” of ACS to Decennial Census showed more units misclassified as vacant that units misclassified as occupied), though part may also be related to the different sampling frame (the 2010 ACS for the most part did not use the updated Master Address File compiled as part of the Decennial Census).
(more later)
Weekly Initial Unemployment Claims decrease to 246,000
by Calculated Risk on 2/02/2017 08:33:00 AM
The DOL reported:
In the week ending January 28, the advance figure for seasonally adjusted initial claims was 246,000, a decrease of 14,000 from the previous week's revised level. The previous week's level was revised up by 1,000 from 259,000 to 260,000. The 4-week moving average was 248,000, an increase of 2,250 from the previous week's revised average. The previous week's average was revised up by 250 from 245,500 to 245,750.The previous week was revised up.
emphasis added
The following graph shows the 4-week moving average of weekly claims since 1971.
 Click on graph for larger image.
The dashed line on the graph is the current 4-week average. The four-week average of weekly unemployment claims increased to 248,000.
This was below the consensus forecast.
The low level of claims suggests relatively few layoffs.
Wednesday, February 01, 2017
Thursday: Unemployment Claims
by Calculated Risk on 2/01/2017 06:37:00 PM
Thursday:
• At 8:30 AM ET, The initial weekly unemployment claims report will be released. The consensus is for 253 thousand initial claims, down from 259 thousand the previous week.
From Matthew Graham at Mortgage News Daily: Mortgage Rates Higher Despite Help From The Fed
Mortgage rates were higher to end the day, but not as high as they might have been without the Fed Statement. The day began with a series of strong economic reports. The ADP Employment Report was much stronger than expected, as was the employment component of the ISM Manufacturing report. Investors connect those dots to increased risk of a strong number in this Friday's all-important Employment Situation Report (the big jobs report). ... The Fed helped push rates back in the other direction this afternoon. While there were numerous minor changes in their verbiage, none of them did anything to accelerate the rate hike timeline or to threaten the Fed's current policy of reinvesting the interest it earns on its portfolio. That's one of the key reasons that rates are still historically low. With that, multiple lenders were able to improve rate sheets this afternoon. The net effect was still a slight move higher for closing costs, but the damage would have been much worse without the Fed.Here is a table from Mortgage News Daily:
emphasis added
U.S. Light Vehicle Sales decrease to 17.5 million annual rate in January
by Calculated Risk on 2/01/2017 02:38:00 PM
Based on a preliminary estimate from WardsAuto, light vehicle sales were at a 17.47 million SAAR in January.
That is down about 2% from January 2016, and down 4.5% from the 18.29 million annual sales rate last month.

Click on graph for larger image.
This graph shows the historical light vehicle sales from the BEA (blue) and an estimate for January (red, light vehicle sales of 17.47 million SAAR from WardsAuto).
This was below the consensus forecast of 17.7 million for January.
After two consecutive years of record sales, it looks like sales will mostly move sideways in 2017.
 The second graph shows light vehicle sales since the BEA started keeping data in 1967.
Note: dashed line is current estimated sales rate.


