 RSS Feed
 by Calculated Risk on 10/29/2016 08:12:00 AM
Saturday, October 29, 2016
Schedule for Week of Oct 30, 2016
The key report this week is the October employment report on Friday.
Other key indicators include the October ISM manufacturing and non-manufacturing indexes, October auto sales, and the September trade deficit.
The FOMC meets on Tuesday and Wednesday, and no change to policy is expected.
8:30 AM ET: Personal Income and Outlays for September. The consensus is for a 0.4% increase in personal income, and for a 0.5% increase in personal spending. And for the Core PCE price index to increase 0.1%.
9:45 AM: Chicago Purchasing Managers Index for October. The consensus is for a reading of 54.3, up from 54.2 in September.
10:30 AM: Dallas Fed Survey of Manufacturing Activity for October. This is the last of the regional Fed surveys for October.
 10:00 AM: ISM Manufacturing Index for October. The consensus is for the ISM to be at 51.6, up from 51.5 in September.
Here is a long term graph of the ISM manufacturing index.
The ISM manufacturing index indicated expansion at 51.5% in September. The employment index was at 49.7%, and the new orders index was at 55.1%.
10:00 AM: Construction Spending for September. The consensus is for a 0.6% increase in construction spending.
 All day: Light vehicle sales for October. The consensus is for light vehicle sales to decrease to 17.6 million SAAR in October, from 17.7 million in September (Seasonally Adjusted Annual Rate).
This graph shows light vehicle sales since the BEA started keeping data in 1967. The dashed line is the September sales rate.
7:00 AM ET: The Mortgage Bankers Association (MBA) will release the results for the mortgage purchase applications index.
8:15 AM: The ADP Employment Report for October. This report is for private payrolls only (no government). The consensus is for 170,000 payroll jobs added in October, up from 154,000 added in September.
2:00 PM: FOMC Meeting Announcement. No change to policy is expected at this meeting.
8:30 AM ET: The initial weekly unemployment claims report will be released. The consensus is for 255 thousand initial claims, down from 258 thousand the previous week.
10:00 AM: Manufacturers' Shipments, Inventories and Orders (Factory Orders) for September. The consensus is a 0.2% increase in orders.
10:00 AM: the ISM non-Manufacturing Index for October. The consensus is for index to decrease to 56.1 from 57.1 in August.
8:30 AM: Employment Report for October. The consensus is for an increase of 178,000 non-farm payroll jobs added in October, up from the 156,000 non-farm payroll jobs added in September.
The consensus is for the unemployment rate to decline to 4.9%.
 This graph shows the year-over-year change in total non-farm employment since 1968.
In September, the year-over-year change was 2.45 million jobs.
A key will be the change in wages.
 8:30 AM: Trade Balance report for September from the Census Bureau.
 This graph shows the U.S. trade deficit, with and without petroleum, through July. The blue line is the total deficit, and the black line is the petroleum deficit, and the red line is the trade deficit ex-petroleum products.
The consensus is for the U.S. trade deficit to be at $38.9 billion in September from $40.7 billion in August.
Friday, October 28, 2016
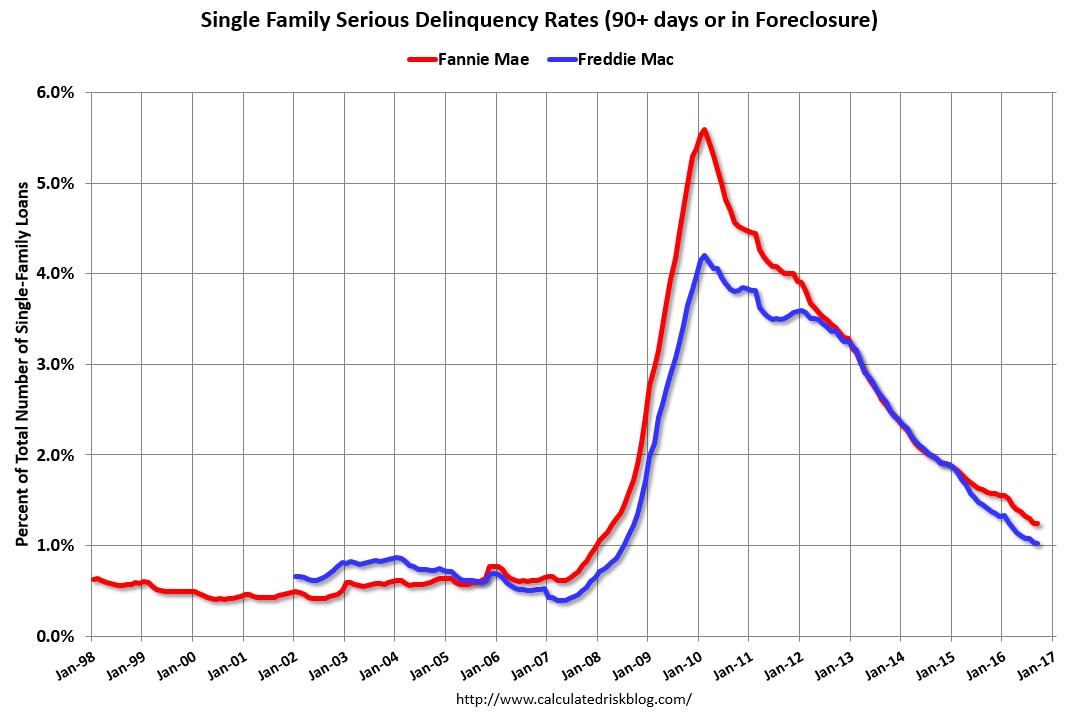
Fannie Mae: Mortgage Serious Delinquency rate unchanged in September
by Calculated Risk on 10/28/2016 05:04:00 PM
Fannie Mae reported today that the Single-Family Serious Delinquency rate was at 1.24% in September, unchanged from 1.24% in August. The serious delinquency rate is down from 1.59% in September 2015.
These are mortgage loans that are "three monthly payments or more past due or in foreclosure".
The Fannie Mae serious delinquency rate peaked in February 2010 at 5.59%.
 Click on graph for larger image
Although the rate is generally declining, the "normal" serious delinquency rate is under 1%.
The Fannie Mae serious delinquency rate has fallen 0.35 percentage points over the last year, and at that rate of improvement, the serious delinquency rate will not be below 1% for about 8 more months.
Note: Freddie Mac reported yesterday.
Q3 GDP: Investment
by Calculated Risk on 10/28/2016 02:05:00 PM
The graph below shows the contribution to GDP from residential investment, equipment and software, and nonresidential structures (3 quarter trailing average). This is important to follow because residential investment tends to lead the economy, equipment and software is generally coincident, and nonresidential structure investment trails the economy.
In the graph, red is residential, green is equipment and software, and blue is investment in non-residential structures. So the usual pattern - both into and out of recessions is - red, green, blue.
The dashed gray line is the contribution from the change in private inventories.
 Click on graph for larger image.
Residential investment (RI) decreased at a 6.2% annual rate in Q3. Equipment investment decreased at a 2.7% annual rate, and investment in non-residential structures increased at a 5.4% annual rate.
On a 3 quarter trailing average basis, RI (red) is unchanged, equipment (green) is slightly negative, and nonresidential structures (blue) is slightly positive.
I'll post more on the components of non-residential investment once the supplemental data is released.
I expect investment to pick up going forward, and for the economy to grow at a steady pace.

The second graph shows residential investment as a percent of GDP.
Residential Investment as a percent of GDP has generally been increasing, but is only just above the bottom of the previous recessions - and I expect RI to continue to increase for the next few years.
I'll break down Residential Investment into components after the GDP details are released.
Note: Residential investment (RI) includes new single family structures, multifamily structures, home improvement, broker's commissions, and a few minor categories.
 The third graph shows non-residential investment in structures, equipment and "intellectual property products". Investment in equipment - as a percent of GDP - has declined a little recently.. Investment in nonresidential structures - as a percent of GDP - had been moving down due to less investment in energy and power, and is now moving sideways.
Still no worries - residential investment will pickup (still very low), and non-residential will also pickup.
Goldman: FOMC Preview
by Calculated Risk on 10/28/2016 11:11:00 AM
A few excerpts from a piece by Goldman Sachs economists Zach Pandl and Jan Hatzius
• We expect the statement following next week’s FOMC meeting to remain relatively upbeat about US growth prospects ... However, the committee is very unlikely to raise the funds rate. ...CR note: The next FOMC meeting is next week, on November 1st and 2nd and it seems very unlikely there will be a change in policy at this meeting.
• To keep markets on notice for a possible rate hike in December, we expect the statement to indicate that the committee is considering action “at its next meeting”—although this is a close call. The statement will likely again say that risks to the economic outlook are “roughly balanced”.
• A statement along these lines should keep the committee on track to raise the funds rate at the December meeting. We see a 75% chance of an increase, roughly in line with market expectations. The remaining uncertainty relates to incoming economic data and financial conditions ... conditional on decent data and stable markets, a December rate hike looks very likely.
October Consumer Sentiment declines to 87.2
by Calculated Risk on 10/28/2016 10:04:00 AM
The final University of Michigan consumer sentiment index for October was at 87.2, down from the preliminary estimate of 87.9, and down from 91.2 in September.
The Sentiment Index slipped in October to the same low recorded last September and to the lowest level since October 2014. The October decline was due to less favorable prospects for the national economy, with half of all consumers anticipating an economic downturn sometime in the next five years for the first time since October 2014. Objectively, the probability of a downturn during the next five years is far from zero-this would be the longest expansion in 150 years if it lasted just over half of the five year horizon. Nonetheless, the October rise may simply reflect a temporary bout of uncertainty caused by the election.
emphasis added

Click on graph for larger image.
BEA: Real GDP increased at 2.9% Annualized Rate in Q3
by Calculated Risk on 10/28/2016 08:34:00 AM
From the BEA: Gross Domestic Product: Third Quarter 2016 (Advance Estimate)
Real gross domestic product increased at an annual rate of 2.9 percent in the third quarter of 2016, according to the "advance" estimate released by the Bureau of Economic Analysis. In the second quarter, real GDP increased 1.4 percent.The advance Q1 GDP report, with 2.9% annualized growth, was above expectations of a 2.5% increase.
...
he increase in real GDP in the third quarter reflected positive contributions from personal consumption expenditures (PCE), exports, private inventory investment, federal government spending, and nonresidential fixed investment that were partly offset by negative contributions from residential fixed investment and state and local government spending. Imports, which are a subtraction in the calculation of GDP, increased.
The acceleration in real GDP growth in the third quarter reflected an upturn in private inventory investment, an acceleration in exports, a smaller decrease in state and local government spending, and an upturn in federal government spending. These were partly offset by a smaller increase in PCE, and a larger increase in imports.
emphasis added
Personal consumption expenditures (PCE) increased at a 2.1% annualized rate in Q3, down from 4.3% in Q2. Residential investment (RI) decreased at a 6.2% pace. Equipment investment decreased at a 2.7% annualized rate, and investment in non-residential structures increased at a 5.4% pace.
I'll have more later ...
Thursday, October 27, 2016
Friday: GDP
by Calculated Risk on 10/27/2016 08:34:00 PM
From Goldman Sachs economist Elad Pashtan
Our final Q3 GDP tracking estimate stands at +2.9% (qoq ar), roughly in line with the consensus of forecasts that were updated after the September trade report. We look for a strong boost from net exports, solid consumer spending, a small contribution from capital expenditures, and another (albeit smaller) drag from inventories.Friday:
• At 8:30 AM ET, Gross Domestic Product, 3rd quarter 2016 (Advance estimate). The consensus is that real GDP increased 2.5% annualized in Q3.
• At 10:00 AM, University of Michigan's Consumer sentiment index (final for October). The consensus is for a reading of 88.5, up from the preliminary reading 87.9.
Freddie Mac: Mortgage Serious Delinquency rate declined slightly in September, Lowest since July 2008
by Calculated Risk on 10/27/2016 02:50:00 PM
Freddie Mac reported that the Single-Family serious delinquency rate declined in September to 1.02%, down from 1.03% in August. Freddie's rate is down from 1.41% in September 2015.
This is the lowest rate since July 2008.
Freddie's serious delinquency rate peaked in February 2010 at 4.20%.
These are mortgage loans that are "three monthly payments or more past due or in foreclosure".
 Click on graph for larger image
Although the rate is generally declining, the "normal" serious delinquency rate is under 1%.
The Freddie Mac serious delinquency rate has fallen 0.39 percentage points over the last year, and at that rate of improvement, the serious delinquency rate could be below 1% next month (October).
Note: Fannie Mae will report in the next few days.
HVS: Q3 2016 Homeownership and Vacancy Rates
by Calculated Risk on 10/27/2016 12:35:00 PM
The Census Bureau released the Residential Vacancies and Homeownership report for Q3 2016.
This report is frequently mentioned by analysts and the media to track household formation, the homeownership rate, and the homeowner and rental vacancy rates. However, there are serious questions about the accuracy of this survey.
This survey might show the trend, but I wouldn't rely on the absolute numbers. The Census Bureau is investigating the differences between the HVS, ACS and decennial Census, and analysts probably shouldn't use the HVS to estimate the excess vacant supply or household formation, or rely on the homeownership rate, except as a guide to the trend.
 Click on graph for larger image.
The Red dots are the decennial Census homeownership rates for April 1st 1990, 2000 and 2010. The HVS homeownership rate increased to 63.5% in Q3, from 62.9% in Q2.
I'd put more weight on the decennial Census numbers - and given changing demographics, the homeownership rate is probably close to a bottom.
 The HVS homeowner vacancy was unchanged at 1.8% in Q2.
Once again - this probably shows the general trend, but I wouldn't rely on the absolute numbers.
 The rental vacancy rate increased to 6.8% in Q2.
I think the Reis quarterly survey (large apartment owners only in selected cities) is a much better measure of the rental vacancy rate - and the Reis survey is showing rental vacancy rates have started to increase slightly.
The quarterly HVS is the most timely survey on households, but there are many questions about the accuracy of this survey.
Overall this suggests that vacancies have declined significantly, and my guess is the homeownership rate is probably close to the bottom.
Kansas City Fed: Regional Manufacturing Activity "Expanded Moderately" in October
by Calculated Risk on 10/27/2016 11:00:00 AM
From the Kansas City Fed: Tenth District Manufacturing Activity Expanded Moderately
The Federal Reserve Bank of Kansas City released the October Manufacturing Survey today. According to Chad Wilkerson, vice president and economist at the Federal Reserve Bank of Kansas City, the survey revealed that Tenth District manufacturing activity expanded again at a moderate pace.The Kansas City region was hit hard by the decline in oil prices, and it appears activity is starting to expand again.
“This was the second consecutive month of rising factory activity in the Tenth District, the first time that has happened in nearly two years,” said Wilkerson. “Much of the improvement recently has been in machinery and fabricated metals manufacturing.”
...
The month-over-month composite index was 6 in October, equal to 6 in September and up from -4 in August ... Most month-over-month indexes improved further in October. The production index edged higher from 15 to 18, and the shipments, new orders, and order backlog also rose moderately. The employment index climbed from -3 to 7, its highest level in almost two years. ...
emphasis added


