 RSS Feed
 by Calculated Risk on 3/01/2016 10:04:00 AM
Tuesday, March 01, 2016
ISM Manufacturing index increased to 49.5 in February
The ISM manufacturing index indicated contraction in February. The PMI was at 49.5% in February, up from 48.2% in January. The employment index was at 48.5%, up from 45.9% in January, and the new orders index was at 51.5%, unchanged from January.
From the Institute for Supply Management: February 2016 Manufacturing ISM® Report On Business®
Economic activity in the manufacturing sector contracted in February for the fifth consecutive month, while the overall economy grew for the 81st consecutive month, say the nation’s supply executives in the latest Manufacturing ISM® Report On Business®.
The report was issued today by Bradley J. Holcomb, CPSM, CPSD, chair of the Institute for Supply Management® (ISM®) Manufacturing Business Survey Committee. "The February PMI® registered 49.5 percent, an increase of 1.3 percentage points from the January reading of 48.2 percent. The New Orders Index registered 51.5 percent, the same reading as in January. The Production Index registered 52.8 percent, 2.6 percentage points higher than the January reading of 50.2 percent. The Employment Index registered 48.5 percent, 2.6 percentage points above the January reading of 45.9 percent. Inventories of raw materials registered 45 percent, an increase of 1.5 percentage points above the January reading of 43.5 percent. The Prices Index registered 38.5 percent, an increase of 5 percentage points above the January reading of 33.5 percent, indicating lower raw materials prices for the 16th consecutive month. Comments from the panel indicate a more positive view of demand than in January, as 12 of our 18 industries report an increase in new orders, while four industries report a decrease in new orders."
emphasis added
 Click on graph for larger image.
Here is a long term graph of the ISM manufacturing index.
This was above expectations of 48.5%, but still suggests manufacturing contracted in February.
CoreLogic: House Prices up 6.9% Year-over-year in January
by Calculated Risk on 3/01/2016 09:29:00 AM
Notes: This CoreLogic House Price Index report is for January. The recent Case-Shiller index release was for December. The CoreLogic HPI is a three month weighted average and is not seasonally adjusted (NSA).
From CoreLogic: CoreLogic US Home Price Report Shows Home Prices Up 6.9 Percent Year Over Year in January 2016
Home prices nationwide, including distressed sales, increased year over year by 6.9 percent in January 2016 compared with January 2015 and increased month over month by 1.3 percent in January 2016 compared with December 2015, according to the CoreLogic HPI.
...
“While the national market continues to steadily improve, the contours of the home price recovery are shifting,” said Dr. Frank Nothaft, chief economist for CoreLogic. “The northwest and Rocky Mountain states have experienced greater appreciation and account for four of the top five states for home price growth.”
emphasis added
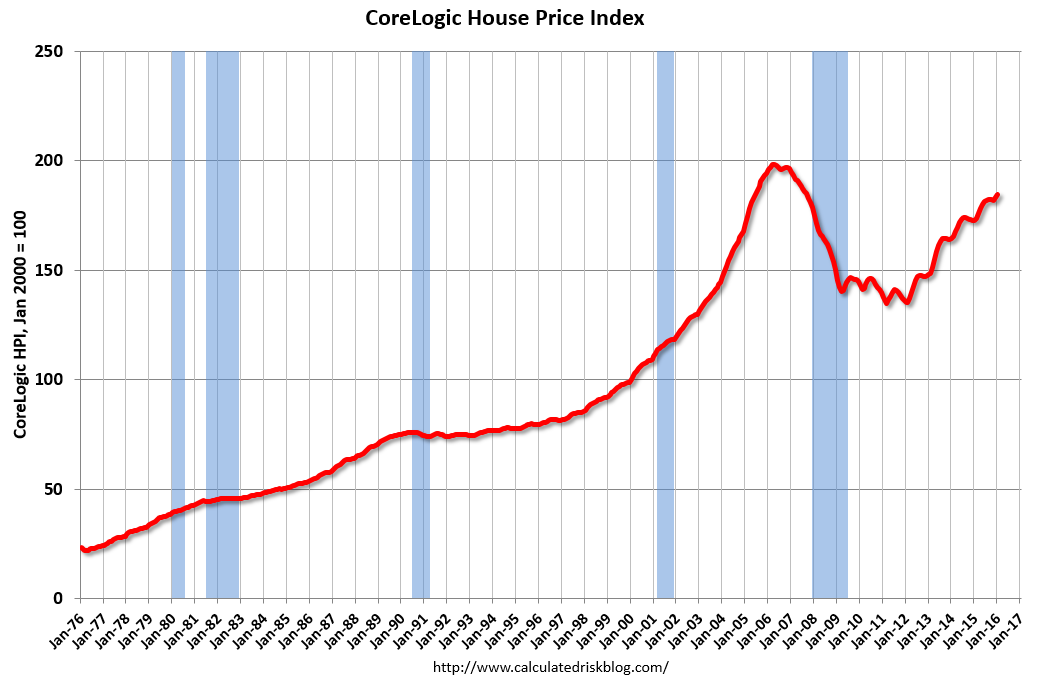 Click on graph for larger image.
 This graph shows the national CoreLogic HPI data since 1976. January 2000 = 100.
The index was up 1.3% in January (NSA), and is up 6.9% over the last year.
This index is not seasonally adjusted, and this was a solid month-to-month increase.
The second graph shows the YoY change in nominal terms (not adjusted for inflation).
 The YoY increase had been moving sideways over the last year, but has picked up a recently.
The year-over-year comparison has been positive for forty seven consecutive months.
Monday, February 29, 2016
Tuesday: ISM Mfg, Vehicle Sales, Construction Spending
by Calculated Risk on 2/29/2016 08:58:00 PM
From Matthew Graham at Mortgage News Daily: Mortgage Rates Sideways Again; Anxiety Builds
For now, the most prevalently-quoted conventional 30yr fixed rate remains 3.625% on top tier scenarios. Some of the less aggressive lenders are back up to 3.75%, but that was the case as of late last week as well.Tuesday:
• At 10:00 AM ET, ISM Manufacturing Index for February. The consensus is for the ISM to be at 48.5, up from 48.2 in January. The employment index was at 45.9%, and the new orders index was at 51.5%.
• Also at 10:00 AM, Construction Spending for January. The consensus is for a 0.5% increase in construction spending.
• All day, Light vehicle sales for February. The consensus is for light vehicle sales to increase to 17.6 million SAAR in February from 17.5 million in January (Seasonally Adjusted Annual Rate).
Fannie Mae: Mortgage Serious Delinquency rate unchanged in January
by Calculated Risk on 2/29/2016 04:24:00 PM
Fannie Mae reported today that the Single-Family Serious Delinquency rate was unchanged in January at 1.55%. The serious delinquency rate is down from 1.86% in January 2015.
The Fannie Mae serious delinquency rate peaked in February 2010 at 5.59%.
Note: These are mortgage loans that are "three monthly payments or more past due or in foreclosure".
Note: Freddie Mac reported last week that their Single-Family serious delinquency rate declined in January to 1.33%, up from 1.32% in December.
 Click on graph for larger image
The Fannie Mae serious delinquency rate has only fallen 0.31 percentage points over the last year - the pace of improvement has slowed - and at that pace the serious delinquency rate will not be below 1% until 2017.
The "normal" serious delinquency rate is under 1%, so maybe Fannie Mae serious delinquencies will be close to normal some time in 2017. This elevated delinquency rate is mostly related to older loans - the lenders are still working through the backlog.
Restaurant Performance Index indicates expansion in January
by Calculated Risk on 2/29/2016 02:27:00 PM
Here is a minor indicator I follow from the National Restaurant Association: Restaurant Performance Index Bounced Back Above 100 in January
Although same-store sales and customer traffic indicators remained mixed, the National Restaurant Association’s Restaurant Performance Index (RPI) bounced back above 100 in January. The RPI stood at 100.6 in January, up 0.8 percent from December’s level of 99.7. The January gain pushed the RPI above the 100 level, which signifies expansion in the index of key industry indicators.
...
“Despite an uptick in the RPI in the first month of the year, restaurant operators still report mixed results about their business environment,” said Hudson Riehle, senior vice president of research for the National Restaurant Association. “Except for the capital expenditures arena, the current situation indicators remain dampened. However, operators are somewhat more optimistic regarding higher sales in six months.”
emphasis added
 Click on graph for larger image.
The index increased to 100.6 in January, up from 99.7 in December. (above 100 indicates expansion).
Restaurant spending is discretionary, so even though this is "D-list" data, I like to check it every month.
Dallas Fed: "Texas Manufacturing Activity Contracts Again" in February
by Calculated Risk on 2/29/2016 10:35:00 AM
From the Dallas Fed: Texas Manufacturing Activity Contracts Again
Texas factory activity contracted again in February, according to business executives responding to the Texas Manufacturing Outlook Survey. The production index, a key measure of state manufacturing conditions, remained negative but edged up from -10.2 to -8.5, suggesting output declined but at a slightly softer pace than in January.This was the last of the regional Fed surveys for February. All five of the regional surveys indicated contraction in Febuary, especially in the Dallas region (oil prices).
Most other indexes of current manufacturing activity also indicated further contraction in February. The new orders index fell 8 points to -17.6, reaching its lowest level since May 2009, when Texas was in recession. The growth rate of orders index remained strongly negative at -17.4. The capacity utilization index was largely unchanged at -8.2. Meanwhile, the shipments index rose 10 points to -1.1 after plunging last month.
Perceptions of broader business conditions remained strongly negative in February. The general business activity index has been negative for more than a year and came in at -31.8, up slightly from the January reading. ...
Labor market indicators reflected further decline in February. The employment index dropped 7 points to -11.1, hitting its lowest reading since November 2009.
emphasis added
Here is a graph comparing the regional Fed surveys and the ISM manufacturing index:
 Click on graph for larger image.
The New York and Philly Fed surveys are averaged together (yellow, through February), and five Fed surveys are averaged (blue, through February) including New York, Philly, Richmond, Dallas and Kansas City. The Institute for Supply Management (ISM) PMI (red) is through January (right axis).
It seems likely the ISM index will be weak in February, and will probably show contraction again. The consensus is the ISM index will increase to 48.5% from 48.2% in January (below 50 is contraction).
NAR: Pending Home Sales Index decreased 2.5% in January, up 1.4% year-over-year
by Calculated Risk on 2/29/2016 10:01:00 AM
From the NAR: Pending Home Sales Cool Down in January
The Pending Home Sales Index, a forward-looking indicator based on contract signings, declined 2.5 percent to 106.0 in January from an upwardly revised 108.7 in December but is still 1.4 percent above January 2015 (104.5). Although the index has increased year-over-year for 17 consecutive months, last month’s annual gain was the second smallest (September 2014 at 1.2 percent) during the timeframe.This was below expectations of a 0.5% increase for this index. Note: Contract signings usually lead sales by about 45 to 60 days, so this would usually be for closed sales in February and March.
...
The PHSI in the Northeast declined 3.2 percent to 94.5 in January, but is still 10.9 percent above a year ago. In the Midwest the index fell 4.9 percent to 101.1 in January, but is still 1.4 percent above January 2015.
Pending home sales in the South inched up 0.3 percent to an index of 121.1 in January but remain 1.3 percent lower than last January. The index in the West decreased 4.5 percent in January to 96.5, but is still 0.4 percent above a year ago.
emphasis added
Chicago PMI declines to 47.6
by Calculated Risk on 2/29/2016 09:50:00 AM
Chicago PMI: Feb Chicago Business Barometer Down 8.0 pts to 47.6
The Chicago Business Barometer recoiled 8.0 points to 47.6 in February following a sharp increase to 55.6 in the previous month, led by significant declines in Production and New OrdersThis was well below the consensus forecast of 52.9.
...
The Barometer’s decline was led by an 18.5 drop in Production, which completely reversed January’s near 16 point gain, pushing it back into contraction. New Orders also fell sharply and Order Backlogs slipped further into contraction, a situation that has persisted for a year. Employment also declined significantly, leaving it at the lowest since November 2009 and the fifth consecutive month below 50.
...
Chief Economist of MNI Indicators Philip Uglow said, “If one looks beyond the gyrations seen over the past three months then trend activity has been running a little below the 50 neutral mark, highlighting continued sluggish activity levels, with manufacturers under particular pressure. Still, given the weakness in Q4, it looks like activity should pick up during Q1.”
emphasis added
Black Knight: House Price Index up 0.1% in December, Up 5.5% year-over-year
by Calculated Risk on 2/29/2016 08:11:00 AM
Note: I follow several house price indexes (Case-Shiller, CoreLogic, Black Knight, Zillow, FHFA, FNC and more). Note: Black Knight uses the current month closings only (not a three month average like Case-Shiller or a weighted average like CoreLogic), excludes short sales and REOs, and is not seasonally adjusted.
From Black Knight: Black Knight Home Price Index Report: December Transactions U.S. Home Prices Up 0.1 Percent for the Month; Up 5.5 Percent Year-Over-Year
• U.S. home prices were up 0.1 percent for the month, and have gained 5.5 percent from one year agoThe year-over-year increase in the index has been about the same for the last year.
• At $253K, the national level HPI remains 5.3 percent off its June 2006 peak of $268K, and up 27 percent from the market’s bottom in January 2012
• Among the 20 largest states tracked by Black Knight, New York and Texas both hit new peaks in December
• Of the nation’s 40 largest metros, 8 hit new peaks – Austin, TX; Dallas, TX; Denver, CO; Houston, TX; Nashville, TN; Portland OR, San Antonio, TX and San Francisco, CA
Sunday, February 28, 2016
Sunday Night Futures
by Calculated Risk on 2/28/2016 08:21:00 PM
Last week the FDIC released its “Quarterly Banking Profile” for Q4 2015.
Declines in expenses for litigation at a few large banks combined with moderate revenue growth to lift fourth-quarter net income at FDIC-insured institutions to $40.8 billion, an increase of $4.4 billion (11.9 percent) compared with fourth quarter 2014. The improving trend in earnings was widespread.
...
The number of insured institutions on the FDIC’s “Problem List” declined from 203 to 183 during the quarter, and total assets of problem institutions fell from $51.1 billion to $46.8 billion. For all of 2015, there were 305 mergers of insured institutions, one new charter was added, and eight banks failed.
 Click on graph for larger image.
On the REO front, the report showed that the carrying value of one-to-four family REO properties at FDIC institutions declined to $4.66 billion at the end of December, down from $4.91 billion at then end of September and $5.98 billion at the end of 2014.
REO is down from $14.6 billion in 2010.
Weekend:
• Schedule for Week of February 21, 2016
• February 2016: Unofficial Problem Bank list declines to 228 Institutions
Monday:
• At 9:45 AM ET, Chicago Purchasing Managers Index for February. The consensus is for a reading of 52.9, down from 55.6 in January.
• At 10:00 AM, Pending Home Sales Index for January. The consensus is for a 0.5% increase in the index.
• At 10:30 AM, Dallas Fed Manufacturing Survey for February.
From CNBC: Pre-Market Data and Bloomberg futures: currently S&P futures and DOW futures are mostly unchanged (fair value).
Oil prices were up over the last week with WTI futures at $32.69 per barrel and Brent at $35.00 per barrel. A year ago, WTI was at $50, and Brent was at $61 - so prices are down about 40% year-over-year.
Here is a graph from Gasbuddy.com for nationwide gasoline prices. Nationally prices are at $1.75 per gallon (down about $0.65 per gallon from a year ago).


