 RSS Feed
 by Calculated Risk on 2/17/2016 08:37:00 AM
Wednesday, February 17, 2016
Housing Starts declined to 1.099 Million Annual Rate in January
From the Census Bureau: Permits, Starts and Completions
Housing Starts:
Privately-owned housing starts in January were at a seasonally adjusted annual rate of 1,099,000. This is 3.8 percent below the revised December estimate of 1,143,000, but is 1.8 percent above the January 2015 rate of 1,080,000.
Single-family housing starts in January were at a rate of 731,000; this is 3.9 percent below the revised December figure of 761,000. The January rate for units in buildings with five units or more was 354,000.
Building Permits:
Privately-owned housing units authorized by building permits in January were at a seasonally adjusted annual rate of 1,202,000. This is 0.2 percent below the revised December rate of 1,204,000, but is 13.5 percent above the January 2015 estimate of 1,059,000.
Single-family authorizations in January were at a rate of 720,000; this is 1.6 percent below the revised December figure of 732,000. Authorizations of units in buildings with five units or more were at a rate of 442,000 in January.
emphasis added
 Click on graph for larger image.
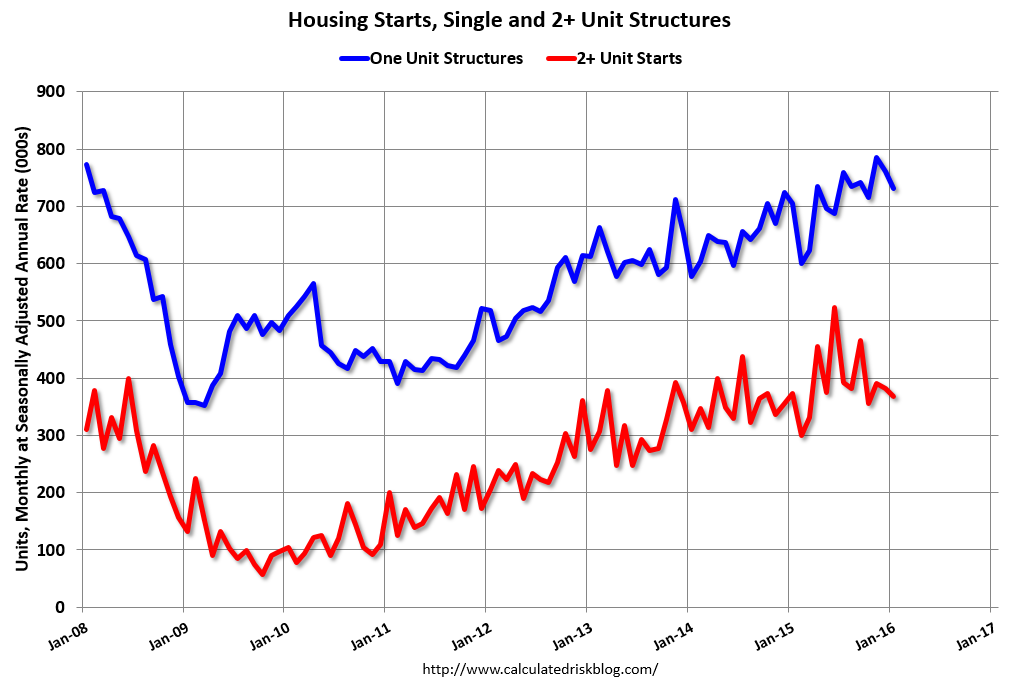
The first graph shows single and multi-family housing starts for the last several years.
Multi-family starts (red, 2+ units) decreased in January. Multi-family starts are down 2% year-over-year.
Single-family starts (blue) decreased in January and are up 3.5% year-over-year.
 The second graph shows total and single unit starts since 1968.
 The second graph shows the huge collapse following the housing bubble, and then - after moving sideways for a couple of years - housing is now recovering (but still historically low),
Total housing starts in January were below expectations. I'll have more later ...
MBA: Mortgage Applications Increased in Latest Weekly Survey, Purchase Applications up 30% YoY
by Calculated Risk on 2/17/2016 07:00:00 AM
From the MBA: Refinance Applications Drive Increase in Latest MBA Weekly Survey
Mortgage applications increased 8.2 percent from one week earlier, according to data from the Mortgage Bankers Association’s (MBA) Weekly Mortgage Applications Survey for the week ending February 12, 2016.
...
The Refinance Index, Conventional Refinance Index and Government Refinance Index increased 16 percent from the previous week, reaching their highest levels since January 2015. The seasonally adjusted Purchase Index decreased 4 percent from one week earlier. The unadjusted Purchase Index increased 2 percent compared with the previous week and was 30 percent higher than the same week one year ago.
...
The average contract interest rate for 30-year fixed-rate mortgages with conforming loan balances ($417,000 or less) decreased to its lowest level since April 2015, 3.83 percent, from 3.91 percent, with points decreasing to 0.36 from 0.41 (including the origination fee) for 80 percent loan-to-value ratio (LTV) loans.
emphasis added
 Click on graph for larger image.
The first graph shows the refinance index since 1990.
Refinance activity was higher in 2015 than in 2014, but it was still the third lowest year since 2000.
Refinance activity has picked up recently as rates have declined.
 The second graph shows the MBA mortgage purchase index.
 According to the MBA, the unadjusted purchase index is 30% higher than a year ago.
Tuesday, February 16, 2016
Wednesday: Housing Starts, PPI, FOMC Minutes and More
by Calculated Risk on 2/16/2016 06:49:00 PM
Wednesday:
• At 7:00 AM ET, the Mortgage Bankers Association (MBA) will release the results for the mortgage purchase applications index.
• At 8:30 AM, Housing Starts for January. The consensus is for 1.175 million starts, up from December.
• At 8:30 AM, the Producer Price Index for January from the BLS. The consensus is for a 0.2% decrease in prices, and a 0.1% increase in core PPI.
• At 9:15 AM, The Fed will release Industrial Production and Capacity Utilization for January. The consensus is for a 0.4% decrease in Industrial Production, and for Capacity Utilization to increase to 76.7%.
• During the day: the AIA's Architecture Billings Index for January (a leading indicator for commercial real estate).
• At 2:00 PM, the Fed will release the FOMC Minutes for the Meeting of January 26-27, 2016
SoCal home sales increased 7.3% YoY in January
by Calculated Risk on 2/16/2016 02:01:00 PM
From the LA Times: Southern California home sales increase in January compared with a year earlier
Southern California home sales in January posted a 7.3% gain compared with the same month a year ago, marking the strongest January for sales since 2013, according to real estate data released Tuesday.The NAR will report January existing home sales on Tuesday, Feb 23rd.
Last month, 14,619 new and existing homes and condominiums were sold in Southern California, according to data firm CoreLogic. ...
"Some people prefer not to buy and sell during the holidays or in the middle of winter, so January and February tend to be relatively weak months for closings and, as such, they're not especially predictive of what's to come for the rest of the year," he said in a statement.
NAHB: Builder Confidence declined to 58 in February
by Calculated Risk on 2/16/2016 10:25:00 AM
The National Association of Home Builders (NAHB) reported the housing market index (HMI) was at 58 in February, down from 61 in January (revised up). Any number above 50 indicates that more builders view sales conditions as good than poor.
From the NAHB: Builder Confidence Drops Three Points in February
Builder confidence in the market for newly-built single-family homes fell three points to 58 in February from an upwardly revised January reading of 61 on the National Association of Home Builders/Wells Fargo Housing Market Index (HMI).
“Though builders report the dip in confidence this month is partly attributable to the high cost and lack of availability of lots and labor, they are still positive about the housing market,” said NAHB Chairman Ed Brady, a home builder and developer from Bloomington, Ill. “Of note, they expressed optimism that sales will pick up in the coming months.”
“Builders are reflecting consumers’ concerns about recent negative economic trends,” said NAHB Chief Economist David Crowe. “However, the fundamentals are in place for continued growth of the housing market. Historically low mortgage rates, steady job gains, improved household formations and significant pent up demand all point to a gradual upward trend for housing in the year ahead.”
...
The HMI component measuring sales expectations in the next six months rose one point to 65 in February. The index measuring current sales condition fell three points to 65 and the component charting buyer traffic dropped five points to 39.
Looking at the three-month moving averages for regional HMI scores, all four regions registered slight declines. The Midwest fell one point to 57, the West registered a three-point drop to 72 and the Northeast and South each posted a two-point decline to 47 and 59, respectively.
emphasis added
 Click on graph for larger image.
This graph show the NAHB index since Jan 1985.
This was below the consensus forecast of 61, but still a strong reading.
NY Fed: "Business activity continued to decline for New York manufacturers" in February
by Calculated Risk on 2/16/2016 08:36:00 AM
From the NY Fed: Empire State Manufacturing Survey
Business activity declined for a seventh consecutive month for New York manufacturing firms, according to the February 2016 survey. After dropping to its lowest level since the Great Recession in January, the general business conditions index edged up three points to -16.6. The new orders index climbed twelve points to -11.6, indicating that orders fell, though at a slower pace than last month.This was below the consensus forecast of -10.0, and indicates manufacturing continued to contract in the NY region.
...
The index for number of employees rose twelve points to -1.0, indicating that employment levels were flat, and the average workweek index held steady at -6.0, signaling that the average workweek shortened.
Monday, February 15, 2016
Tuesday: NY Fed Mfg, NAHB Homebuilder Survey
by Calculated Risk on 2/15/2016 07:33:00 PM
Tuesday:
• At 8:30 AM ET, NY Fed Empire State Manufacturing Survey for February. The consensus is for a reading of -10.0, up from -19.4.
• At 10:00 AM, the February NAHB homebuilder survey. The consensus is for a reading of 61, up from 60 in December. Any number above 50 indicates that more builders view sales conditions as good than poor.
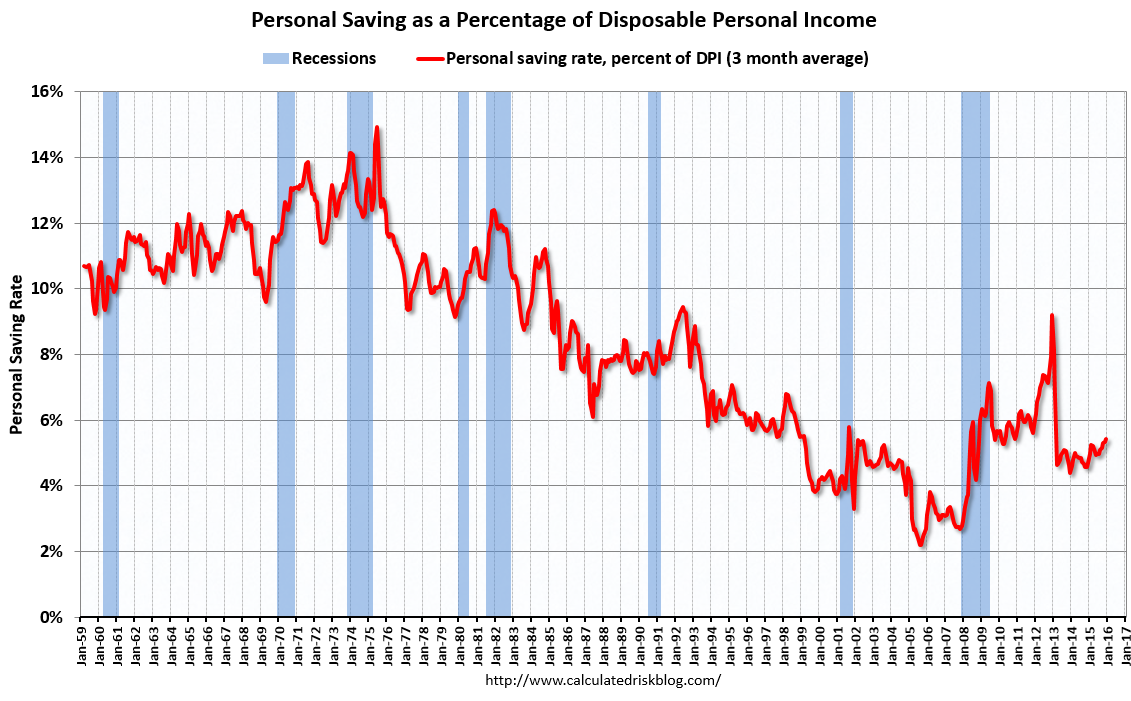
Some people are wondering if consumers are saving the extra money from the decline in oil and gasoline prices - and are waiting to see if the price decline will hold.
 Click on graph for larger image.
This graph shows the three month trailing average of the personal saving rate from the BEA (Personal saving as a percentage of disposable personal income). The rate has been increasing a little recently, but not that much.
Note: this data is heavily revised, so I'm not confident in the trend.
It still isn't clear from the data what is happening to the money saved on gasoline.
Update: Real Estate Agent Boom and Bust
by Calculated Risk on 2/15/2016 01:40:00 PM
Way back in 2005, I posted a graph of the Real Estate Agent Boom. Here is another update to the graph.
The graph shows the number of real estate licensees in California.
The number of agents peaked at the end of 2007 (housing activity peaked in 2005, and prices in 2006).
The number of salesperson's licenses is off 32.8% from the peak, and may be starting to increase again (but up less than 1% year-over-year). The number of salesperson's licenses has fallen to April 2004 levels.
Brokers' licenses are off 11.3% from the peak and have only fallen to April 2006 levels, but are still slowly declining (down 1.5% year-over-year).
 Click on graph for larger image.
So far there been no significant pickup in the number of real estate agents!
FNC: Residential Property Values increased 6.2% year-over-year in December
by Calculated Risk on 2/15/2016 10:35:00 AM
In addition to Case-Shiller, and CoreLogic, I'm also watching the FNC, Zillow and several other house price indexes.
FNC released their December 2015 index data. FNC reported that their Residential Price Index™ (RPI) indicates that U.S. residential property values increased 0.4% from November to December (Composite 100 index, not seasonally adjusted).
The 10 city MSA increased 0.1% (NSA), the 20-MSA RPI increased 0.2%, and the 30-MSA RPI increased 0.4% in December. These indexes are not seasonally adjusted (NSA), and are for non-distressed home sales (excluding foreclosure auction sales, REO sales, and short sales).
Notes: In addition to the composite indexes, FNC presents price indexes for 30 MSAs. FNC also provides seasonally adjusted data.
The index is still down 14.2% from the peak in 2006 (not inflation adjusted).
 Click on graph for larger image.
This graph shows the year-over-year change based on the FNC index (four composites) through December 2015. The FNC indexes are hedonic price indexes using a blend of sold homes and real-time appraisals.
Most of the other indexes are also showing the year-over-year change in the mid single digit range.
Note: The December Case-Shiller index will be released on Tuesday, February 22nd.
Sunday, February 14, 2016
Energy expenditures as a percentage of consumer spending
by Calculated Risk on 2/14/2016 08:40:00 PM
Here is a graph of expenditures on energy goods and services as a percent of total personal consumption expenditures through December 2015.
This is one of the measures that Professor Hamilton at Econbrowser looks at to evaluate any drag on GDP from energy prices.

Click on graph for larger image.
Data source: BEA Table 2.3.5U.
The huge spikes in energy prices during the oil crisis of 1973 and 1979 are obvious. As is the increase in energy prices during the 2001 through 2008 period.
When data for February is released - WTI oil futures are currently at $29 per barrel, down from $37 in December - we will probably see energy expenditures as a percent of PCE at all time lows.


