 RSS Feed
 by Calculated Risk on 5/02/2015 09:55:00 AM
Saturday, May 02, 2015
Schedule for Week of May 3, 2015
The key report this week is the April employment report on Friday.
Other key indicators include the March Trade Deficit on Tuesday, and the April ISM non-manufacturing index also on Tuesday.
Early: the Black Knight March Mortgage Monitor report. This is a monthly report of mortgage delinquencies and other mortgage data.
10:00 AM: Manufacturers' Shipments, Inventories and Orders (Factory Orders) for March. The consensus is a 2.1% increase in orders.
2:00 PM ET: the April 2015 Senior Loan Officer Opinion Survey on Bank Lending Practices from the Federal Reserve.
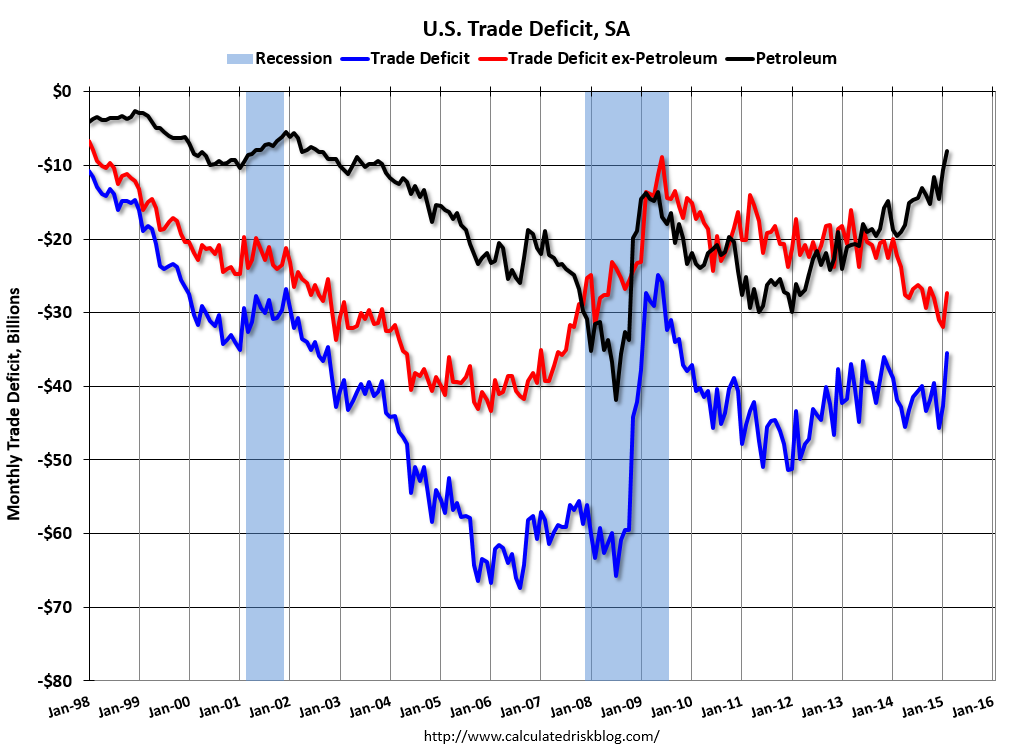 8:30 AM: Trade Balance report for March from the Census Bureau.
 This graph shows the U.S. trade deficit, with and without petroleum, through February. The blue line is the total deficit, and the black line is the petroleum deficit, and the red line is the trade deficit ex-petroleum products.
The consensus is for the U.S. trade deficit to be at $42.0 billion in March from $35.4 billion in February. Note: The trade deficit probably increased sharply in March after the West Coast port slowdown was resolved in February. It seems likely the deficit will be larger than the "consensus" forecast.
10:00 AM: the ISM non-Manufacturing Index for April. The consensus is for index to decrease to 56.2 from 56.5 in March.
7:00 AM: The Mortgage Bankers Association (MBA) will release the results for the mortgage purchase applications index.
8:15 AM: The ADP Employment Report for April. This report is for private payrolls only (no government). The consensus is for 205,000 payroll jobs added in April, up from 189,000 in March.
9:15 AM: Speech by Fed Chair Janet Yellen, Finance and Society, At the Institute for New Economic Thinking Conference on Finance and Society, Washington, D.C.
8:30 AM: The initial weekly unemployment claims report will be released. The consensus is for claims to increase to 285 thousand from 262 thousand.
3:00 PM: Consumer Credit for March from the Federal Reserve. The consensus is for an increase of $16.0 billion in credit.
8:30 AM: Employment Report for April. The consensus is for an increase of 220,000 non-farm payroll jobs added in April, up from the 126,000 non-farm payroll jobs added in March.
The consensus is for the unemployment rate to decline to 5.4%.
 This graph shows the year-over-year change in total non-farm employment since 1968.
In March, the year-over-year change was 3.1 million jobs.
As always, a key will be the change in real wages - and as the unemployment rate falls, wage growth should pickup.
Friday, May 01, 2015
Restaurant Performance Index shows Expansion in March
by Calculated Risk on 5/01/2015 07:02:00 PM
Here is a minor indicator I follow from the National Restaurant Association: Restaurant Performance Index Remained Positive in March
As a result of higher same-store sales and a continued optimistic outlook for future business conditions, the National Restaurant Association’s Restaurant Performance Index (RPI) remained in positive territory in March. The RPI – a monthly composite index that tracks the health of and outlook for the U.S. restaurant industry – stood at 102.2 in March, down 0.4 percent from February’s level of 102.6. Despite the decline, March marked the 25th consecutive month in which the RPI stood above 100, which signifies expansion in the index of key industry indicators.
“Although a majority of restaurant operators reported higher same-store sales in March, customer traffic levels were somewhat dampened,” said Hudson Riehle, senior vice president of the Research and Knowledge Group for the Association. “Looking forward, restaurant operators remain solidly optimistic about future business conditions, with six in 10 expecting to have higher sales in six months.”
emphasis added
 Click on graph for larger image.
The index decreased to 102.2 in March, down from 102.6 in February. (above 100 indicates expansion).
Restaurant spending is discretionary, so even though this is "D-list" data, I like to check it every month. This is another solid reading - and it is likely restaurants are benefiting from lower gasoline prices and are having to raise wages - a little - to attract and retain workers.
U.S. Light Vehicle Sales declined to 16.5 million annual rate in April
by Calculated Risk on 5/01/2015 02:38:00 PM
Based on a WardsAuto estimate, light vehicle sales were at a 16.5 million SAAR in April. That is up 3.3% from April 2014, and down 3.2% from the 17.05 million annual sales rate last month.

Click on graph for larger image.
This graph shows the historical light vehicle sales from the BEA (blue) and an estimate for April (red, light vehicle sales of 16.5 million SAAR from WardsAuto).
This was below the consensus forecast of 16.9 million SAAR (seasonally adjusted annual rate).
The second graph shows light vehicle sales since the BEA started keeping data in 1967.
 Note: dashed line is current estimated sales rate.
Although below the consensus forecast, this was still a solid month for vehicle sales.
Construction Spending decreased 0.6% in March
by Calculated Risk on 5/01/2015 12:12:00 PM
Earlier today, the Census Bureau reported that overall construction spending decreased in March:
The U.S. Census Bureau of the Department of Commerce announced today that construction spending during March 2015 was estimated at a seasonally adjusted annual rate of $966.6 billion, 0.6 percent below the revised February estimate of $972.9 billion. The March figure is 2.0 percent above the March 2014 estimate of $947.3 billion.Both Private and public spending decreased:
Spending on private construction was at a seasonally adjusted annual rate of $702.4 billion, 0.3 percent below the revised February estimate of $704.7 billion. ...Note: Non-residential for offices and hotels is generally increasing, but spending for oil and gas is declining. Early in the recovery, there was a surge in non-residential spending for oil and gas (because oil prices increased), but now, with falling prices, oil and gas is a drag on overall construction spending.
In March, the estimated seasonally adjusted annual rate of public construction spending was $264.2 billion, 1.5 percent below the revised February estimate of $268.2 billion.
emphasis added
As an example, construction spending for lodging is up 22% year-over-year, whereas spending for power (includes oil and gas) construction peaked in mid-2014 and is down 16% year-over-year.
 Click on graph for larger image.
This graph shows private residential and nonresidential construction spending, and public spending, since 1993. Note: nominal dollars, not inflation adjusted.
Private residential spending has been moving sideways, and is 48% below the bubble peak.
Non-residential spending is 15% below the peak in January 2008.
Public construction spending is now 19% below the peak in March 2009 and about 1% above the post-recession low.
 The second graph shows the year-over-year change in construction spending.
On a year-over-year basis, private residential construction spending is down 2.5%. Non-residential spending is up 9% year-over-year. Public spending is unchanged year-over-year.
Looking forward, all categories of construction spending should increase in 2015. Residential spending is still very low, non-residential is starting to pickup (except oil and gas), and public spending has probably hit bottom after several years of austerity.
This was below the consensus forecast of a 0.5% increase, however spending for January and February was revised up.
ISM Manufacturing index unchanged at 51.5 in April
by Calculated Risk on 5/01/2015 10:01:00 AM
The ISM manufacturing index suggested sluggish expansion in April. The PMI was at 51.5% in April, unchanged from 51.5% in March. The employment index was at 48.3%, down from 50.0% in March, and the new orders index was at 53.5%, up from 51.8%.
From the Institute for Supply Management: April 2015 Manufacturing ISM® Report On Business®
Economic activity in the manufacturing sector expanded in April for the 28th consecutive month, and the overall economy grew for the 71st consecutive month, say the nation’s supply executives in the latest Manufacturing ISM® Report On Business®.
The report was issued today by Bradley J. Holcomb, CPSM, CPSD, chair of the Institute for Supply Management® (ISM®) Manufacturing Business Survey Committee. "The April PMI® registered 51.5 percent, the same reading as in March. The New Orders Index registered 53.5 percent, an increase of 1.7 percentage points from the reading of 51.8 percent in March. The Production Index registered 56 percent, 2.2 percentage points above the March reading of 53.8 percent. The Employment Index registered 48.3 percent, 1.7 percentage points below the March reading of 50 percent, reflecting contracting employment levels from March. Inventories of raw materials registered 49.5 percent, a decrease of 2 percentage points from the March reading of 51.5 percent. The Prices Index registered 40.5 percent, 1.5 percentage points above the March reading of 39 percent, indicating lower raw materials prices for the sixth consecutive month. While the March and April PMI® were equal, both registering 51.5 percent, 15 of the 18 manufacturing industries reported growth in April while only 10 industries reported growth in March, indicating a broader distribution of growth in April among the 18 industries."
emphasis added
 Click on graph for larger image.
Here is a long term graph of the ISM manufacturing index.
This was below expectations of 52.0%, but still indicates expansion in April.
Zillow Forecast: Expect Case-Shiller National House Price Index up 4.2% year-over-year change in March
by Calculated Risk on 5/01/2015 07:11:00 AM
The Case-Shiller house price indexes for February were released this week. Zillow forecasts Case-Shiller a month early - now including the National Index - and I like to check the Zillow forecasts since they have been pretty close.
From Zillow: March Case-Shiller Forecast: 20-City Index to Show Annual Growth Above 5% Once Again
The February S&P/Case-Shiller (SPCS) data published today showed a slight uptick in home value appreciation for the 10- and 20-City indices, compared to the prior month. However, appreciation in the national index fell slightly in February, to an annual pace of 4.2 percent, from 4.4 percent in January 2015. Annual appreciation in the national series hit a post-bubble peak of 10.9 percent in October 2013 and has declined in every month since December 2013.So the year-over-year change in for March Case-Shiller National index will be about the same as in the February report.
The 10- and 20-City Composite Indices both experienced modest bumps in annual growth rates in February; the 10-City index rose 4.8 percent and the 20-City Index rose to 5 percent, up from rates of 4.3 percent and 4.5 percent, respectively, in January. The non-seasonally adjusted (NSA) 10- and 20-City indices were each up 0.5 percent in February from January, and we expect both to show further gains in March.
All forecasts are shown in the table below. These forecasts are based on the February SPCS data release and the March 2015 Zillow Home Value Index (ZHVI), published April 22. Officially, the SPCS Composite Home Price Indices for March will not be released until Tuesday, May 26.
| Zillow Case-Shiller Forecast | ||||||
|---|---|---|---|---|---|---|
| Case-Shiller Composite 10 | Case-Shiller Composite 20 | Case-Shiller National | ||||
| NSA | SA | NSA | SA | NSA | SA | |
| February Actual YoY | 4.8% | 4.8% | 5.0% | 5.0% | 4.2% | 4.2% |
| March Forecast YoY | 4.9% | 4.9% | 5.2% | 5.2% | 4.2% | 4.2% |
| March Forecast MoM | 0.9% | 1.0% | 1.0% | 0.9% | 0.5% | 0.2% |
From Zillow:
Annual appreciation in the Zillow Home Value Index (ZHVI) peaked in April 2014 and has declined since then. In March, the U.S. ZHVI rose 3.9 percent year-over-year, the first month in two years that home values grew at less than 4 percent annually. The annual appreciation rate in home values has fallen for the past 11 months. The February Zillow Home Value Forecast calls for a 2.6 percent rise in home values through February 2016. Further details on our forecast of home values can be found here.
Thursday, April 30, 2015
Friday: ISM Manufacturing, Auto Sales, Construction Spending
by Calculated Risk on 4/30/2015 09:00:00 PM
Fannie Mae reported today that the Single-Family Serious Delinquency rate declined in March to 1.78% from 1.83% in February. The serious delinquency rate is down from 2.19% in March 2014, and this is the lowest level since September 2008.
The Fannie Mae serious delinquency rate peaked in February 2010 at 5.59%.
Earlier Freddie Mac reported that the Single-Family serious delinquency rate was declined in March to 1.73%. Freddie's rate is down from 2.20% in March 2014, and is at the lowest level since December 2008. Freddie's serious delinquency rate peaked in February 2010 at 4.20%.
Note: These are mortgage loans that are "three monthly payments or more past due or in foreclosure".
 Click on graph for larger image
The Fannie Mae serious delinquency rate has fallen 0.41 percentage points over the last year - the pace of improvement has slowed - and at that pace the serious delinquency rate will be close to 1% in late 2016.
The "normal" serious delinquency rate is under 1%, so maybe serious delinquencies will be close to normal at the end of 2016. This elevated delinquency rate is mostly related to older loans - the lenders are still working through the backlog, especially in judicial foreclosure states like Florida.
Friday:
• At 10:00 AM ET, ISM Manufacturing Index for April. The consensus is for an increase to 52.0 from 51.5 in March. The ISM manufacturing index indicated expansion at 51.5% in March. The employment index was at 50.0%, and the new orders index was at 51.8%.
• Also at 10:00 AM, Construction Spending for March. The consensus is for a 0.5% increase in construction spending.
• Also at 10:00 AM, University of Michigan's Consumer sentiment index (final for April). The consensus is for a reading of 96.0, up from the preliminary reading of 95.9, and up from the March reading of 93.0.
• All day: Light vehicle sales for April. The consensus is for light vehicle sales to decrease to 16.9 million SAAR in April from 17.05 million in March (Seasonally Adjusted Annual Rate).
Q1 2015 GDP Details on Residential and Commercial Real Estate
by Calculated Risk on 4/30/2015 05:25:00 PM
The BEA released the underlying details for the Q1 advance GDP report today.
Yesterday, the BEA reported that investment in non-residential structures decreased at a 23.1% annual rate in Q1.
All of the decline could be attributed to less petroleum exploration and less investment in electrical. Both declined at a 50% annual rate in Q1.
There was some weakness in lodging investment, but that might be weather related. Excluding petroleum and electrical, non-residential investment in structures was unchanged in Q1.
 Click on graph for larger image.
The first graph shows investment in offices, malls and lodging as a percent of GDP. Office, mall and lodging investment has increased a little recently, but from a very low level.
Investment in offices increased slightly in Q1, is down about 43% from the recent peak (as a percent of GDP) and increasing from a very low level - and is still below the lows for previous recessions (as percent of GDP). With the high office vacancy rate, office investment will only increase slowly.
Investment in multimerchandise shopping structures (malls) peaked in 2007 and is down about 59% from the peak. The vacancy rate for malls is still very high, so investment will probably stay low for some time.
Lodging investment declined in Q1, but with the hotel occupancy rate near record levels, it is likely that hotel investment will increase in the near future. Lodging investment peaked at 0.31% of GDP in Q3 2008 and is down about 65%.
 The second graph is for Residential investment components as a percent of GDP. According to the Bureau of Economic Analysis, RI includes new single family structures, multifamily structures, home improvement, Brokers’ commissions and other ownership transfer costs, and a few minor categories (dormitories, manufactured homes).
Investment in single family structures is now back to being the top category for residential investment. Home improvement was the top category for twenty consecutive quarters following the housing bust ... but now investment in single family structures has been back on top for the last 6 quarters and will probably stay there for a long time.
However - even though investment in single family structures has increased from the bottom - single family investment is still very low, and still below the bottom for previous recessions as a percent of GDP. I expect further increases over the next few years.
Investment in single family structures was $204 billion (SAAR) (over 1.1% of GDP).
Investment in home improvement was at a $182 billion Seasonally Adjusted Annual Rate (SAAR) in Q1 (just over 1.0% of GDP).
These graphs show investment is generally increasing, but from a very low level.
Lawler: More Builder Results (updated table)
by Calculated Risk on 4/30/2015 03:13:00 PM
Housing economist Tom Lawler sent me this updated table of builder results for Q1.
For these seven builders, net orders were up 19.9% year-over-year. Although cancellations are handled differently, this is about the same year-over-year increase for Q1 as for New Home sales as reported by the Census Bureau.
The average closing price is only up slightly this year following a sharp increase in 2014.
From Tom Lawler:
Net orders per active community for the seven builders combined were up 13.5% YOY, while their combined order backlog at the end of March was up 13.8% YOY.
| Net Orders | Settlements | Average Closing Price | |||||||
|---|---|---|---|---|---|---|---|---|---|
| Qtr. Ended: | 3/15 | 3/14 | % Chg | 3/15 | 3/14 | % Chg | 3/15 | 3/14 | % Chg |
| D.R. Horton | 11,135 | 8,569 | 29.9% | 8,243 | 6,194 | 33.1% | $281,305 | 271,230 | 3.7% |
| PulteGroup | 5,139 | 4,863 | 5.7% | 3,365 | 3,436 | -2.1% | $323,000 | 317,000 | 1.9% |
| NVR | 3,926 | 3,325 | 18.1% | 2,534 | 2,211 | 14.6% | $371,000 | 361,400 | 2.7% |
| The Ryland Group | 2,389 | 2,186 | 9.3% | 1,463 | 1,470 | -0.5% | $343,000 | 327,000 | 4.9% |
| Beazer Homes | 1,698 | 1,390 | 22.2% | 936 | 977 | -4.2% | $305,800 | 272,400 | 12.3% |
| Meritage Homes | 1,979 | 1,525 | 29.8% | 1,335 | 1,109 | 20.4% | $387,000 | 366,000 | 5.7% |
| M/I Homes | 1,108 | 982 | 12.8% | 717 | 732 | -2.0% | $325,000 | 299,000 | 8.7% |
| Total | 27,374 | 22,840 | 19.9% | 18,593 | 16,129 | 15.3% | $316,437 | $306,271 | 3.3% |
Earlier from the BEA: Personal Income increased slightly in March, Core PCE prices up 1.3% year-over-year
by Calculated Risk on 4/30/2015 11:40:00 AM
Earlier the BEA released the Personal Income and Outlays report for March:
Personal income increased $6.2 billion, or less than 0.1 percent ... in March, according to the Bureau of Economic Analysis. Personal consumption expenditures (PCE) increased $53.4 billion, or 0.4 percent.The following graph shows real Personal Consumption Expenditures (PCE) through March 2015 (2009 dollars). Note that the y-axis doesn't start at zero to better show the change.
...
Real PCE -- PCE adjusted to remove price changes -- increased 0.3 percent in March, in contrast to a decrease of less than 0.1 percent in February. ... The price index for PCE increased 0.2 percent in March, the same increase as in February. The PCE price index, excluding food and energy, increased 0.1 percent in March, the same increase as in February.
The March price index for PCE increased 0.3 percent from March a year ago. The March PCE price index, excluding food and energy, increased 1.3 percent from March a year ago.
 Click on graph for larger image.
The dashed red lines are the quarterly levels for real PCE.
On inflation: the PCE price index as up 0.3% year-over-year (the decline in oil prices pushed down the headline price index). However core PCE is only up 1.3% year-over-year - still way below the Fed's target.


