 RSS Feed
 by Calculated Risk on 12/17/2014 11:25:00 AM
Wednesday, December 17, 2014
Key Measures Show Low Inflation in November
The Cleveland Fed released the median CPI and the trimmed-mean CPI this morning:
According to the Federal Reserve Bank of Cleveland, the median Consumer Price Index rose 0.1% (1.8% annualized rate) in November. The 16% trimmed-mean Consumer Price Index rose 0.1% (1.0% annualized rate) during the month. The median CPI and 16% trimmed-mean CPI are measures of core inflation calculated by the Federal Reserve Bank of Cleveland based on data released in the Bureau of Labor Statistics' (BLS) monthly CPI report.Note: The Cleveland Fed has the median CPI details for November here. Motor fuel declined at a 55% annualized rate in November following a 31% annualized rate decline in October! There will be another sharp decline in December too.
Earlier today, the BLS reported that the seasonally adjusted CPI for all urban consumers fell 0.3% (-3.0% annualized rate) in November. The CPI less food and energy rose 0.1% (0.9% annualized rate) on a seasonally adjusted basis.
 Click on graph for larger image.
This graph shows the year-over-year change for these four key measures of inflation. On a year-over-year basis, the median CPI rose 2.3%, the trimmed-mean CPI rose 1.8%, and the CPI less food and energy rose 1.7%. Core PCE is for October and increased 1.6% year-over-year.
On a monthly basis, median CPI was at 1.8% annualized, trimmed-mean CPI was at 1.0% annualized, and core CPI increased 0.9% annualized.
On a year-over-year basis these measures suggest inflation remains at or below the Fed's target of 2%.
AIA: Architecture Billings Index shows slower expansion in November
by Calculated Risk on 12/17/2014 09:34:00 AM
Note: This index is a leading indicator primarily for new Commercial Real Estate (CRE) investment.
From AIA: Demand Softens, but Outlook for Architecture Billings Index Remains Positive
Buoyed by sustained demand for apartments and condominiums, coupled with state and local governments moving ahead with delayed public projects, the Architecture Billings Index (ABI) has been positive for seven consecutive months. As a leading economic indicator of construction activity, the ABI reflects the approximate nine to twelve month lead time between architecture billings and construction spending. The American Institute of Architects (AIA) reported the November ABI score was 50.9, down from a mark of 53.7 in October. This score reflects a slight increase in design activity (any score above 50 indicates an increase in billings). The new projects inquiry index was 58.8, following a mark of 62.7 the previous month.
The AIA has added a new indicator measuring the trends in new design contracts at architecture firms that can provide a strong signal of the direction of future architecture billings. The score for design contracts in November was 54.9.
“Demand for design services has slowed somewhat from the torrid pace of the summer, but all project sectors are seeing at least modest growth,” said AIA Chief Economist Kermit Baker, Hon. AIA, PhD. “Architecture firms are expecting solid mid-single digit gains in revenue for 2014, but heading into 2015, they are concerned with finding quality contractors for projects, coping with volatile construction materials costs and with finding qualified architecture staff for their firms.”
• Regional averages: South (57.9), West (52.7), Midwest (49.8), Northeast (46.7) [three month average]
emphasis added
 Click on graph for larger image.
This graph shows the Architecture Billings Index since 1996. The index was at 50.9 in November, down from 53.7 in October. Anything above 50 indicates expansion in demand for architects' services.
Note: This includes commercial and industrial facilities like hotels and office buildings, multi-family residential, as well as schools, hospitals and other institutions.
According to the AIA, there is an "approximate nine to twelve month lag time between architecture billings and construction spending" on non-residential construction. So the positive readings over the last seven months suggest an increase in CRE investment in 2015.
BLS: CPI decreased 0.3% in November, Core CPI increased 0.1%
by Calculated Risk on 12/17/2014 08:33:00 AM
The Consumer Price Index for All Urban Consumers (CPI-U) declined 0.3 percent in November on a seasonally adjusted basis, the U.S. Bureau of Labor Statistics reported today. Over the last 12 months, the all items index increased 1.3 percent before seasonal adjustment.I'll post a graph later today after the Cleveland Fed releases the median and trimmed-mean CPI. This was below the consensus forecast of a 0.1% decrease for CPI, and at the forecast of a 0.1% increase in core CPI.
...
The gasoline index posted its sharpest decline since December 2008 and was the main cause of the decrease in the seasonally adjusted all items index. The indexes for fuel oil and natural gas also declined, and the energy index fell 3.8 percent. ...
The index for all items less food and energy increased 0.1 percent in November. ...
The all items index increased 1.3 percent over the last 12 months, a notable decline from the 1.7 percent figure from the 12 months ending October. The index for all items less food and energy has increased 1.7 percent over the last 12 months, compared to 1.8 percent for the 12 months ending October.
emphasis added
Energy prices have also declined significantly in December, and CPI will fall further - but the key is to focus on the core measures.
MBA: Mortgage Applications Decrease in Latest MBA Weekly Survey
by Calculated Risk on 12/17/2014 07:01:00 AM
From the MBA: Mortgage Applications Decrease in Latest MBA Weekly Survey
Mortgage applications decreased 3.3 percent from one week earlier, according to data from the Mortgage Bankers Association’s (MBA) Weekly Mortgage Applications Survey for the week ending December 12, 2014. ...
The Refinance Index remained unchanged from the previous week. The seasonally adjusted Purchase Index decreased 7 percent from one week earlier.
...
The average contract interest rate for 30-year fixed-rate mortgages with conforming loan balances ($417,000 or less) decreased to 4.06 percent, the lowest level since May 2013, from 4.11 percent, with points decreasing to 0.21 from 0.28 (including the origination fee) for 80 percent loan-to-value ratio (LTV) loans.
emphasis added
 Click on graph for larger image.
The first graph shows the refinance index.
The refinance index is down 72% from the levels in May 2013.
Even with the general decline in mortgage rates, refinance activity is very low this year and 2014 will be the lowest since year 2000. As I've noted before - rates would have to decline significantly for there to be a large refinance boom.
 The second graph shows the MBA mortgage purchase index.
 According to the MBA, the unadjusted purchase index is down about 5% from a year ago.
Tuesday, December 16, 2014
Wednesday: FOMC, CPI
by Calculated Risk on 12/16/2014 08:04:00 PM
Oil prices and the Russian financial crisis are the big stories ... from the WSJ: Russia’s Economic Pain Is Just Beginning, Bank Group Warns
Russia’s economy is likely already in recession with the ruble tumbling to new lows. But the country’s pain is just starting, says one of the world’s largest banking groups.Wednesday:
“There is complete panic in the financial markets” in Russia, said Lubomir Mitov, chief Europe economist at the Institute of International Finance, a banking industry group in Washington that represents more than 500 of the world’s largest private financial firms.
...
Russia’s economy is verging on collapse for two major reasons: oil and sanctions
• At 7:00 AM ET, the Mortgage Bankers Association (MBA) will release the results for the mortgage purchase applications index.
• At 8:30 AM, Consumer Price Index for November. The consensus is for a 0.1% decrease in CPI in October, and for core CPI to increase 0.1%.
• At During the day, The AIA's Architecture Billings Index for November (a leading indicator for commercial real estate).
• At 2:00 PM, FOMC Meeting Statement. The FOMC is expected to make no change to policy, however the phrase "considerable period" will probably be changed in the statement.
• At 2:00 PM, FOMC Forecasts. This will include the Federal Open Market Committee (FOMC) participants' projections of the appropriate target federal funds rate along with the quarterly economic projections.
• At 2:30 PM, Fed Chair Janet Yellen holds a press briefing following the FOMC announcement.
"Mortgage Rates Back to Pre-Taper-Tantrum Levels"
by Calculated Risk on 12/16/2014 04:44:00 PM
From Matthew Graham at Mortgage News Daily: Mortgage Rates Back to Pre-Taper-Tantrum Levels
Mortgage rates fell decisively today, bringing some lenders back in line with rate sheets seen on May 22nd, 2013. That's significant because it was arguably the first day of the 'Taper Tantrum,' when markets began pricing in the effects of a reduction in Fed asset purchases. On a more quantitative note, it was significant because it was one of the most abruptly negative days in modern mortgage rate history--one of several that would be seen in the ensuing months.Here is a table from Mortgage News Daily:
Simply put, for more than a full year, borrowers and mortgage professionals would have been thrilled with the chance to go back in time to lock May 22nd, 2013 rates. In more than a few cases, now they can.
The most prevalently-quoted conforming 30yr fixed rate for top tier borrowers is now in transit between 3.875% and 3.75%.
DataQuick: "Bay Area Home Sales Slowest in Six Years" in November
by Calculated Risk on 12/16/2014 02:24:00 PM
From DataQuick: Bay Area Home Sales Slowest in Six Years; Single-Digit Price Increase
Home sales dropped to the lowest level for the month of November since 2008, the result of a limited number of homes for sale, cautious buyers, a challenging mortgage market and a quirk of the calendar that resulted in a relatively low number days for recording deals. ... A total of 6,003 new and resale houses and condos sold in the nine-county Bay Area in November 2014. That was down 22.0 percent from 7,693 in October of this year and down 9.9 percent from 6,659 in November 2013, according to CoreLogic DataQuick data.Note: I live in California, and in my area it seems like a large number of homes went "pending" during the last few weeks. If that is happening elsewhere, then we will see an increase in sales in December and January (seasonally adjusted). But November was soft.
A decline in sales from October to November is normal for the season. It’s likely that this November’s sales decline from October was especially sharp because of a calendar issue: There were only 17 days on which home sales could be recorded at county recorders’ offices this November, compared with 22 or 23 days in October, depending on the county. Over the last decade, there has been an average of about 19 days for such recordings in the month of November.
...
“Each calendar month has its own set of characteristics, its own personality. November is always kind of an interlude month, and the statistics aren’t really very good for predicting upcoming activity. That said, we did see a continuation of long-term trends: Low supply levels, a dysfunctional mortgage market and dormant market categories. This could change fast, and the big question then will be just how much pent-up demand is out there. No one knows,” said John Karevoll, CoreLogic DataQuick analyst.
...
Foreclosure resales accounted for 2.8 percent of all resales in November, unchanged from a revised 2.8 percent in October, and down from 3.7 percent in November 2013. Foreclosure resales in the Bay Area peaked at 52.0 percent in February 2009, while the monthly average over the past 17 years is 9.7 percent. Foreclosure resales are purchased homes that had been previously foreclosed upon in the prior 12 months.
Short sales made up an estimated 4.3 percent of Bay Area resales in November, up from an estimated 3.4 percent in October and down from 7.2 percent in November 2013. Short sales are transactions in which the sale price fell short of what was owed on the property.
emphasis added
DataQuick: "Southern California November Home Sales Fall Sharply"
by Calculated Risk on 12/16/2014 12:45:00 PM
From DataQuick: Southern California November Home Sales Fall Sharply; Median Sale Price Holds Steady Again
Home sales dropped to the lowest level for the month of November in seven years, the result of a relatively low number of days for recording deals, as well as fewer investor purchases and other market factors. ... A total of 15,643 new and resale houses and condos sold in Los Angeles, Riverside, San Diego, Ventura, San Bernardino and Orange counties in November 2014. That was down 18.8 percent from 19,271 sales in October, and down 9.5 percent from 17,283 sales in November 2013, according to CoreLogic DataQuick data.The NAR is scheduled to release existing home sales for November on Monday, December 22nd. Housing economist Tom Lawler is forecasting the NAR will report November sales of 4.93 million SAAR.
On average, Southern California sales have fallen 8.4 percent between October and November since 1988, when CoreLogic DataQuick data began. It’s likely that this November’s sales decline from October was especially sharp because of a calendar issue: There were only 17 days on which home sales could be recorded at county recorders' offices this November, compared with 22 or 23 days in October, depending on the county. Over the last decade, there has been an average of about 19 days for such recordings in the month of November. ...
"Southern California home sales are closing on a low note in 2014,” said Andrew LePage, data analyst for CoreLogic DataQuick. “Inventory still lags demand in many markets and traditional buyers haven’t filled the void left by the investors who’ve pulled out. Among would-be buyers, affordability and mortgage availability remain as hurdles, as do concerns about job security and the direction of the housing market. But there are reasons to expect more housing demand ahead. According to recent data from the federal government, job and income growth has improved. Many people who became renters after a foreclosure or short sale over the past seven years will want to buy again. And potential home buyers sitting on the fence might be tempted to jump off if they see evidence that mortgage rates will spike from today’s exceptionally low levels.”
...
Foreclosure resales represented 5.3 percent of the Southern California resale market in November. That was up from a revised 4.9 percent in October and down from 6.3 percent a year earlier. In recent months the foreclosure resale rate has been the lowest since early 2007. In the current cycle, foreclosure resales hit a high of 56.7 percent in February 2009. Foreclosure resales are purchased homes that had been previously foreclosed upon in the prior 12 months.
Short sales made up an estimated 6.2 percent of resales in November, up from a revised 6.0 percent in October and down from 10.5 percent in November 2013. Short sales are transactions in which the sale price fell short of what was owed on the property.
emphasis added
Comments on November Housing Starts
by Calculated Risk on 12/16/2014 10:40:00 AM
A year ago, for November 2013, housing starts were reported at 1.091 million on a SAAR basis (seasonally adjusted annual rate), up 29.6% from November 2012. Starts in November 2013 have since been revised up to 1.105 million. That huge increase in starts was probably one reason that many analysts, myself included, were overly optimistic for housing starts in 2014.
This year total starts in November were reported at 1.028 million SAAR, down 7.0% from a year ago. That sounds weak, but actually starts in the 2nd half of 2014 have averaged 1.032 million, up 10.1% from the 937 thousand during the same period last year - including that strong November in 2013!
In early 2014, housing starts were very weak - down year-over-year in Q1 - but starts have picked up in the 2nd half.
A few numbers: There were 927 thousand total housing starts during the first eleven months of 2014 (not seasonally adjusted, NSA), up 8.2% from the 857 thousand during the same period of 2013. Single family starts are up 4.4%, and multifamily starts up 16.6%. The key weakness has been in single family starts.
The following table shows the annual housing starts since 2005, and the percent change from the previous year (estimates for 2014). The housing recovery has slowed in 2014, especially for single family starts. However I expect further growth in starts over the next several years.
| Housing Starts (000s) and Annual Change | ||||
|---|---|---|---|---|
| Total | Total % Change | Single | Single % Change | |
| 2005 | 2,068.3 | 5.8% | 1,715.8 | 6.5% |
| 2006 | 1,800.9 | -12.9% | 1,465.4 | -14.6% |
| 2007 | 1,355.0 | -24.8% | 1,046.0 | -28.6% |
| 2008 | 905.5 | -33.2% | 622.0 | -40.5% |
| 2009 | 554.0 | -38.8% | 445.1 | -28.4% |
| 2010 | 586.9 | 5.9% | 471.2 | 5.9% |
| 2011 | 608.8 | 3.7% | 430.6 | -8.6% |
| 2012 | 780.6 | 28.2% | 535.3 | 24.3% |
| 2013 | 924.9 | 18.5% | 617.6 | 15.4% |
| 20141 | 997.0 | 7.8% | 644.0 | 4.3% |
| 1Estimate for 2014 | ||||
This graph shows the month to month comparison between 2013 (blue) and 2014 (red). Starts in 2014 were above the same month in 2013 for seven consecutive months prior to November.
 Click on graph for larger image.
December will be another difficult year-over-year comparison, but I expect to see solid year-over-year growth in Q1 2015.
Below is an update to the graph comparing multi-family starts and completions. Since it usually takes over a year on average to complete a multi-family project, there is a lag between multi-family starts and completions. Completions are important because that is new supply added to the market, and starts are important because that is future new supply (units under construction is also important for employment).
These graphs use a 12 month rolling total for NSA starts and completions.
 The blue line is for multifamily starts and the red line is for multifamily completions.
 The rolling 12 month total for starts (blue line) increased steadily over the last few years, and completions (red line) have lagged behind - but completions have been catching up (more deliveries), and will continue to follow starts up (completions lag starts by about 12 months).
Most of the growth in multi-family starts is probably behind us - although I expect solid multi-family starts for a few more years (based on demographics).
 The second graph shows single family starts and completions. It usually only takes about 6 months between starting a single family home and completion - so the lines are much closer. The blue line is for single family starts and the red line is for single family completions.
Note the exceptionally low level of single family starts and completions. The "wide bottom" was what I was forecasting several years ago, and now I expect several years of increasing single family starts and completions.
Housing Starts decrease to 1.028 Million Annual Rate in November
by Calculated Risk on 12/16/2014 08:30:00 AM
From the Census Bureau: Permits, Starts and Completions
Housing Starts:
Privately-owned housing starts in November were at a seasonally adjusted annual rate of 1,028,000. This is 1.6 percent below the revised October estimate of 1,045,000 and is 7.0 percent below the November 2013 rate of 1,105,000.
Single-family housing starts in November were at a rate of 677,000; this is 5.4 percent below the revised October figure of 716,000. The November rate for units in buildings with five units or more was 340,000.
emphasis added
Building Permits:
Privately-owned housing units authorized by building permits in November were at a seasonally adjusted annual rate of 1,035,000. This is 5.2 percent below the revised October rate of 1,092,000 and is 0.2 percent below the November 2013 estimate of 1,037,000.
Single-family authorizations in November were at a rate of 639,000; this is 1.2 percent below the revised October figure of 647,000. Authorizations of units in buildings with five units or more were at a rate of 367,000 in November.
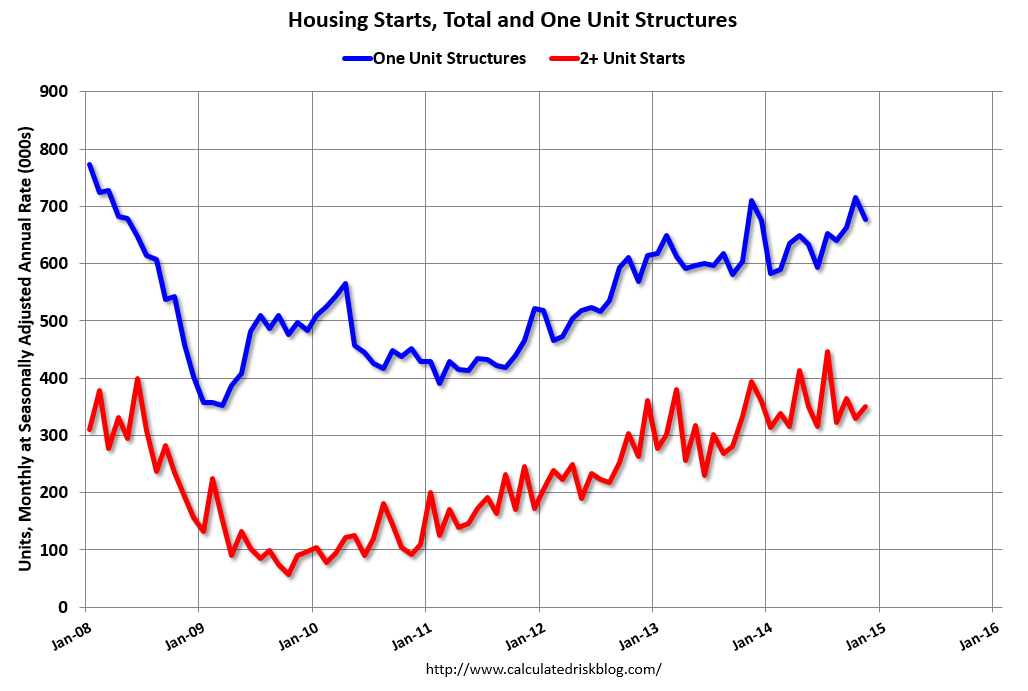 Click on graph for larger image.
The first graph shows single and multi-family housing starts for the last several years.
Multi-family starts (red, 2+ units) increased in November (Multi-family is volatile month-to-month). Multi-family starts are down 11% year-over-year because there was a large increase in starts last November.
Single-family starts (blue) decreased in November.
The second graph shows total and single unit starts since 1968.
 The second graph shows the huge collapse following the housing bubble, and that housing starts have been increasing after moving sideways for about two years and a half years.
 This was below expectations of 1.038 million starts in November, however October was revised up by 36 thousand (annual rate), so overall this was a decent report. The comparison to last year was difficult because of the large increase in starts in November 2013 (that probably was one of the reasons many analysts were too optimistic for 2014). I'll have more later ...


