 RSS Feed
 by Calculated Risk on 11/14/2014 09:55:00 AM
Friday, November 14, 2014
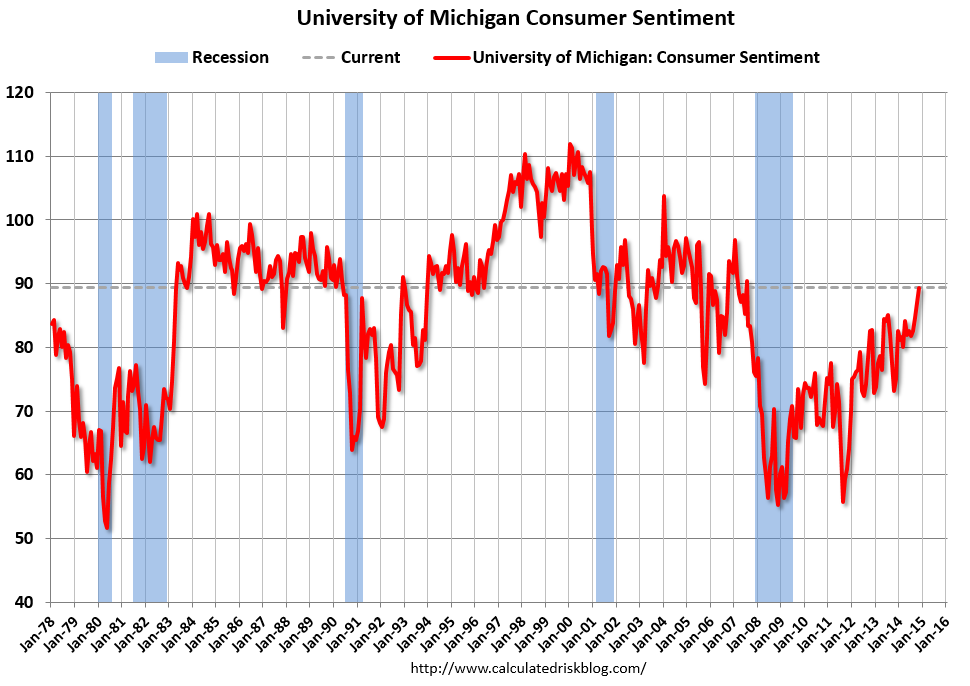
Preliminary November Consumer Sentiment increases to 89.4
Click on graph for larger image.
The preliminary Reuters / University of Michigan consumer sentiment index for November was at 89.4, up from 86.9 in October.
This was above the consensus forecast of 87.5 and is at the highest level since 2007.
Retail Sales increased 0.3% in October
by Calculated Risk on 11/14/2014 08:43:00 AM
On a monthly basis, retail sales decreased 0.3% from September to October (seasonally adjusted), and sales were up 4.1% from October 2013. Sales in September were unrevised at a 0.3% decrease.
From the Census Bureau report:
The U.S. Census Bureau announced today that advance estimates of U.S. retail and food services sales for October, adjusted for seasonal variation and holiday and trading-day differences, but not for price changes, were $444.5 billion, an increase of 0.3 percent from the previous month, and 4.1 percent above October 2013. ... The August to September 2014 percent change was unrevised from -0.3%.
 Click on graph for larger image.
This graph shows retail sales since 1992. This is monthly retail sales and food service, seasonally adjusted (total and ex-gasoline).
Retail sales ex-gasoline increase 0.5%.
Retail sales ex-autos increased 0.3%.
The second graph shows the year-over-year change in retail sales and food service (ex-gasoline) since 1993.
 Retail sales ex-gasoline increased by 5.1% on a YoY basis (4.1% for all retail sales).
The increase in October was above consensus expectations of a 0.2% increase.
Overall this was a solid report.
Thursday, November 13, 2014
Friday: Retail Sales, Consumer Sentiment, Q3 National Mortgage Delinquency Survey
by Calculated Risk on 11/13/2014 07:01:00 PM
One of the keys in the retail sales report will be sales ex-gasoline. From the WSJ: On Your Shopping List: Three Things to Watch in the Retail Sales Report
[C]onsider retail performance excluding gasoline stations. Retail sales are reported nominally and gas prices have plummeted since June. That means a clearer picture of the consumer sector will come from looking at retail sales excluding gas stations.Friday:
There are two reasons for that. The first is obvious: If gas sales are falling, sales excluding gas are doing better than total sales.
The second reason is that cheaper gas frees up money that can be spent elsewhere. If nongas sales don’t post a solid gain in October, consumers may be saving that extra money.
• At 8:30 AM ET, Retail sales for October will be released. The consensus is for retail sales to increase 0.2% in October, and to increase 0.2% ex-autos.
• At 9:55 AM, the Reuter's/University of Michigan's Consumer sentiment index (preliminary for November). The consensus is for a reading of 87.5, up from 86.9 in October.
• At 10:00 AM, the Mortgage Bankers Association (MBA) Q3 2014 National Delinquency Survey (NDS).
• Also at 10:00 AM, the Manufacturing and Trade: Inventories and Sales (business inventories) report for September. The consensus is for a 0.3% increase in inventories.
Freddie Mac: "Fixed Mortgage Rates Hovering Near 2014 Lows"
by Calculated Risk on 11/13/2014 05:03:00 PM
From Freddie Mac: Fixed Mortgage Rates Hovering Near 2014 Lows
Freddie Mac today released the results of its Primary Mortgage Market Survey® (PMMS®), showing average fixed mortgage rates little changed from the previous week with the 30-year mortgage still hovering around 4 percent.
30-year fixed-rate mortgage (FRM) averaged 4.01 percent with an average 0.5 point for the week ending November 13, 2014, down from last week when it averaged 4.02 percent. A year ago at this time, the 30-year FRM averaged 4.35 percent.
 Click on graph for larger image.
Here is a graph of 30 year fixed mortgage rates - according to the PMMS® - for 2010 through 2014 (red).
Mortgage rates are lower this year than last year (blue), and at about the same level as in 2011.
Note: Looking at daily rates from Mortgage News Daily, 30 year rates are at 4.05% today, down from 4.46% one year ago. The MND data is based on actual lender rate sheets, and is mostly "the average no-point, no-origination rate for top-tier borrowers with flawless scenarios". (this tracks the Freddie Mac series very well).
DataQuick on California Bay Area: Home Sales increased slightly in October, Few Distressed Sales
by Calculated Risk on 11/13/2014 02:14:00 PM
From DataQuick: San Francisco Bay Area Home Sales Edge Higher; Price Growth Ratchets Down Again
The Bay Area housing market posted another modest uptick in sales during October but activity remained below average as cash purchases continued to taper off and buyers faced a limited inventory as well as affordability and mortgage availability challenges. Home prices appear to have plateaued in recent months, although the October median sale price was still about 11 percent higher than a year earlier.A few key year-over-year trends: 1) declining distressed sales (can't decline much further!), 2) generally declining investor buying, 3) mostly flat total sales (up 1.3% year-over-year in October), 4) an increase in non-distressed sales.
A total of 7,693 new and resale houses and condos sold in the nine-county San Francisco Bay Area in October 2014. That was up 3.4 percent from 7,443 in September and up 1.3 percent from 7,595 in October 2013, according to CoreLogic DataQuick data..
A small gain in sales from September to October is normal for the season. The October sales count was the highest for that month since 7,902 homes sold in October 2012. October sales have ranged from a low of 5,486 in 2007 to a high of 13,392 in 2003. October 2014 sales were 9.7 percent below the October average of 8,521 sales since 1988, when CoreLogic DataQuick’s data began.
...
“After hitting what many view as a stratospheric level, Bay Area home prices have shown signs of leveling off,” said Andrew LePage, data analyst for CoreLogic DataQuick. “To some extent it’s the result of sticker shock and a modest pickup in inventory."
...
Foreclosure resales accounted for 2.7 percent of resales in October, down from a revised 2.8 percent the month before, and down from 3.7 percent a year ago. Foreclosure resales in the Bay Area peaked at 52.0 percent in February 2009, while the monthly average since 1995 is 9.7 percent. Foreclosure resales are homes that had been foreclosed on in the prior 12 months.
Short sales – transactions where the sale price fell short of what was owed on the property – made up an estimated 3.5 percent of Bay Area resales in October. That was down from an estimated 3.8 percent in September and down from 7.3 percent in October 2013.
emphasis added
Hotels: Occupancy Rate Finishing 2014 Strong
by Calculated Risk on 11/13/2014 12:27:00 PM
From HotelNewsNow.com: STR: US results for week ending 8 November
The U.S. hotel industry recorded positive results in the three key performance measurements during the week of 2-8 November 2014, according to data from STR, Inc.Note: ADR: Average Daily Rate, RevPAR: Revenue per Available Room.
In year-over-year measurements, the industry’s occupancy rose 3.5 percent to 66.2 percent. Average daily rate increased 5.4 percent to finish the week at US$117.48. Revenue per available room for the week was up 9.1 percent to finish at US$77.74.
emphasis added
The following graph shows the seasonal pattern for the hotel occupancy rate using the four week average.
Business travel has peaked for the Fall season, and now hotels are heading into the slow period.
 Click on graph for larger image.
The red line is for 2014, blue is the median, and black is for 2009 - the worst year since the Great Depression for hotels. Purple is for 2000.
The 4-week average of the occupancy rate is solidly above the median for 2000-2007, and since mid-June, the 4-week average of the occupancy rate has been a little higher than for the same week in 2000.
Right now it looks like 2014 will be the best year since 2000 for hotels. And since it takes some time to plan and build hotels, I expect 2015 will be even better for hotel occupancy.
Data Source: Smith Travel Research, Courtesy of HotelNewsNow.com
BLS: Jobs Openings at 4.7 million in September, Up 20% Year-over-year
by Calculated Risk on 11/13/2014 10:08:00 AM
From the BLS: Job Openings and Labor Turnover Summary
There were 4.7 million job openings on the last business day of September, little changed from 4.9 million in August, the U.S. Bureau of Labor Statistics reported today. ...The following graph shows job openings (yellow line), hires (dark blue), Layoff, Discharges and other (red column), and Quits (light blue column) from the JOLTS.
...
Quits are generally voluntary separations initiated by the employee. Therefore, the quits rate can serve as a measure of workers’ willingness or ability to leave jobs. ... The number of quits increased from 2.5 million in August to 2.8 million in September. This was the highest level of quits since April 2008.
This series started in December 2000.
Note: The difference between JOLTS hires and separations is similar to the CES (payroll survey) net jobs headline numbers. This report is for September, the most recent employment report was for October.
 Click on graph for larger image.
Note that hires (dark blue) and total separations (red and light blue columns stacked) are pretty close each month. This is a measure of labor market turnover. When the blue line is above the two stacked columns, the economy is adding net jobs - when it is below the columns, the economy is losing jobs.
Jobs openings decreased in September to 4.735 million from 4.853 million in August.
The number of job openings (yellow) are up 20% year-over-year compared to September 2013.
Quits are up 16% year-over-year. These are voluntary separations. (see light blue columns at bottom of graph for trend for "quits").
This is a very positive report. It is a good sign that job openings are over 4 million for the eight consecutive month, and that quits are increasing year-over-year - and at the highest level since April 2008.
Weekly Initial Unemployment Claims increased to 290,000
by Calculated Risk on 11/13/2014 08:34:00 AM
The DOL reported:
In the week ending November 8, the advance figure for seasonally adjusted initial claims was 290,000, an increase of 12,000 from the previous week's unrevised level of 278,000. The 4-week moving average was 285,000, an increase of 6,000 from the previous week's unrevised average of 279,000.The previous week was unrevised at 278,000.
There were no special factors impacting this week's initial claims.
The following graph shows the 4-week moving average of weekly claims since January 1971.
 Click on graph for larger image.
The dashed line on the graph is the current 4-week average. The four-week average of weekly unemployment claims increased to 285,000.
This was higher than the consensus forecast of 275,000, but the level suggests few layoffs.
Wednesday, November 12, 2014
Thursday: Job Openings, Unemployment Claims
by Calculated Risk on 11/12/2014 08:04:00 PM
From Nick Timiraos as the WSJ: Elevated Level of Part-Time Employment: Post-Recession Norm?
The unemployment rate has fallen sharply over the past year, but that improvement is masking a still-bleak picture for millions of workers who say they can’t find full-time jobs.Every month I post a graph of those working part time for economic reasons. Here is the October graph:
...
The situation of these so-called involuntary part-time workers—those who would prefer to work more than 34 hours a week—has economists puzzling over whether a higher level of part-time employment might be a permanent legacy of the great recession. If so, it could force more workers to choose between underemployment or working multiple jobs to make ends meet, leading to less income growth and weaker discretionary spending.
 From the BLS report:
The number of persons employed part time for economic reasons (sometimes referred to as involuntary part-time workers) was about unchanged in October at 7.0 million.The number of persons working part time for economic reasons decreased in October to 7.027 million from 7.103 million in September.
Although this is still very high, it is important to note that "normal" is probably in the 4 to 5 million range.
Thursday:
• At 8:30 AM ET, the initial weekly unemployment claims report will be released. The consensus is for claims to decrease to 275 thousand from 278 thousand.
• At 10:00 AM, the Job Openings and Labor Turnover Survey for September from the BLS. Note that the recent employment report was for October. Jobs openings increased in August to 4.835 million from 4.605 million in July. The number of job openings (yellow) were up 23% year-over-year. Quits were up 5% year-over-year.
• At 2:00 PM, the Monthly Treasury Budget Statement for October.
Lawler: Beazer Results and Q3 Builder Summary Table
by Calculated Risk on 11/12/2014 04:18:00 PM
From housing economist Tom Lawler: Beazer Homes: Net Orders Down a Bit, Double-Digit Drop in Net Orders/Community; 2014 Unit Sales “Disappointing” Though Home Prices Increased More Than “Expected”
Beazer Homes reported that net home orders in the quarter ended September 30, 2014 totaled 1,173, down 1.3% from the comparable quarter of 2013. Net orders per community last quarter were down about 11% from a year ago. Home deliveries last quarter totaled 1,695, up 2.3% from the comparable quarter of 2013, at an average sales price of $294,500, up 12.2% from a year ago. The company’s order backlog at the end of September was 1,690, down 10.7% from last September. The company owned or controlled 28,127 lots at the end of September, up 0.4% from last September and up 16.5% from two years ago.
Company officials described housing demand as “uneven” in 2014, but on average felt that demand was “disappointing,” and the company sold fewer houses than it had “expected.” Officials also said, however, that its average sales price increased by more than “expected,” but strangely officials did not link the higher prices with lower sales.
For the latest quarter officials described July sales as “so-so,” August sales as “awesome,” and September sales as “not so good.”
For FY 2015 (Beazer’s FY ends on September 30), Beazer expects “mid-teens” growth in its net orders and its community count, and an average sales price “nearing” $320,000. The ASP was $284,800 for FY 2014 and $294,500 for the latest quarter. Officials implied that this surprisingly high ASP expectation would come mainly from regional and product mix. Most analysts were skeptical that the company could achieve that high a sales price AND grow orders at a mid-teens pace.
Here are some summary stats for nine builders reporting results for the quarter ending September 30th.
| Net Orders | Settlements | Average Closing Price | |||||||
|---|---|---|---|---|---|---|---|---|---|
| Qtr. Ended: | 09/14 | 09/13 | % Chg | 09/14 | 09/13 | % Chg | 09/14 | 09/13 | % Chg |
| D.R. Horton | 7,135 | 5,160 | 38.3% | 8,612 | 6,866 | 25.4% | $279,099 | 262,453 | 6.3% |
| PulteGroup | 3,779 | 3,781 | -0.1% | 4,646 | 4,817 | -3.5% | $334,000 | 310,000 | 7.7% |
| NVR | 2,936 | 2,381 | 23.3% | 3,236 | 3,342 | -3.2% | $366,200 | 349,200 | 4.9% |
| The Ryland Group | 1,707 | 1,592 | 7.2% | 2,018 | 1,883 | 7.2% | $331,000 | 298,000 | 11.1% |
| Beazer Homes | 1,173 | 1,192 | -1.6% | 1,695 | 1,657 | 2.3% | $295,400 | 263,200 | 12.2% |
| Standard Pacific | 1,154 | 1,110 | 4.0% | 1,250 | 1,217 | 2.7% | $483,000 | 420,000 | 15.0% |
| Meritage Homes | 1,500 | 1,300 | 15.4% | 1,522 | 1,418 | 7.3% | $358,000 | 341,000 | 5.0% |
| MDC Holdings | 1,081 | 924 | 17.0% | 1,093 | 1,257 | -13.0% | $370,600 | 345,000 | 7.4% |
| M/I Homes | 892 | 869 | 2.6% | 985 | 937 | 5.1% | $320,000 | 284,000 | 12.7% |
| Total | 21,357 | 18,309 | 16.6% | 25,057 | 23,394 | 7.1% | $326,373 | $305,805 | 6.7% |
Net orders per community of these nine builders combined were up about 7.4% from a year ago. Acquisitions of other builds probably added about 1.6 percentage points to the YOY growth in net orders for the group. The order backlog for these builders at the end of September totaled 37,643, up 9.5% from last September.
Here is a chart comparing Census’ estimate for new SF home sales with net orders from these nine large builders (indexed: 2010 = 100)
 Click on graph for larger image.
Builders report net orders as gross orders in a quarter less sales cancellations in a quarter. Census defines “home sales” as gross contract signings less contract signings on homes on which a previously signed contract had been cancelled. There also appears to be a timing difference between when a builder recognizes an order and the date of a contract signing in Census’ Survey of Construction.


