 RSS Feed
 by Calculated Risk on 10/01/2014 02:58:00 PM
Wednesday, October 01, 2014
U.S. Light Vehicle Sales decrease to 16.34 million annual rate in September
Based on an WardsAuto estimate, light vehicle sales were at a 16.34 million SAAR in September. That is up 7% from September 2013, but down 6% from the 17.4 million annual sales rate last month.
This was below the consensus forecast of 16.8 million SAAR (seasonally adjusted annual rate).
 Click on graph for larger image.
This graph shows the historical light vehicle sales from the BEA (blue) and an estimate for September (red, light vehicle sales of 17.34 million SAAR from WardsAuto).
From WardsAuto:
After an August sales spike that drove the monthly SAAR to 17.45 million, September U.S. light vehicle sales cooled somewhat, dropping to an annualized rate just below 16.4 million on deliveries of 1.24 million LVs.
September's tally, nonetheless, represented a 4.7% uptick in daily sales compared with same-month year-ago, and brought year-to-date deliveries to 12.37 million units, a 5.4% improvement over the first nine months of 2013.
 The second graph shows light vehicle sales since the BEA started keeping data in 1967.
Note: dashed line is current estimated sales rate.
This was the fifth consecutive month with a sales rate over 16 million.
Reis: Office Vacancy Rate unchanged in Q3 at 16.8%
by Calculated Risk on 10/01/2014 01:08:00 PM
Reis released their Q3 2014 Office Vacancy survey this morning. Reis reported that the office vacancy rate was unchanged in Q3 compared to Q2 at 16.8%. This is down slightly from 16.9% in Q3 2013, and down from the cycle peak of 17.6%.
From Reis Senior Economist Ryan Severino:
The national vacancy rate once again held steady, registering 16.8% for the third consecutive quarter. Although this is superficially alarming, a few qualifications are necessary and important. First, net absorption technically outpaced new construction once again. However, much like last quarter, the difference was not sufficient enough to push the vacancy rate downward. Nonetheless, it is important to note that demand is not evaporating ‐ it is simply not producing a declining vacancy rate in recent quarters. Second, as we have observed in the recent past, construction and net absorption remain linked to each other due to the ongoing preleasing requirement in place for new construction financing. That has a tendency to keep supply and demand roughly in balance during weak recoveries such as this one when there is relatively little demand for existing inventory.On absorption and new construction:
Third, this pattern is not without precedent. Something similar occurred just last year. The national vacancy rate was identical during the first three quarters of 2013 before declining again during the fourth quarter. Therefore, this pause in vacancy compression needs to be examined in the proper context ‐ it is not signaling that the market recovery is going to reverse and vacancy rates will soon begin increasing. However, the unchanged vacancy rate serves as a stark reminder that five years removed from the advent of economic recovery in the United States, the office market recovery remains in early stages. If the labor market recovery continues its acceleration, this will change, but through the third quarter of this year its struggles continue.
emphasis added
Net absorption increased by 7.157 million square feet during the third quarter. This is a rebound from last quarter's 3.171 million SF. Although this is far from a healthy level of demand, it is back closer to the trend in net absorption that has occurred in recent quarters. Therefore, last quarter's weak reading appears to be an anomaly and the longer‐term trend in increasing net absorption, though relatively tepid, remains intact. The ongoing improvement in the labor market will serve as a catalyst for net absorption in the coming quarters. New construction totaled 4.791 million square feet during the third quarter. Construction levels remain far below those indicative of a healthy market environment.On rents:
Asking and effective rents both grew by 0.4% during the third quarter. This is a slight deceleration from last quarter's performance for both rent metrics. Nevertheless, asking and effective rents have now risen for sixteen consecutive quarters. Moreover, we continue to see modest but ongoing acceleration in rent growth over time. Asking rent growth was 1.6% during 2011, 1.8% during 2012, and 2.1% in 2013, and 2.5% over the prior 12 months ending with the second quarter of this year. During the third quarter, the 12‐month change in asking rent increased just slightly to 2.6%. Given how elevated the national vacancy rate remains, we should not expect much acceleration in rent growth until the vacancy rate declines to a more conducive level, hundreds of basis points below the current 16.8% rate.
 Click on graph for larger image.
This graph shows the office vacancy rate starting in 1980 (prior to 1999 the data is annual).
Reis reported the vacancy rate was unchanged at 16.8% in Q3, and was down from 16.9% in Q2 2013. The vacancy rate peaked in this cycle at 17.6% in Q3 and Q4 2010, and Q1 2011.
There will not be a significant pickup in new construction until the vacancy rate falls much further.
Office vacancy data courtesy of Reis.
Construction Spending decreased 0.8% in August
by Calculated Risk on 10/01/2014 10:42:00 AM
Earlier the Census Bureau reported that overall construction spending decreased in August:
The U.S. Census Bureau of the Department of Commerce announced today that construction spending during August 2014 was estimated at a seasonally adjusted annual rate of $961.0 billion, 0.8 percent below the revised July estimate of $968.8 billion. The August figure is 5.0 percent above the August 2013 estimate of $915.3 billion.Both private and public spending decreased in August:
Spending on private construction was at a seasonally adjusted annual rate of $685.0 billion, 0.8 percent below the revised July estimate of $690.3 billion. Residential construction was at a seasonally adjusted annual rate of $351.7 billion in August, 0.1 percent below the revised July estimate of $352.1 billion. Nonresidential construction was at a seasonally adjusted annual rate of $333.3 billion in August, 1.4 percent below the revised July estimate of $338.1 billion. ...
In August, the estimated seasonally adjusted annual rate of public construction spending was $275.9 billion, 0.9 percent below the revised July estimate of $278.5 billion.
emphasis added
 Click on graph for larger image.
This graph shows private residential and nonresidential construction spending, and public spending, since 1993. Note: nominal dollars, not inflation adjusted.
Private residential spending has declined recently and is 48% below the peak in early 2006 - but up 54% from the post-bubble low.
Non-residential spending is 20% below the peak in January 2008, and up about 48% from the recent low.
Public construction spending is now 14% below the peak in March 2009 and about 7% above the post-recession low.
 The second graph shows the year-over-year change in construction spending.
On a year-over-year basis, private residential construction spending is now up 4%. Non-residential spending is up 9% year-over-year. Public spending is up 2% year-over-year.
Looking forward, all categories of construction spending should increase in 2014. Residential spending is still very low, non-residential is starting to pickup, and public spending has probably hit bottom after several years of austerity.
This was a weak report - well below the consensus forecast of a 0.5% increase - and there were also downward revisions to spending in June and July.
ISM Manufacturing index declines to 56.6 in September
by Calculated Risk on 10/01/2014 10:06:00 AM
The ISM manufacturing index suggests slower expansion in September than in August. The PMI was at 56.6% in September, down from 59.0% in August. The employment index was at 54.6%, down from 58.1% in August, and the new orders index was at 60.0%, down from 66.7%.
From the Institute for Supply Management: September 2014 Manufacturing ISM® Report On Business®
Economic activity in the manufacturing sector expanded in September for the 16th consecutive month, and the overall economy grew for the 64th consecutive month, say the nation’s supply executives in the latest Manufacturing ISM® Report On Business®.
The report was issued today by Bradley J. Holcomb, CPSM, CPSD, chair of the Institute for Supply Management® (ISM®) Manufacturing Business Survey Committee. "The September PMI® registered 56.6 percent, a decrease of 2.4 percentage points from August’s reading of 59 percent, indicating continued expansion in manufacturing. The New Orders Index registered 60 percent, a decrease of 6.7 percentage points from the 66.7 percent reading in August, indicating growth in new orders for the 16th consecutive month. The Production Index registered 64.6 percent, 0.1 percentage point above the August reading of 64.5 percent. The Employment Index grew for the 15th consecutive month, registering 54.6 percent, a decrease of 3.5 percentage points below the August reading of 58.1 percent. Inventories of raw materials registered 51.5 percent, a decrease of 0.5 percentage point from the August reading of 52 percent, indicating growth in inventories for the second consecutive month. Comments from the panel reflect a generally positive business outlook, while noting some labor shortages and continuing concern over geopolitical unrest."
emphasis added
 Click on graph for larger image.
Here is a long term graph of the ISM manufacturing index.
This was below expectations of 58.0%, but still shows decent expansion in September.
ADP: Private Employment increased 213,000 in September
by Calculated Risk on 10/01/2014 08:18:00 AM
Private sector employment increased by 213,000 jobs from August to September according to the August ADP National Employment Report®. ... The report, which is derived from ADP’s actual payroll data, measures the change in total nonfarm private employment each month on a seasonally-adjusted basis.This was slightly above the consensus forecast for 200,000 private sector jobs added in the ADP report.
...
Mark Zandi, chief economist of Moody’s Analytics, said, "Job gains remain strong and steady. The pace of job growth has been remarkably similar for the past several years. Especially encouraging most recently is the increasingly broad base nature of those gains. Nearly all industries and companies of all sizes are adding consistently to payrolls.”
The BLS report for September will be released on Friday.
MBA: Mortgage Applications Decrease Slightly in Latest MBA Weekly Survey
by Calculated Risk on 10/01/2014 07:00:00 AM
From the MBA: Mortgage Applications Decrease Slightly in Latest MBA Weekly Survey
Mortgage applications decreased 0.2 percent from one week earlier, according to data from the Mortgage Bankers Association’s (MBA) Weekly Mortgage Applications Survey for the week ending September 26, 2014. ...
The Refinance Index decreased 0.3 percent from the previous week. The seasonally adjusted Purchase Index remained unchanged from one week earlier. The unadjusted Purchase Index decreased 1 percent compared with the previous week and was 11 percent lower than the same week one year ago. ...
...
The average contract interest rate for 30-year fixed-rate mortgages with conforming loan balances ($417,000 or less) decreased to 4.33 percent from 4.39 percent, with points decreasing to 0.31 from 0.35 (including the origination fee) for 80 percent loan-to-value ratio (LTV) loans.
emphasis added
 Click on graph for larger image.
The first graph shows the refinance index.
The refinance index is down 76% from the levels in May 2013.
Refinance activity is very low this year and will be the lowest since year 2000.
 The second graph shows the MBA mortgage purchase index.
 According to the MBA, the unadjusted purchase index is down about 11% from a year ago.
Tuesday, September 30, 2014
Wednesday: Vehicle Sales, ISM Manufacturing, ADP Employment, Q3 Office Vacancies, Construction Spending
by Calculated Risk on 9/30/2014 08:01:00 PM
Wednesday will be busy! First, from the National Restaurant Association: Restaurant Performance Index Registers August Gain
Driven by stronger same-store sales and customer traffic levels and a more optimistic outlook among restaurant operators, the National Restaurant Association’s Restaurant Performance Index (RPI) posted a solid gain in August. The RPI – a monthly composite index that tracks the health of and outlook for the U.S. restaurant industry – stood at 101.9 in August, up 1.0 percent from July and its first gain in three months. In addition, the RPI stood above 100 for the 18th consecutive month, which signifies expansion in the index of key industry indicators.
“The August gain in the RPI was fueled by stronger same-store sales and customer traffic results, aided by continued improving economic conditions,” said Hudson Riehle, senior vice president of the Research and Knowledge Group for the Association. “Looking forward, restaurant operators remain generally optimistic about continued sales growth, while a majority plans to make a capital expenditure in the next six months. However, operators still report food costs and government among top challenges that continue to negatively affect the operating environment.”
emphasis added
 Click on graph for larger image.
The index increased to 101.9 in August, up from 101.0 in July. (above 100 indicates expansion).
Restaurant spending is discretionary, so even though this is "D-list" data, I like to check it every month. This is a solid reading.
Wednesday:
• At 7:00 AM ET, the Mortgage Bankers Association (MBA) will release the results for the mortgage purchase applications index.
• All day, Light vehicle sales for September. The consensus is for light vehicle sales to decrease to 16.8 million SAAR in September from 17.4 million in August (Seasonally Adjusted Annual Rate).
• 8:15 AM, the ADP Employment Report for September. This report is for private payrolls only (no government). The consensus is for 200,000 payroll jobs added in September, down from 205,000 in August.
• Early, Reis Q3 2014 Office Survey of rents and vacancy rates.
• At 10:00 AM, the ISM Manufacturing Index for September. The consensus is for a decrease to 58.0 from 59.0 in August. The ISM manufacturing index indicated expansion in August at 59.0%. The employment index was at 58.1%, and the new orders index was at 66.7%.
• At 10:00 AM, Construction Spending for August. The consensus is for a 0.5% increase in construction spending.
Fannie Mae: Mortgage Serious Delinquency rate below 2% in August, Lowest since October 2008
by Calculated Risk on 9/30/2014 04:11:00 PM
Fannie Mae reported today that the Single-Family Serious Delinquency rate declined slightly in August to 1.99% from 2.00% in July. The serious delinquency rate is down from 2.61% in August 2013, and this is the lowest level since October 2008.
The Fannie Mae serious delinquency rate peaked in February 2010 at 5.59%.
Freddie Mac has not reported for August yet.
Note: These are mortgage loans that are "three monthly payments or more past due or in foreclosure".
 Click on graph for larger image
The Fannie Mae serious delinquency rate has fallen 0.62 percentage points over the last year, and at that pace the serious delinquency rate will be under 1% in 2016 - although the rate of decline has slowed recently.
Note: The "normal" serious delinquency rate is under 1%.
Maybe serious delinquencies will be close to normal in 2016.
House Prices: Real Prices and Price-to-Rent Ratio decline in July
by Calculated Risk on 9/30/2014 01:44:00 PM
I started 2014 expecting a slowdown in year-over-year (YoY) prices as "For Sale" inventory increases, and the price slowdown is very obvious! The Case-Shiller Composite 20 index was up 6.7% YoY in July; the smallest YoY increase since November 2012 (the National index was up 5.6%, also the slowest YoY increase since November 2012.
I expect YoY prices to slow further over the next several months.
It is also important to look at prices in real terms (inflation adjusted). Case-Shiller, CoreLogic and others report nominal house prices. As an example, if a house price was $200,000 in January 2000, the price would be close to $280,000 today adjusted for inflation (40%). That is why the second graph below is important - this shows "real" prices (adjusted for inflation).
Nominal House Prices
 The first graph shows the monthly Case-Shiller National Index SA, the monthly Case-Shiller Composite 20 SA, and the CoreLogic House Price Indexes (through July) in nominal terms as reported.
In nominal terms, the Case-Shiller National index (SA) is back to February 2005 levels, and the Case-Shiller Composite 20 Index (SA) is back to September 2004 levels, and the CoreLogic index (NSA) is back to February 2005.
Real House Prices
 The second graph shows the same three indexes in real terms (adjusted for inflation using CPI less Shelter). Note: some people use other inflation measures to adjust for real prices.
In real terms, the National index is back to July 2002 levels, the Composite 20 index is back to June 2002, and the CoreLogic index back to March 2003.
In real terms, house prices are back to early '00s levels.
Price-to-Rent
In October 2004, Fed economist John Krainer and researcher Chishen Wei wrote a Fed letter on price to rent ratios: House Prices and Fundamental Value. Kainer and Wei presented a price-to-rent ratio using the OFHEO house price index and the Owners' Equivalent Rent (OER) from the BLS.
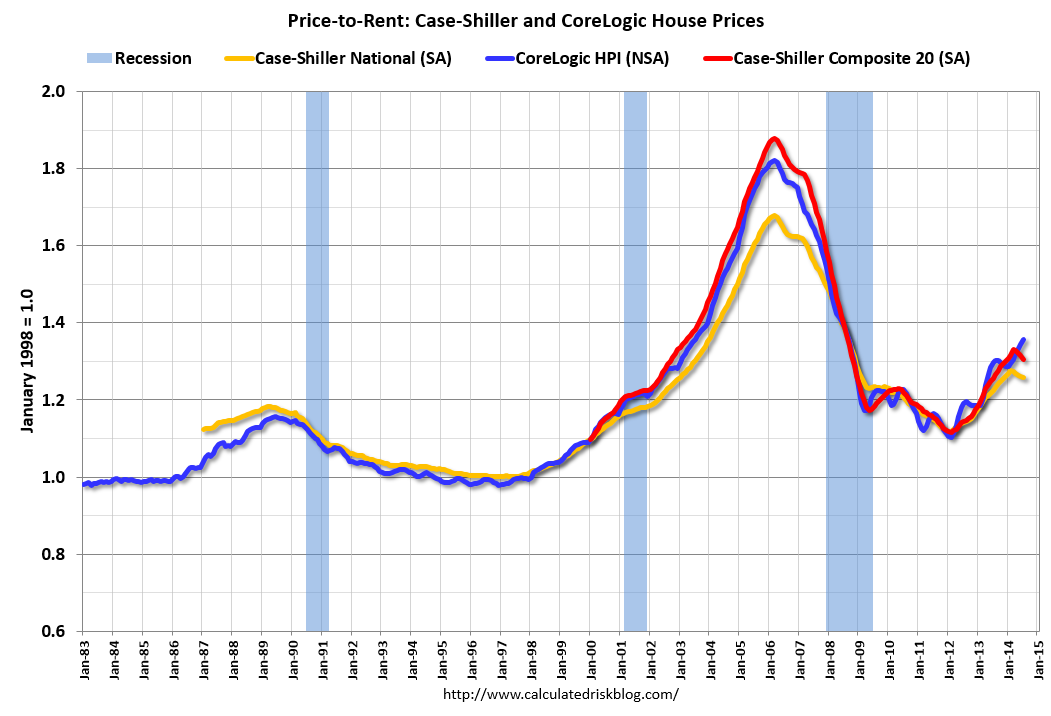 Here is a similar graph using the Case-Shiller National, Composite 20 and CoreLogic House Price Indexes.
This graph shows the price to rent ratio (January 1998 = 1.0).
On a price-to-rent basis, the Case-Shiller National index is back to December 2002 levels, the Composite 20 index is back to September 2002 levels, and the CoreLogic index is back to July 2003.
In real terms, and as a price-to-rent ratio, prices are mostly back to early 2000 levels.
A few comments on the Seasonal Pattern for House Prices
by Calculated Risk on 9/30/2014 11:20:00 AM
A few key points:
1) There is a clear seasonal pattern for house prices.
2) The surge in distressed sales during the housing bust distorted the seasonal pattern.
3) Even though distressed sales are down significantly, the seasonal factor is based on several years of data - and the factor is now overstating the seasonal change.
4) Still the seasonal index is probably a better indicator of actual price movements than the Not Seasonally Adjusted (NSA) index.
For in depth description of these issues, see Trulia chief economist Jed Kolko's article "Let’s Improve, Not Ignore, Seasonal Adjustment of Housing Data"
The housing crisis substantially changed the seasonal pattern of housing activity: relative to conventional home sales, which peak in summer, distressed home sales are more evenly spread throughout the year and sell at a discount. As a result, in years when distressed sales constitute a larger share of overall sales, the seasonal swings in home prices get bigger while the seasonal swings in sales volumes get smaller.Kolko proposed an improved seasonal adjustment. For July, the reported seasonally adjusted month-to-month change for the Composite 20 was -0.5%, but using Kolko's method prices were flat. For the National index, the reported change was +0.2%, and Kolko's method would yield 0.3%.
Sharply changing seasonal patterns create problems for seasonal adjustment methods, which typically estimate seasonal adjustment factors by averaging several years’ worth of observed seasonal patterns. A sharp but ultimately temporary change in the seasonal pattern for housing activity affects seasonal adjustment factors more gradually and for more years than it should. Despite the recent normalizing of the housing market, seasonal adjustment factors are still based, in part, on patterns observed at the height of the foreclosure crisis, causing home price indices to be over-adjusted in some months and under-adjusted in others.
Unfortunately, many have concluded that the solution to the problem of changing seasonal patterns is to downplay or ignore seasonally adjusted housing data until the foreclosure crisis is far enough in the past that it is no longer averaged into seasonal adjustment factors. Standard and Poor’s, publishers of the Case-Shiller home-price index, themselves warned in 2010 that “the unadjusted series is a more reliable indicator and, thus, reports should focus on the year-over-year changes where seasonal shifts are not a factor. Additionally, if monthly changes are considered, the unadjusted series should be used.” Even today, Case-Shiller home-price index press releases continue to emphasize non-seasonally-adjusted (NSA) changes over seasonally adjusted (SA) changes.
But ignoring seasonality during and after the foreclosure crisis is the opposite of what we should be doing. Changing seasonal patterns make seasonal adjustment more important.
Note: I was one of several people to question the change in the seasonal factor (here is a post in 2009) - and this led to S&P Case-Shiller questioning the seasonal factor too (from April 2010).
 Click on graph for larger image.
This graph shows the month-to-month change in the CoreLogic and NSA Case-Shiller National index since 1987 (both through July). The seasonal pattern was smaller back in the '90s and early '00s, and increased since the bubble burst.
It appears we've already seen the strongest month this year (NSA) for both Case-Shiller NSA and CoreLogic. This suggests both indexes will turn negative seasonally (NSA) earlier this year than the previous two years - perhaps in the August reports.
 The second graph shows the seasonal factors for the Case-Shiller National index since 1987. The factors started to change near the peak of the bubble, and really increased during the bust.
 It appears the seasonal factor has started to decrease, and I expect that over the next several years - as the percent of distressed sales declines further and recent history is included in the factors - the seasonal factors will move back towards more normal levels.
However, as Kolko noted, there will be a lag with the seasonal factor since it is based on several years of recent data.


