 RSS Feed
 by Calculated Risk on 1/24/2014 09:09:00 AM
Friday, January 24, 2014
Q4 GDP Seen at 3.8%
Next week will be busy with another FOMC meeting (more tapering) and plenty of data releases.
From Merill Lynch on Q4 GDP:
We look for the first estimate of 4Q GDP to show solid growth of 3.8%. Of course, there is greater room for forecast error with the first release since a number of inputs are estimates (particularly trade and inventory data). That said, we forecast a strong gain in consumer spending, reflecting the healthy retail sales data and holiday shopping season. We also look for equipment and software investment to strengthen, as suggested by the pop higher in core capital goods orders. The trade deficit should narrow due to strong global growth but also a continued decline in US imports of petroleum. Inventory should remain little changed at very high levels, which we believe is unintentional. We think businesses will look to reduce inventories to more sustainable levels in the next few quarters. Overall, the report should show a healthy end to 2013 and momentum heading into 2014.That would put 2013 real GDP growth at about 2.0% (over 2012).
emphasis added
Thursday, January 23, 2014
Framing Lumber Prices: Moving on Up
by Calculated Risk on 1/23/2014 06:42:00 PM
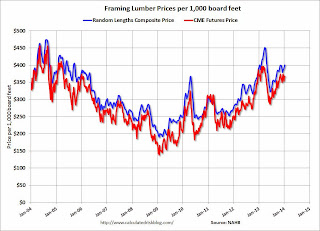
Here is another graph on framing lumber prices. Early last year lumber prices came close to the housing bubble highs. Then prices started to decline sharply, with prices declined over 25% from the highs by June.
The price increases early last year were due to stronger demand (more housing starts) and supply constraints (framing lumber suppliers were working to bring more capacity online). My understanding is capacity has increased, but demand has increased too.
Prices have been increasing since June (there is some seasonality to prices).
Prices in early January are at about the same level as last year.
 Click on graph for larger image in graph gallery.
This graph shows two measures of lumber prices: 1) Framing Lumber from Random Lengths through last week (via NAHB), and 2) CME framing futures.
We will probably see a further increase in prices over the next few months as housing starts increase (Not seasonally adjusted, housing starts usually peak during Q2 of the year).
Kansas City Fed: Manufacturing Survey shows "Activity rebounded moderately in January"
by Calculated Risk on 1/23/2014 03:19:00 PM
From the Kansas City Fed: Tenth District Manufacturing Survey Rebounded Moderately
The Federal Reserve Bank of Kansas City released the January Manufacturing Survey today. According to Chad Wilkerson, vice president and economist at the Federal Reserve Bank of Kansas City, the survey revealed that Tenth District manufacturing activity rebounded moderately in January, and factories’ production expectations continued to climb higher.All of the regional surveys have suggested somewhat faster growth in January than in December. The last of the regional Fed manufacturing surveys for January will be released early next week (Richmond and Dallas Fed).
“We were encouraged to see overall regional factory activity grow in January after dropping last month, said Wilkerson. Production fell slightly in January, which many firms again attributed to weather-related delays, but orders rose and optimism about the future increased.”
...
The month-over-month composite index was 5 in January, up from -3 December and similar to the reading of 6 in November ... The employment index jumped from 0 to 11–its highest level since October 2011–and the new orders for exports index moved into positive territory for the first time in five months. ...
emphasis added
Comments on Existing Home Sales: Watch Inventory
by Calculated Risk on 1/23/2014 12:04:00 PM
The key story in the NAR release this morning was that inventory was only up 1.6% year-over-year in December. The year-over-year inventory increase for November was revised down to 3.0% (from 5.0%).
A few points:
• The NAR inventory data is "noisy" (and difficult to forecast based on other data).
• The headline NAR inventory number is NOT seasonally adjusted (and there is a clear seasonal pattern).
• On a seasonally adjusted basis, inventory was down in December from November, but up 4.3% from the low in January 2013 (see first graph below).
• Inventory is still very low, and with the low level of inventory, there is still upward pressure on prices.
• I expect inventory to increase in 2014, and I expect the year-over-year increase to be in the 10% to 15% range by the end of 2014.
• However, if inventory doesn't increase, prices will probably increase a little faster than expected (a key reason to watch inventory right now).
 Click on graph for larger image.
The NAR does not seasonally adjust inventory, even though there is a clear seasonal pattern. Trulia chief economist Jed Kolko sent me the seasonally adjusted inventory (see graph of NAR reported and seasonally adjusted).
This shows that inventory bottomed in January 2013 (on a seasonally adjusted basis), and is now up about 4.3% from the bottom. On a seasonally adjusted basis, inventory was down 1.7% in December.
Important: The NAR reports active listings, and although there is some variability across the country in what is considered active, most "contingent short sales" are not included. "Contingent short sales" are strange listings since the listings were frequently NEVER on the market (they were listed as contingent), and they hang around for a long time - they are probably more closely related to shadow inventory than active inventory. However when we compare inventory to 2005, we need to remember there were no "short sale contingent" listings in 2005. In the areas I track, the number of "short sale contingent" listings is also down sharply year-over-year.
Another key point: The NAR reported total sales were down 0.6% from December 2012, but conventional sales were probably up significantly from December 2012, and distressed sales down. The NAR reported that 14% of sales were distressed in December (from a survey that isn't perfect):
Ten percent of December sales were foreclosures, and 4 percent were short sales.Last year the NAR reported that 24% of sales were distressed sales.
A rough estimate: Sales in December 2012 were reported at 4.94 million SAAR with 24% distressed. That gives 1.18 million distressed (annual rate), and 3.72 million conventional. In December 2013, sales were 4.87 million SAAR, with 12% distressed. That gives 0.68 million distressed, and 4.19 million conventional. Although this survey isn't perfect, this suggests distressed sales were down sharply - and conventional sales up. A positive sign!
The following graph shows existing home sales Not Seasonally Adjusted (NSA).
 Click on graph for larger image.
Sales NSA in December (red column) were above the sales for 2007 through 2012). There was one more selling day in 2013, so seasonally adjusted sales were down slightly.
Overall this was a solid report, but inventory needs to be watched closely (as usual).
Earlier:
• Existing Home Sales in December: 4.87 million SAAR, Inventory up 1.6% Year-over-year
Existing Home Sales in December: 4.87 million SAAR, Inventory up 1.6% Year-over-year
by Calculated Risk on 1/23/2014 10:00:00 AM
The NAR reports: December Existing-Home Sales Rise, 2013 Strongest in Seven Years
Total existing-home sales, which are completed transactions that include single-family homes, townhomes, condominiums and co-ops, increased 1.0 percent to a seasonally adjusted annual rate of 4.87 million in December from a downwardly revised 4.82 million in November, but are 0.6 percent below the 4.90 million-unit level in December 2012.
For all of 2013, there were 5.09 million sales, which is 9.1 percent higher than 2012. It was the strongest performance since 2006 when sales reached an unsustainably high 6.48 million at the close of the housing boom.
...
Total housing inventory at the end of December fell 9.3 percent to 1.86 million existing homes available for sale, which represents a 4.6-month supply at the current sales pace, down from 5.1 months in November. Unsold inventory is 1.6 percent above a year ago, when there was a 4.5-month supply.
...
Adverse weather reportedly delayed closings in many areas. Twenty-eight percent of homes sold in December were on the market for less than a month, down from 35 percent in November, which appears to be a weather impact.
 Click on graph for larger image.
This graph shows existing home sales, on a Seasonally Adjusted Annual Rate (SAAR) basis since 1993.
Sales in December 2013 (4.87 million SAAR) were 1.0% higher than last month, and were 0.6% below the December 2012 rate.
The second graph shows nationwide inventory for existing homes.
 According to the NAR, inventory declined to 1.86 million in December from 2.05 million in November. Inventory is not seasonally adjusted, and inventory usually increases from the seasonal lows in December and January, and peaks in mid-to-late summer.
The third graph shows the year-over-year (YoY) change in reported existing home inventory and months-of-supply. Since inventory is not seasonally adjusted, it really helps to look at the YoY change. Note: Months-of-supply is based on the seasonally adjusted sales and not seasonally adjusted inventory.
 Inventory increased 1.6% year-over-year in December compared to December 2012. This year-over-year increase in inventory suggests inventory bottomed earlier this year.
Months of supply was at 4.6 months in December.
This was slightly below to expectations of sales of 4.90 million. For existing home sales, the key number is inventory - and inventory is still low, but up year-over-year. I'll have more later ...
Weekly Initial Unemployment Claims at 326,000
by Calculated Risk on 1/23/2014 08:35:00 AM
The DOL reports:
In the week ending January 18, the advance figure for seasonally adjusted initial claims was 326,000, an increase of 1,000 from the previous week's revised figure of 325,000. The 4-week moving average was 331,500, a decrease of 3,750 from the previous week's revised average of 335,250.The previous week was revised down from 326,000.
The following graph shows the 4-week moving average of weekly claims since January 2000.
 Click on graph for larger image.
The dashed line on the graph is the current 4-week average. The four-week average of weekly unemployment claims decreased to 331,500.
This week was the BLS reference period for the employment report and the recent decline in claims is a positive sign for the January report.
Wednesday, January 22, 2014
Thursday: Existing Home Sales, Unemployment Claims
by Calculated Risk on 1/22/2014 08:49:00 PM
Thursday:
• At 8:30 AM ET, the initial weekly unemployment claims report will be released. The consensus is for claims to increase to 330 thousand from 326 thousand.
• At 9:00 AM, the Markit US PMI Manufacturing Index Flash for January. The consensus is for an increase to 55.0 from 54.4 in December.
• Also at 9:00 AM: the FHFA House Price Index for November 2013. This was originally a GSE only repeat sales, however there is also an expanded index. The consensus is for a 0.4% increase.
• At 10:00 AM: Existing Home Sales for December from the National Association of Realtors (NAR). The consensus is for sales of 4.90 million on seasonally adjusted annual rate (SAAR) basis. Sales in November were at a 4.90 million SAAR. Economist Tom Lawler estimates the NAR will report sales of 4.96 million SAAR. As always, a key will be inventory of homes for sale.
• At 11:00 AM: the Kansas City Fed manufacturing survey for January.
Short sales, Foreclosures and Cash buyers
Note: The NAR will release existing home sales and inventory for December tomorrow. It is also interesting to look at the trend for distressed sales (foreclosures and short sales), and for all cash buyers (frequently investors). Economist Tom Lawler sent me another update to the table below of short sales, foreclosures and cash buyers for several selected cities in December.
From CR: Total "distressed" share is down in all of these markets, and down significantly in most.
Short sales are down sharply in all of these markets (this was a real change in 2013, and I expect further declines in short sales in 2014).
Important Note on short sales: Historically the IRS has considered debt forgiveness (like short sales) as taxable income. In 2007, Congress passed a measure to exempt most forgiven mortgage debt from being considered taxable income (this helped increase short sale activity). This measure expired on Dec 31, 2013. However, according to a letter from the IRS:
"[I]f a property owner cannot be held personally liable for the difference between the loan balance and the sales price, we would consider the obligation as a nonrecourse obligation. In this situation, the owner would not treat the cancelled debt as income."So in states that passed anti-deficiency provisions (like California), this means many loans will be considered nonrecourse by the IRS (and forgiven debt will not be taxed). In other states, forgiven debt will be taxed.
Foreclosures are down in all of these areas too (except Springfield, Ill and Miami).
The All Cash Share (last two columns) is mostly declining year-over-year. It appears investors are pulling back in markets like Las Vegas and SoCal - probably because of fewer distressed sales and higher prices.
| Short Sales Share | Foreclosure Sales Share | Total "Distressed" Share | All Cash Share | |||||
|---|---|---|---|---|---|---|---|---|
| Dec-13 | Dec-12 | Dec-13 | Dec-12 | Dec-13 | Dec-12 | Dec-13 | Dec-12 | |
| Las Vegas | 20.7% | 45.8% | 8.5% | 9.5% | 29.2% | 55.3% | 44.4% | 55.2% |
| Reno | 24.0% | 47.0% | 4.0% | 10.0% | 28.0% | 57.0% | ||
| Phoenix | 9.5% | 27.2% | 7.5% | 12.2% | 17.1% | 39.4% | 34.6% | 45.4% |
| Sacramento | 12.0% | 40.0% | 7.3% | 11.5% | 19.3% | 51.5% | 19.5% | 39.6% |
| Minneapolis | 5.4% | 12.4% | 17.3% | 26.7% | 22.7% | 39.1% | ||
| Mid-Atlantic | 8.0% | 13.0% | 9.3% | 9.7% | 17.3% | 22.7% | 19.3% | 20.3% |
| Orlando | 13.6% | 30.4% | 19.1% | 20.1% | 32.7% | 50.5% | 44.9% | 53.6% |
| California * | 15.5% | 26.7% | 6.7% | 15.8% | 22.2% | 42.5% | ||
| Bay Area CA* | 10.5% | 23.6% | 4.5% | 12.1% | 15.0% | 35.7% | 22.5% | 29.9% |
| So. California* | 13.2% | 26.7% | 5.8% | 14.2% | 19.0% | 40.9% | 27.7% | 35.8% |
| Tampa MSA SF | 11.9% | 22.4% | 18.2% | 17.4% | 30.1% | 39.8% | 42.0% | 48.2% |
| Tampa MSA C/TH | 8.4% | 17.7% | 15.8% | 17.0% | 24.2% | 34.6% | 62.8% | 70.0% |
| Miami MSA SF | 15.3% | 22.9% | 15.1% | 14.0% | 30.3% | 37.0% | 43.6% | 47.7% |
| Miami MSA C/TH | 11.9% | 18.7% | 17.0% | 13.7% | 28.9% | 32.4% | 71.8% | 78.3% |
| Tucson | 32.3% | 33.1% | ||||||
| Toledo | 36.5% | 41.6% | ||||||
| Wichita | 30.2% | 30.6% | ||||||
| Des Moines | 23.1% | 21.6% | ||||||
| Omaha | 23.9% | 20.6% | ||||||
| Pensacola | 36.5% | 32.7% | ||||||
| Georgia*** | 32.0% | N/A | ||||||
| Hampton Roads | 29.1% | 31.7% | ||||||
| Northeast Florida | 36.2% | 42.7% | ||||||
| Chicago | 36.0% | 45.0% | ||||||
| Houston | 6.5% | 14.2% | ||||||
| Memphis* | 21.0% | 25.6% | ||||||
| Birmingham AL | 22.5% | 34.0% | ||||||
| Springfield IL** | 17.7% | 14.2% | ||||||
| *share of existing home sales, based on property records | ||||||||
| **Single Family Only | ||||||||
| ***GAMLS only | ||||||||
ATA Trucking Index increased in December
by Calculated Risk on 1/22/2014 03:50:00 PM
Here is a minor indicator that I follow, from ATA: December Tonnage Gain Caps ATA Tonnage Index's Best Year Since 1998
The American Trucking Associations’ advanced seasonally adjusted For-Hire Truck Tonnage Index increased 0.6% in December, after surging 4.7% in November. The increase pushed the index 6.2% higher for the full year making it the index's best year since 1998.
November’s increase was significantly larger than the preliminary gain of 2.7% ATA reported on December 20, 2013. In December, the index equaled 131.7 (2000=100) versus 130.9 in November. December’s level is a record high. Compared with December 2012, the SA index increased 8.2%.
...
“Tonnage ended 2013 on a high note, which fits with many economic indicators as trucking is an excellent reflection of the tangible goods economy,” said ATA Chief Economist Bob Costello. “The final quarter was the strongest we’ve seen in a couple of years, rising 2.2% from the third quarter and 9.1% from a year earlier.”
Costello reiterated his statement from last month: the tonnage acceleration in the second half of the year is pointing to an economy that is likely stronger than some might believe.
“I’m seeing more broad-based gains now. The improvement is not limited to the tank truck and flatbed sectors like earlier in the year," he said. "With manufacturing and consumer spending picking up, coupled with solid volumes from hydraulic fracturing, I look for tonnage to be good in 2014 as well.”
emphasis added
 Click on graph for larger image.
Here is a long term graph that shows ATA's For-Hire Truck Tonnage index.
The dashed line is the current level of the index.
The index is up solidly year-over-year. The index is at a record high, and this was best year for growth since 1998.
DOT: Vehicle Miles Driven decreased 0.1% in November
by Calculated Risk on 1/22/2014 12:55:00 PM
First, an interesting article from Brad Plumer at the WaPo: The U.S. government keeps predicting we’ll drive more than we do. That’s a problem.
The Department of Transportation (DOT) reported:
Travel on all roads and streets changed by -0.1% (-0.2 billion vehicle miles) for November 2013 as compared with November 2012. Travel for the month is estimated to be 239.5 billion vehicle miles.The following graph shows the rolling 12 month total vehicle miles driven.
The rolling 12 month total is still mostly moving sideways but has started to increase a little recently.
 Click on graph for larger image.
In the early '80s, miles driven (rolling 12 months) stayed below the previous peak for 39 months.
Currently miles driven has been below the previous peak for 72 months - 6 years - and still counting. Currently miles driven (rolling 12 months) are about 2.3% below the previous peak.
The second graph shows the year-over-year change from the same month in the previous year.
 In November 2013, gasoline averaged of $3.32 per gallon according to the EIA. that was down sharply from 2012 when prices in November averaged $3.52 per gallon.
As we've discussed, gasoline prices are just part of the story. The lack of growth in miles driven over the last 6 years is probably also due to the lingering effects of the great recession (high unemployment rate and lack of wage growth), the aging of the overall population (over 55 drivers drive fewer miles) and changing driving habits of young drivers.
With all these factors, it might take a few more years before we see a new peak in miles driven - but it appears miles driven might be gradually increasing again.
AIA: Architecture Billings Index declines in December
by Calculated Risk on 1/22/2014 09:54:00 AM
Note: This index is a leading indicator primarily for new Commercial Real Estate (CRE) investment.
From AIA: Another Decline for Architecture Billings Index
Following consistently increasing demand for design services throughout most of 2013, the Architecture Billings Index (ABI) has posted its first consecutive months of contraction since May and June of 2012. As a leading economic indicator of construction activity, the ABI reflects the approximate nine to twelve month lead time between architecture billings and construction spending. The American Institute of Architects (AIA) reported the December ABI score was 48.5, down from a mark of 49.8 in November. This score reflects a decrease in design services (any score above 50 indicates an increase in billings). The new projects inquiry index was 59.2, up from the reading of 57.8 the previous month.
“What we thought last month was an isolated dip now bears closer examination to see what is causing the slowdown in demand for architectural services,” said AIA Chief Economist Kermit Baker, Hon. AIA, PhD. “It is possible that some of this can be attributed to the anxiety in the marketplace caused by the shutdown of the federal government, but it will be important to see how business conditions fare through the first quarter of the new year when we no longer have end of the year issues to deal with.”
emphasis added
 Click on graph for larger image.
This graph shows the Architecture Billings Index since 1996. The index was at 48.5 in December, down from 49.8. Anything below 50 indicates contraction in demand for architects' services. Still this index has indicated expansion in 14 of the last 17 months.
Note: This includes commercial and industrial facilities like hotels and office buildings, multi-family residential, as well as schools, hospitals and other institutions.
According to the AIA, there is an "approximate nine to twelve month lag time between architecture billings and construction spending" on non-residential construction. Even when positive, this index was not as strong as during the '90s - or during the bubble years of 2004 through 2006 - because the vacancy rates are still high for many CRE sectors. However, the readings last year do suggest some increase in CRE investment in 2014.


