 RSS Feed
 by Calculated Risk on 11/07/2012 08:43:00 PM
Wednesday, November 07, 2012
Thursday: Initial Unemployment Claims, Trade Deficit
I'll write something soon on the "fiscal slope". It is NOT a "cliff" ... and I suspect something will be worked out (the compromise will very likely include higher tax rates on high income individuals - so the agreement will probably have to happen after January 1st so some politicians can claim they didn't vote to increase taxes). No worries. Jan 1st is not a drop dead date.
Note: Jim Hamilton suggests breaking "the problem into smaller pieces", and Macro Man says the 'fiscal cliff may have to be downgraded to "road hump"'.
From Reuters: Greek government defies protests to approve more austerity
Greece's government voted by a razor thin margin on Thursday to approve an austerity package needed to unlock vital aid and avert bankruptcy ...The beatings will continue until morale improves.
The bill covering the bulk of 13.5 billion euros' ($17.2 billion) worth of belt-tightening measures is a precursor to the 2013 budget law, which the government is expected to push through on Sunday.
If it does, it is expected to unlock a 31.5 billion euro aid tranche from the International Monetary Fund and European Union that Greece needs to shore up its banks and pay off loans.
Thursday:
• At 8:30 AM, the initial weekly unemployment claims report will be released. The consensus is for claims to increase to 370 thousand from 363 thousand.
• Also at 8:30 AM, the Trade Balance report for September will be released by the Census Bureau. The consensus is for the U.S. trade deficit to increase to $45.4 billion in August, up from from $44.2 billion in August. Export activity to Europe will be closely watched due to economic weakness.
Once more question for the November economic prediction contest and four question for the November contest (Note: You can now use Facebook, Twitter, or OpenID to log in).
Fannie, Freddie, FHA REO inventory declines in Q3
by Calculated Risk on 11/07/2012 06:56:00 PM
First, from Fannie Mae: Fannie Mae Reports Net Income of $1.8 Billion for Third Quarter 2012
Fannie Mae (FNMA/OTC) today reported net income of $1.8 billion in the third quarter of 2012, compared with a net loss of $5.1 billion in the third quarter of 2011. For the first nine months of 2012, the company has reported $9.7 billion in net income. Lower credit-related expenses resulting from an increase in actual and expected home prices, higher sales prices on the company’s real-estate owned (“REO”) properties, and a decline in fair value losses contributed to the continued improvement in the company’s financial results.Here are some more details from the Fannie Mae's SEC filing 10-Q:
The company reported comprehensive income of $2.6 billion in the third quarter of 2012. The company is able to pay its third-quarter dividend of $2.9 billion to the Department of the Treasury without any draw under its senior preferred stock purchase agreement.
“We are seeing signs of sustained improvement in housing and our actions to support the housing recovery have generated strong financial results in 2012,” said Timothy J. Mayopoulos, president and chief executive officer.
Credit losses decreased in the third quarter and first nine months of 2012 compared with the third quarter and first nine months of 2011 primarily due to: (1) improved actual home prices and sales prices of our REO properties resulting from strong demand in markets with limited REO supply; and (2) lower volume of REO acquisitions due to the slow pace of foreclosures. The decrease in credit losses was partially offset by a decrease in amounts collected by us as a result of repurchase requests in the third quarter and first nine months of 2012 compared with the third quarter and first nine months of 2011. We expect our credit losses to remain high in 2012 relative to pre−housing crisis levels. We expect delays in foreclosures to continue for the remainder of 2012, which delays our realization of credit losses.Fannie sees rising prices and strong demand for REOs.
 Click on graph for larger image.
This graph shows the REO inventory for Fannie, Freddie and the FHA. This was the seventh straight quarterly decline in the "F's" REO inventory, and total "F" REO was down 12% from a year ago.
This is only a portion of the total REO. There is also REO for private-label MBS, FDIC-insured institutions, VA and more. REO has been declining for those categories too. (I'll have more on those categories soon).
Lawler on Freddie Mac Results
by Calculated Risk on 11/07/2012 03:49:00 PM
From economist Tom Lawler: Freddie Mac: GAAP Net Income $2.9 Billion in Q3, GAAP Net Worth $4.9 Billion at End of Quarter (no additional Treasury Draw); SF REO Down Again
Freddie Mac reported that its GAAP net income “attributable” to Freddie Mac last quarter was $2.9 billion, down just a tad from the previous quarter. GAAP net income “attributable” to common stockholders last quarter was $1.1 billion, with the difference reflecting the $1.8 billion “paid” to Treasury on its senior preferred stock holdings.
Freddie also reported “other comprehensive income” of $2.7 billion (mainly reflecting “spread-tightening” on its non-agency AFS securities), and that its GAAP net worth on September 30th was $4.9 billion, up from $1.1 billion in the previous quarter. As a result, Freddie’s regulator does not need to request another Treasury “draw.”
Freddie Mac said that its internal Freddie’s internal national home price index, which is based on repeat transactions of homes backed by mortgages owned or guaranteed by Freddie or Fannie with state value weights based on Freddie’s SF mortgage book, increased by 1.3% from June to September, and was up 4.3% from last September.
Freddie’s improved “GAAP” income this year vs. last year has been mainly attributable to lower credit losses – mainly lower provision for credit losses, though its REO operations expense is also down – driven by improving home prices. Here is a table showing Freddie’s December 2011 home price forecast (for it’s internal HPI) vs. “actuals” so far this year.
| Annualized Growth Rate, Freddie Mac Home Price Index | ||
|---|---|---|
| Dec. 2011 Forecast | "Actual" | |
| Q1/12 | -2.0% | 0.6% |
| Q2/12 | 1.5% | 4.9% |
| Q3/12 | -0.5% | 1.3% |
Freddie noted in it’s 10-Q that “(t)he decline in (REO) expense for the 2012 periods was primarily due to improving home prices in certain geographical areas with significant REO activity, which resulted in gains on disposition of properties as well as lower write-downs of single-family REO inventory.”
Beginning next year, Freddie Mac’s dividend payment on Treasury’s senior preferred stock will change in a fashion that makes it impossible for Freddie Mac (or Fannie Mae) to Here is an excerpt from Freddie’s 10-Q.
“We currently pay cash dividends to Treasury at an annual rate of 10%. On August 17, 2012, Freddie Mac, acting through FHFA, as Conservator, and Treasury entered into a third amendment to the Purchase Agreement, that, among other items, changed our dividend payments on the senior preferred stock. For each quarter from January 1, 2013 through and including December 31, 2017, the dividend payment will be the amount, if any, by which our net worth at the end of the immediately preceding fiscal quarter, less the applicable capital reserve amount, exceeds zero. The applicable capital reserve amount will be $3 billion for 2013 and will be reduced by $600 million each year thereafter until it reaches zero on January 1, 2018. For each quarter beginning January 1, 2018, the dividend payment will be the amount, if any, by which our net worth at the end of the immediately preceding fiscal quarter exceeds zero. If the calculation of the dividend payment for a quarter does not exceed zero, then no dividend will accrue or be payable for that quarter.”As Freddie noted, “(t)his effectively ends the circular practice of Treasury advancing funds to us to pay dividends back to Treasury, and “(a)s a result of this amendment, over the long term, our future profits will effectively be distributed to Treasury.” This change, of course, eliminates the possibility that the GSEs can re-build capital.
CR Note: Freddie's REO declined to 50,913 houses, down from 53,271 in Q2. I'll have more on REO when Fannie reports.
Bankruptcy Filings declined 14% in Fiscal 2012
by Calculated Risk on 11/07/2012 12:31:00 PM
From the US Court: Bankruptcy Filings Down in Fiscal Year 2012
Bankruptcy cases filed in federal courts for fiscal year 2012, the 12-month period ending September 30, 2012, totaled 1,261,140, down 14 percent from the 1,467,221 bankruptcy cases filed in FY 2011, according to statistics released today by the Administrative Office of the U.S. Courts.The number of filings for the quarter ending Sept 2012 were the lowest since 2008.
...
For the 12-month period ending September 30, 2012, business bankruptcy filings—those where the debtor is a corporation or partnership, or the debt is predominantly related to the operation of a business—totaled 42,008, down 16 percent from the 49,895 business filings reported in the 12-month period ending September 30, 2011.
Non-business bankruptcy filings totaled 1,219,132, down 14 percent from the 1,417,326 non-business bankruptcy filings in September 2011.
 Click on graph for larger image.
This graph shows the business and non-business bankruptcy filings by year since 1987.
Note: The peal in 2005 was due to the so-called "Bankruptcy Abuse Prevention and Consumer Protection Act of 2005". (a good example of Orwellian named legislation).
This is another indicator of less economic stress.
Hurricane Sandy: Impact on "Near-Term Economic Activity"
by Calculated Risk on 11/07/2012 09:49:00 AM
The economic data has already shown some impact from Hurricane Sandy, and we will see more over the next couple of months. As an example, auto sales were down in the Northeast at the end of October, home listings were down in New York and New Jersey in early November, and this morning the MBA reported mortgage applications were down sharply in those states.
Goldman Sachs analysts Sven Jari Stehn and Shuyan Wu tried to quantify the short term impact: The Effect of Hurricane Sandy on Near-Term Economic Activity
1. Employment dips and rebounds ... Both nonfarm payrolls and household employment typically fall one month after landfall and then rebound in the following two months. Our estimates suggest that the hit of Hurricane Sandy on November employment might be around 20,000 with a rebound in December and January. ...This will be something to keep in my mind as data is released over the next couple of months. Best wishes to all recovering from the hurricane.
2. ...as claims rise and fall slowly. Initial jobless claims typically rise over the first three weeks after landfall before gradually falling back over the subsequent two months. Our analysis suggests that Hurricane Sandy might push initial jobless claims up by around 14,000 in the week ended November 17 and that it might take until late December for the distortion to disappear entirely from the claims report.
3. Small effects on housing and manufacturing. ... we find that housing starts tend to rise only by a few thousand units in the aftermath of storms as rebuilding of damaged houses begins. Regional manufacturing surveys typically weaken following hurricanes, but the effect is small. Our results would suggest that manufacturing surveys in the affected states—the Empire and Philadelphia Fed indexes—might weaken temporarily by a point or two in December due to Hurricane Sandy, but this is likely to be hard to distinguish from statistical noise.
...
[W]e conclude that we should expect a notable hit to labor market indicators but only small effects on regional manufacturing surveys and construction activity over the next couple of months.
MBA: Hurricane Sandy Leads to Decrease in Mortgage Applications
by Calculated Risk on 11/07/2012 07:02:00 AM
From the MBA: Storm Leads to Decrease in Mortgage Applications
The Refinance Index ... decreased 5 percent from the previous week. The Refinance Index has declined for five straight weeks and is at its lowest level since the end of August. The seasonally adjusted Purchase Index decreased 5 percent from one week earlier.Some of this decline in activity was related to Hurricane Sandy.
“Last week’s storm had a significant impact on application volumes on the East Coast,” said Mike Fratantoni, MBA’s Vice President of Research and Economics. “Applications fell more than 60 percent compared to the prior week in New Jersey, almost 50 percent in New York and nearly 40 percent in Connecticut. Other East Coast states also saw declines over the week, while many states in other parts of the country had increases in application volumes.”
The average contract interest rate for 30-year fixed-rate mortgages with conforming loan balances ($417,500 or less) decreased to 3.61 percent from 3.65 percent, with points increasing to 0.45 from 0.39 (including the origination fee) for 80 percent loan-to-value ratio (LTV) loans.
 Click on graph for larger image.
This graph shows the MBA mortgage purchase index. The purchase index has been mostly moving sideways over the last two years.
As Fratantoni noted, some states in the Northeast had a sharp decline in activity: "Applications fell more than 60 percent compared to the prior week in New Jersey, almost 50 percent in New York and nearly 40 percent in Connecticut." Most of those areas will bounce back fairly quickly.
Tuesday, November 06, 2012
Election Day
by Calculated Risk on 11/06/2012 05:09:00 PM
A new post for comments and a few election resources:
The WSJ is free online tonight.
CNBC: National election results
From the WaPo: Coming at 6 p.m. ET: Live election results for each state and county
Times polls close in a few key states:
7 PM ET: Polls close in Virginia.
7:30 PM ET: Polls close in Ohio and North Carolina.
8:00 PM: Polls close in Florida and New Hampshire.
9:00 PM: Polls close in Wisconsin and Colorado.
10:00 PM: Polls close in Nevada and Iowa.
Note: I'll add more resources based on comments ...
UPDATE FROM Nemo:
Intrade
Betfair (Take reciprocals of the back/lay numbers to get probabilities)
Profoundly strange (Betting market manipulation? at Self Evident )
UPDATE 2:
Nate Silver's FiveThirtyEight
Ezra Klein's Wonkblog
Lawler: Table of Short Sales and Foreclosures for Selected Cities in September
by Calculated Risk on 11/06/2012 03:20:00 PM
Economist Tom Lawler sent me this today with this note: "I found a few more realtor reports on distressed sales shares for the third quarter."
Previous comments: A couple of clear patterns have developed:
1) There has been a shift from foreclosures to short sales. Foreclosures are down and short sales are up in most areas. For two cities, Las Vegas and Reno, short sales are now three times foreclosures, although that is related to the new foreclosure rules in Nevada. Both Phoenix and Sacramento had over twice as many short sales as foreclosures. A year ago, there were many more foreclosures than short sales in most areas. Minneapolis is an exception with more foreclosures than short sales.
2) The overall percent of distressed sales (combined foreclosures and short sales) are down year-over-year almost everywhere. Chicago is essentially unchanged from a year ago.
And previously from Lawler:
Note that the distressed sales shares in the below table are based on MLS data, and often based on certain “fields” or comments in the MLS files, and some have questioned the accuracy of the data. Some MLS/associations only report on overall “distressed” sales.
| Short Sales Share | Foreclosure Sales Share | Total "Distressed" Share | ||||
|---|---|---|---|---|---|---|
| 12-Sep | 11-Sep | 12-Sep | 11-Sep | 12-Sep | 11-Sep | |
| Las Vegas | 44.8% | 23.5% | 13.6% | 49.4% | 58.4% | 72.9% |
| Reno | 41.0% | 29.0% | 12.0% | 38.0% | 53.0% | 67.0% |
| Phoenix | 27.0% | 27.0% | 12.9% | 37.1% | 39.9% | 64.1% |
| Sacramento | 35.4% | 26.1% | 15.4% | 37.9% | 50.8% | 64.0% |
| Minneapolis | 10.1% | 13.1% | 25.2% | 32.9% | 35.3% | 46.0% |
| Mid-Atlantic (MRIS) | 12.4% | 12.6% | 9.4% | 14.4% | 21.8% | 27.0% |
| Orlando | 28.0% | 25.6% | 24.0% | 35.9% | 52.0% | 61.5% |
| California (DQ)* | 27.0% | 23.8% | 17.7% | 33.8% | 44.7% | 57.6% |
| California (CAR) | 24.3% | 21.0% | 12.3% | 27.5% | 37.0% | 48.7% |
| Lee County, FL*** | 21.4% | 21.4% | 15.9% | 31.5% | 37.3% | 52.9% |
| Colorado** | 6.5% | 6.1% | 12.3% | 19.8% | 18.7% | 25.8% |
| King Co. WA** | 16.0% | 10.0% | 10.0% | 22.0% | 25.0% | 32.0% |
| Hampton Roads VA | 25.4% | 31.6% | ||||
| Miami-Dade | 47.4% | 59.6% | ||||
| Northeast Florida | 44.7% | 49.0% | ||||
| Chicago | 40.6% | 40.0% | ||||
| Rhode Island | 23.9% | 28.9% | ||||
| Miami-Dade | 47.4% | 59.0% | ||||
| Charlotte | 15.3% | 20.9% | ||||
| Columbus OH** | 25.2% | 30.5% | ||||
| Memphis* | 26.3% | 30.8% | ||||
| Birmingham AL | 26.6% | 31.8% | ||||
| Houston | 16.1% | 19.4% | ||||
| *share of existing home sales, based on property records | ||||||
| **Third Quarter | ||||||
| *** SF only | ||||||
CoreLogic: House Price Index declined seasonally in September, Up 5.0% Year-over-year
by Calculated Risk on 11/06/2012 11:30:00 AM
Notes: This CoreLogic House Price Index report is for September. The recent Case-Shiller index release was for August. Case-Shiller is currently the most followed house price index, however CoreLogic is used by the Federal Reserve and is followed by many analysts. The CoreLogic HPI is a three month weighted average and is not seasonally adjusted (NSA).
From CoreLogic: CoreLogic® September Home Price Index Rises 5 Percent Year-Over-Year
Home prices nationwide, including distressed sales, increased on a year-over-year basis by 5 percent in September 2012 compared to September 2011. This change represents the biggest increase since July 2006 and the seventh consecutive increase in home prices nationally on a year-over-year basis. On a month-over-month basis, including distressed sales, home prices decreased by 0.3 percent in September 2012 compared to August 2012.
...
Excluding distressed sales, home prices nationwide also increased on a year-over-year basis by 5 percent in September 2012 compared to September 2011. On a month-over-month basis excluding distressed sales, home prices increased 0.5 percent in September 2012 compared to August 2012, the seventh consecutive month-over-month increase. Distressed sales include short sales and real estate owned (REO) transactions.
The CoreLogic Pending HPI indicates that October 2012 home prices, including distressed sales, are expected to rise by 5.7 percent on a year-over-year basis from October 2011 and fall by 0.5 percent on a month-over-month basis from September 2012 as sales exhibit a seasonal slowdown going into the winter.
...
“Home price improvement nationally continues to outpace our expectations, growing 5 percent year-over-year in September, the best showing since July 2006,” said Mark Fleming, chief economist for CoreLogic. “While prices on a month-over-month basis are declining, as expected in the housing off-season, most states are exhibiting price increases. Gains are particularly large in former housing bubble states and energy-industry concentrated states."
 Click on graph for larger image.
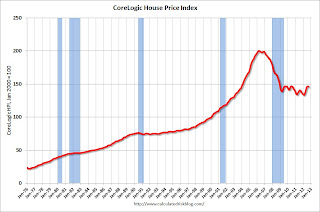
 This graph shows the national CoreLogic HPI data since 1976. January 2000 = 100.
The index was down 0.3% in September, and is up 5.0% over the last year.
The index is off 26.9% from the peak - and is up 9.7% from the post-bubble low set in February (the index is NSA, so some of the increase is seasonal).
 The second graph is from CoreLogic. The year-over-year comparison has been positive for seven consecutive months suggesting house prices bottomed earlier this year on a national basis (the bump in 2010 was related to the tax credit).
This is the largest year-over-year increase since 2006.
Since this index is not seasonally adjusted, it was expected to decline on a month-to-month basis in September, and will probably stay negative on a month-to-month basis until the March 2013 report is released. The key for the next several months will be to watch the year-over-year change.
BLS: Job Openings "essentially unchanged" in September, Up year-over-year
by Calculated Risk on 11/06/2012 10:00:00 AM
From the BLS: Job Openings and Labor Turnover Summary
The number of job openings in September was 3.6 million, essentially unchanged from August.The following graph shows job openings (yellow line), hires (dark blue), Layoff, Discharges and other (red column), and Quits (light blue column) from the JOLTS.
...
The level of total nonfarm job openings in September was up from 2.4 million at the end of the recession in June 2009.
...
In September, the quits rate was little changed for total nonfarm, total private, and government. The number of quits was 2.0 million in September compared to 1.8 million at the end of the recession in June 2009.
This series started in December 2000.
Note: The difference between JOLTS hires and separations is similar to the CES (payroll survey) net jobs headline numbers. This report is for September, the most recent employment report was for August.
 Click on graph for larger image.
Notice that hires (dark blue) and total separations (red and light blue columns stacked) are pretty close each month. This is a measure of turnover. When the blue line is above the two stacked columns, the economy is adding net jobs - when it is below the columns, the economy is losing jobs.
Jobs openings decreased in September to 3.561 million, down slightly from 3.661 million in August. The number of job openings (yellow) has generally been trending up, and openings are only up about 2% year-over-year compared to September 2011.
Quits decreased in September, and quits are down slightly year-over-year. These are voluntary separations. (see light blue columns at bottom of graph for trend for "quits").
The trend suggests a gradually improving labor market.


