 RSS Feed
 by Calculated Risk on 4/13/2012 11:54:00 AM
Friday, April 13, 2012
Key Measures of Inflation in March
Earlier today the BLS reported:
The Consumer Price Index for All Urban Consumers (CPI-U) increased 0.3 percent in March on a seasonally adjusted basis ... The index for all items less food and energy rose 0.2 percent in MarchThe Cleveland Fed released the median CPI and the trimmed-mean CPI this morning:
According to the Federal Reserve Bank of Cleveland, the median Consumer Price Index rose 0.2% (2.2% annualized rate) in March. The 16% trimmed-mean Consumer Price Index increased 0.2% (2.7% annualized rate) during the month.Note: The Cleveland Fed has the median CPI details for March here.
...
Earlier today, the BLS reported that the seasonally adjusted CPI for all urban consumers increased 0.3% (3.5% annualized rate) in March. The CPI less food and energy increased 0.2% (2.8% annualized rate) on a seasonally adjusted basis.
 Click on graph for larger image.
This graph shows the year-over-year change for these four key measures of inflation. On a year-over-year basis, the median CPI rose 2.4%, the trimmed-mean CPI rose 2.4%, and core CPI rose 2.3%. Core PCE is for February and increased 1.9% year-over-year.
These measures show inflation on a year-over-year basis is mostly still above the Fed's 2% target.
Consumer Sentiment declines slightly in April to 75.7
by Calculated Risk on 4/13/2012 09:55:00 AM

Click on graph for larger image.
The preliminary Reuters / University of Michigan consumer sentiment index for April declined slightly to 75.7, down from the final March reading of 76.2.
This was below the consensus forecast of 76.2. Overall sentiment is still fairly weak - probably due to a combination of the high unemployment rate, high gasoline prices and sluggish economy - however sentiment has rebounded from the decline last summer and is up from 69.8 in April 2011.
BLS: CPI increases 0.3% in March
by Calculated Risk on 4/13/2012 08:33:00 AM
The Consumer Price Index for All Urban Consumers (CPI-U) increased 0.3 percent in March on a seasonally adjusted basis, the U.S. Bureau of Labor Statistics reported today. Over the last 12 months, the all items index increased 2.7 percent before seasonal adjustment.I'll post a graph later today after the Cleveland Fed releases the median and trimmed-mean CPI. This was at the consensus forecast of a 0.3% increase in CPI and a 0.2% increase in core CPI.
...
The gasoline index continued to rise, more than offsetting a decline in the household energy index and leading to a 0.9 percent increase in the energy index. The food index rose 0.2 percent as the index for meats, poultry, fish, and eggs increased notably.
The index for all items less food and energy rose 0.2 percent in March after increasing 0.1 percent in February.
Thursday, April 12, 2012
Freddie Mac: 15-Year Fixed-Rate Mortgage Hits New All-Time Record
by Calculated Risk on 4/12/2012 08:52:00 PM
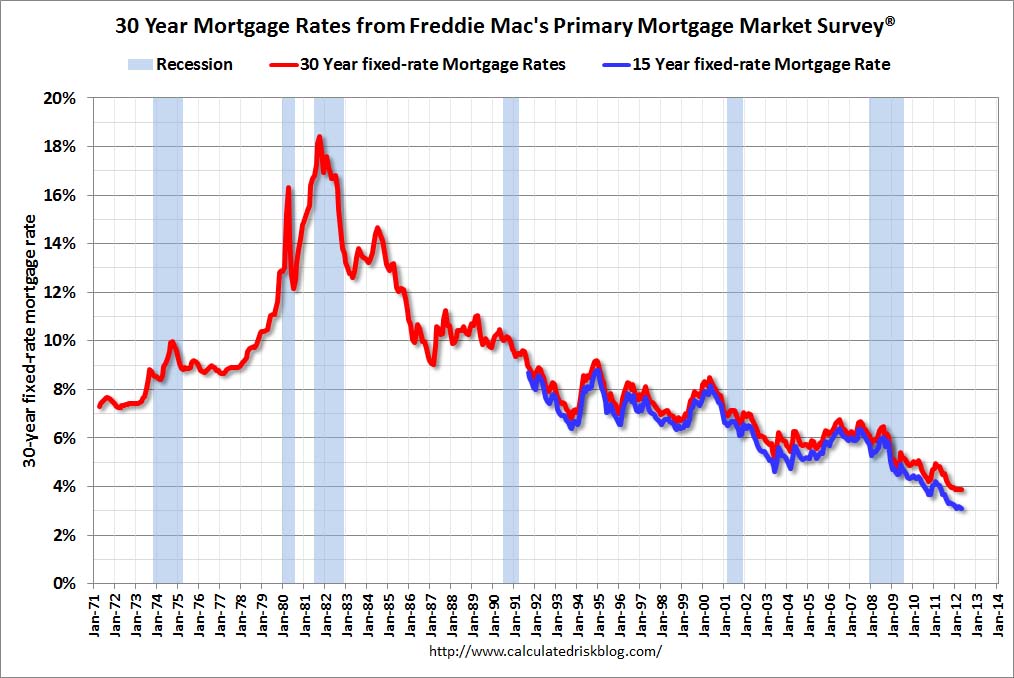
From Freddie Mac: 15-Year Fixed-Rate Mortgage Hits New All-Time Record Low
Freddie Mac (OTC: FMCC) today released the results of its Primary Mortgage Market Survey® (PMMS®), showing average fixed mortgage rates declining for the third consecutive week ... The 30-year fixed averaged just above its record low while the 15-year fixed averaged a new all-time record low of 3.11 percent breaking its previous low of 3.13 percent on March 8, 2012.
...
30-year fixed-rate mortgage (FRM) averaged 3.88 percent with an average 0.7 point for the week ending April 12, 2012, down from last week when it averaged 3.98 percent. Last year at this time, the 30-year FRM averaged 4.91 percent.
 Click on graph for larger image.
This graph shows the 15 and 30 year fixed rates from the Freddie Mac survey. The Primary Mortgage Market Survey® started in 1971 (15 year in 1991).
This reminds me: I had an 11% assumable mortgage on a house I was selling in the early '80s, and the "low" mortgage rate was a strong selling feature!
Analyst: Rising Rents "could tip the cost of housing in favor of ownership"
by Calculated Risk on 4/12/2012 04:01:00 PM
This is from real estate analyst G.U. Krueger in the O.C. Register: Analyst: Rent hikes turning renters into buyers
USC’s 2012 Casden Multifamily Forecast predicts two more golden years of apartment Southern California rent growth. The sky seems to be the limit for ecstatic landlords right now.
However, emphatic landlords raising rents with gusto could tip the cost of housing in favor of ownership while at the same time a supply response (more construction) could keep vacancy rates from dropping much further.
...
The “witching hour” for apartment rents may not be far off. The relative cost between rentals and ownership advances in favor of home purchases.
 Click on graph for larger image.
CR: The price-to-rent ratio is close to normal (see: Real House Prices and Price-to-Rent Ratio decline to late '90s Levels )
As G.U. notes, rising rents and falling house prices will eventually tip the balance back to ownership.
Sacramento: Lowest percentage of Distressed House Sales in years
by Calculated Risk on 4/12/2012 01:21:00 PM
I've been following the Sacramento market to look for changes in the mix of house sales in a distressed area over time (conventional, REOs, and short sales). The Sacramento Association of REALTORS® started breaking out REOs in May 2008, and short sales in June 2009.
So far there has been a shift from REO to short sales, and the percentage of distressed sales has been declining year-over-year. This data would suggest improvement, however we do not know the impact of the mortgage settlement yet (the court signed off on the agreement last week).
In March 2012, 59.6% of all resales (single family homes and condos) were distressed sales. This was down from 70.7% in March 2011, and the lowest percentage of distressed sales since Sacramento started breaking out the data in May 2008. Still almost 60% distressed is extremely high!
Here are the statistics.
 Click on graph for larger image.
This graph shows the percent of REO sales, short sales and conventional sales. There is a seasonal pattern for conventional sales (stronger in the spring and summer), and distressed sales happen all year - so the percentage of distressed sales decreases every summer and the increases in the fall and winter.
There will be probably be more foreclosures following the mortgage servicer settlement, but this is still a sharp increase in conventional sales. In another change, short sales are almost at the same level as REOs.
Total sales were down 2.9% compared to March 2011, but conventional sales were up 34% year-over-year. Active Listing Inventory declined 59.5% from last March, and total inventory, including "short sale contingent", was off 31% year-over-year.
Cash buyers accounted for 32.0% of all sales (frequently investors), and median prices were unchanged from last March (mean prices were up 2.8%).
I've been hoping this data would help determine when the market is improving. Unfortunately the mortgage settlement is a big unknown. Otherwise this would be considered progress, although the market is still in distress.
A few key points:
• Inventory is off sharply year-over-year even including "short sale contingent" listings.
• Conventional sales are up sharply (up 34% from March 2011).
• The median sales price is unchanged from last year (probably because of fewer REOs), and the mean price is up 2.8%.
• This is the lowest percentage of distressed sales since the Sacramento Association started breaking out distressed sales.
We are seeing similar patterns in other distressed areas. This will be interesting to watch over the next few months to see the impact of the mortgage settlement.
Strategic Defaulters vs. Strategic Modifiers
by Calculated Risk on 4/12/2012 11:42:00 AM
In FHFA acting director Ed DeMarco's speech on Tuesday, he discussed the risk of "strategic modifiers". Felix Salmon and I have been discussing this via email. Here is Salmon's post this morning: Ed DeMarco and the spectre of strategic modifiers
A couple of definitions: A "strategic defaulter" is a borrower who is underwater on their home mortgage (they owe more than the house is worth), and who is willing to walk away from their home, even though they have the capacity to make the payments. Strategic defaulters intend to go to foreclosure - and probably will - even if offered a modification.
A "strategic modifier" is a borrower who intends to stay in their home, but is willing to miss some payments to qualify for a loan modification.
Salmon writes:
I don’t believe that the problem of strategic modifiers (over and above the problem of strategic defaulters) is likely to be huge. One reason is that I’ve been writing about the upside of strategic default for a long time, and it really hasn’t caught on, outside a few second homes and the like. Strategic default is not something that Americans like to do, and one of the main reasons is that they really care about their credit rating. Even if a strategic modifier keeps her house, she’ll suffer the same hit to her credit rating as a strategic defaulter would. And people don’t like that at all.I disagree somewhat. First, someone who goes to foreclosure will take a much larger hit to their credit than someone who misses a few payments. So there is a difference - "strategic modifiers" will not take the same credit hit as "strategic defaulters".
Second, I think most people feel an obligation to pay their mortgage, if they can, even if they owe more than their home is worth. But some of those same people will be willing to stand in the "free money" line (principal reduction), even if that means missing a few payments.
So, depending on the guidelines, I think there will be a higher percentage of "strategic modifiers" than "strategic defaulters".
Salmon concludes:
[L]et’s try principal reductions in the real world, and see what happens. If they turn out to be incredibly expensive, then we can revisit the issue. But my guess for the most likely outcome is not a wave of strategic modifiers. Rather, it’s that the program turns out to be much like all other government attempts to deal with underwater borrowers: a damp squib where very little happens at all.I think some sort of principal reduction program will be announced, with tight guidelines, but I agree with Salmon, I expect the program will have little impact.
Trade Deficit declined in February to $46 Billion
by Calculated Risk on 4/12/2012 09:09:00 AM
The Department of Commerce reported:
[T]otal February exports of $181.2 billion and imports of $227.2 billion resulted in a goods and services deficit of $46.0 billion, down from $52.5 billion in January, revised. February exports were $0.2 billion more than January exports of $180.9 billion. February imports were $6.3 billion less than January imports of $233.4 billionThe trade deficit was well below the consensus forecast of $51.7 billion.
The first graph shows the monthly U.S. exports and imports in dollars through January 2012.
 Click on graph for larger image.
Exports increased slightly in February, while imports decreased sharply. Exports are well above the pre-recession peak and up 9% compared to February 2011; imports are near the pre-recession high and imports are up about 8% compared to February 2011.
The second graph shows the U.S. trade deficit, with and without petroleum, through February.
 The blue line is the total deficit, and the black line is the petroleum deficit, and the red line is the trade deficit ex-petroleum products.
Oil averaged $103.63 per barrel in February, down slightly from January. The decline in imports was a combination of less petroleum imports and less imports from China.
Exports to the European Union were $22.5 billion in February, up from $20.0 billion in February 2011.
Weekly Initial Unemployment Claims increase to 380,000
by Calculated Risk on 4/12/2012 08:30:00 AM
The DOL reports:
In the week ending April 7, the advance figure for seasonally adjusted initial claims was 380,000, an increase of 13,000 from the previous week's revised figure of 367,000. The 4-week moving average was 368,500, an increase of 4,250 from the previous week's revised average of 364,250.The previous week was revised up to 367,000 from 357,000.
The following graph shows the 4-week moving average of weekly claims since January 2000.
 Click on graph for larger image.
The dashed line on the graph is the current 4-week average. The four-week average of weekly unemployment claims increased to 368,500.
The 4-week moving average has been moving sideways at this level for about two months.
And here is a long term graph of weekly claims:

This is the highest level for weekly claims since January.
RealtyTrac: Q1 2012 Foreclosure Activity Lowest Since Q4 2007
by Calculated Risk on 4/12/2012 12:01:00 AM
From RealtyTrac: Q1 2012 Foreclosure Activity Lowest Since Q4 2007
RealtyTrac ... today released its U.S. Foreclosure Market Report™ for the first quarter of 2012, which shows foreclosure filings — default notices, scheduled auctions and bank repossessions — were reported on 572,928 properties during the quarter, down 2 percent from the previous quarter and down 16 percent from the first quarter of 2011.The mortgage settlement was just signed off last week, so we really have to wait until April or May to see the impact of the settlement. Obviously RealtyTrac thinks the dam is about to burst and the market will be flooded again with foreclosures. My feeling is this will have more of an impact on the judicial states because of the huge backlog in those states.
The first quarter total was the lowest quarterly total since the fourth quarter of 2007, when 527,740 properties with foreclosure filings were reported.
Foreclosure filings were reported on 198,853 U.S. properties in March, a 4 percent decrease from February and a 17 percent decrease from March 2011. March’s total was the lowest monthly total since July 2007, and also the first monthly total below 200,000 since July 2007.
“The low foreclosure numbers in the first quarter are not an indication that the massive reservoir of distressed properties built up over the past few years has somehow miraculously evaporated,” said Brandon Moore, chief executive officer of RealtyTrac. “There are hairline cracks in the dam, evident in the sizable foreclosure activity increases in judicial foreclosure states over the past several months, along with an increase in foreclosure starts in many judicial and non-judicial states in March. The dam may not burst in the next 30 to 45 days, but it will eventually burst, and everyone downstream should be prepared for that to happen — both in terms of new foreclosure activity and new short sale activity.”
...
The nationwide decrease in foreclosure activity was caused primarily by decreasing activity in states that use the non-judicial foreclosure process. These 24 states combined, along with the District of Columbia, had 329,854 properties with foreclosure filings during the quarter, more than half the national total — but a decrease of 8 percent from the previous quarter and a decrease of 28 percent from the first quarter of 2011.
...
Meanwhile foreclosure activity increased in states that primarily use the judicial foreclosure process. These 26 states combined accounted for 243,074 properties with foreclosure filings during the quarter, an increase of 8 percent from the previous quarter and an increase of 10 percent from the first quarter of 2011.
Judicial states posting some of the biggest year-over-year increases in foreclosure activity in the first quarter included Indiana (up 45 percent), Connecticut (up 38 percent), Massachusetts (up 26 percent), Florida (up 26 percent), South Carolina (up 26 percent), and Pennsylvania (up 23 percent).


