 RSS Feed
 by Calculated Risk on 10/30/2010 04:45:00 PM
Saturday, October 30, 2010
Residential Investment declines to new low as Percent of GDP
A couple more graphs ...
 Click on graph for larger image in new window.
I'll break down Residential Investment (RI) into components after the GDP details are released this coming week. Note: Residential investment (RI) includes new single family structures, multifamily structures, home improvement, broker's commissions, and a few minor categories.
It is interesting to note that RI as a percent of GDP has declined to a post war low of 2.22%. Some people have asked how could a sector that only accounts for 2.2% of GDP be so important? The answer is that usually RI accounts for a large percentage of the employment and GDP growth in the first year or so of a recovery. Not this time.
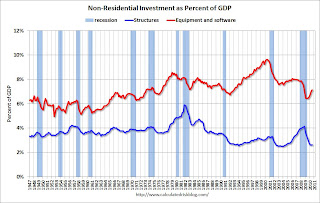 The second graph shows non-residential investment in structures and equipment and software.
Equipment and software investment has been booming, and non-residential investment in structures is near a record low.
Investment Contribution to GDP: Leading and Lagging Sectors
by Calculated Risk on 10/30/2010 12:30:00 PM
By request, the following graph is an update to: The Investment Slump in Q2 2009
The following graph shows the rolling 4 quarter contribution to GDP from residential investment, equipment and software, and nonresidential structures. This is important to follow because residential investment tends to lead the economy, equipment and software is generally coincident, and nonresidential structure investment trails the economy.
For the following graph, red is residential, green is equipment and software, and blue is investment in non-residential structures. The usual pattern - both into and out of recessions is - red, green, blue.
 Click on graph for larger image in new window.
Residential Investment (RI) made a negative contribution to GDP in Q3 2010, and the four quarter rolling average is negative again.
RI was negatively impacted by the slowdown in new home construction, and also because the number of existing home sold fell sharply (real estate commissions are included in RI).
Equipment and software investment has made a significant positive contribution to GDP for five straight quarters (it is coincident).
The contribution from nonresidential investment in structures was slightly positive in Q3. The details will be released next week, but I expect that oil and gas investment made a positive contribution, and hotels, malls and office investment were negative again. As usual nonresidential investment in structures is the last sector to recover.
The key leading sector - residential investment - has lagged this recovery because of the huge overhang of existing inventory. Usually RI is a strong contributor to GDP growth and employment in the early stages of a recovery, but not this time - and this is a key reason why the recovery has been sluggish so far.
Restaurant Index shows expansion in September
by Calculated Risk on 10/30/2010 08:45:00 AM
This is one of several industry specific indexes I track each month.
 Click on graph for larger image in new window.
Unfortunately the data for this index only goes back to 2002.
Note: Any reading above 100 shows expansion for this index.
From the National Restaurant Association (NRA): Restaurant Industry Outlook Improved in September as Restaurant Performance Index Rose Above 100 for First Time in Five Months
Driven by improving same-store sales and customer traffic levels, as well as growing optimism among restaurant operators, the outlook for the restaurant industry improved in September. The National Restaurant Association’s Restaurant Performance Index (RPI) – a monthly composite index that tracks the health of and outlook for the U.S. restaurant industry – stood at 100.3 in September, up a solid 0.8 percent from its August level. In addition, the RPI rose above 100 for the first time in five months, which signifies expansion in the index of key industry indicators.Restraurants are a discretionary expense, and this slight expansion is a little bit of good news.
“The RPI’s solid gain in September was the result of broad-based improvements among both the current situation and forward-looking indicators,” said Hudson Riehle, senior vice president of the Research and Knowledge Group for the National Restaurant Association. “Restaurant operators reported positive same-store sales and customer traffic levels for the first time in six months, which propelled the RPI’s Current Situation Index to its highest level in nearly three years.”
...
Restaurant operators reported a net increase in same-store sales for the first time in six months in September. ... Restaurant operators also reported a slight uptick in customer traffic levels in September.emphasis added
Friday, October 29, 2010
Commercial Real Estate: "Normal market conditions years away"
by Calculated Risk on 10/29/2010 10:03:00 PM
From Buck Wargo at the Las Vegas Sun: Commercial real estate’s slide likely at an end
The commercial real estate market led by the office sector appears to have halted its slide ... analysts said.It is possible the office vacancy rate has peaked - or is near the peak as the the Reis vacancy data suggests - but it will take a long time to absorb all the excess office space. And that means non-residential investment in office buildings will be low for some time.
...
With little construction and the demand for space outpacing those who are giving it up, it appears the office market isn’t going to worsen, [Jake Joyce, a project manager with Applied Analysis] said.
“While it’s easy to latch on to even the smallest bright spot, the return to more normal market conditions is years away, but must start somewhere,” Joyce said.
But you do have to start somewhere ...
Real GDP Growth and the Unemployment Rate
by Calculated Risk on 10/29/2010 04:36:00 PM
Here is an excerpt from a previous post earlier this month and his probably worth repeating after the GDP report this morning. This relationship suggests the unemployment will rise with only 2% real GDP growth:
 Click on graph for larger image.
Here is an update on a version of Okun's Law. This graph shows the annual change in real GDP (x-axis) vs. the annual change in the unemployment rate (y-axis).
Note: For this graph I used a rolling four quarter change - so all the data points are not independent. However - remember - this "law" is really just a guide.
The following table summarizes several scenarios over the next year (starting from the current 9.6% unemployment rate):
| Real GDP Growth | Unemployment Rate in One Year |
|---|---|
| 0.0% | 11.0% |
| 1.0% | 10.5% |
| 2.0% | 10.0% |
| 3.0% | 9.6% |
| 4.0% | 9.1% |
| 5.0% | 8.7% |
I expected a sluggish recovery in 2010, so I thought the unemployment rate would stay elevated throughout 2010 (that was correct).
Going forward, I think the recovery will stay sluggish and choppy for some time and I'd guess the unemployment rate will tick up in the short term and still be above 9% later next year. You can see why those expecting 1% to 2% growth next year (like Goldman Sachs) are expecting the unemployment rate to be close to 10%.
In general, the U.S. economy needs to grow faster than a 3% real rate to reduce the unemployment - and there is no evidence yet of a pickup in growth.
Real GDP: Still 0.8% below pre-recession levels
by Calculated Risk on 10/29/2010 01:06:00 PM
Real GDP is 0.8% below the pre-recession peak, so real GDP would have to grow at a 3.1% annualized pace in Q4 for the economy to be back at the pre-recession peak.
That is unlikely since growth in personal consumption expenditures (PCE) will probably slow in Q4, and the contribution from the change in private inventories will likely be much smaller or negative in Q4.
Probably the earliest the economy will be back to pre-recession levels for GDP would be in Q1 2011 and that requires a 1.6% annualized growth rate over the next two quarters. It might even take until Q2 2011 (my current forecast).
Note: The following graphs are all constructed as a percent of the peak in each indicator. This shows when the indicator has bottomed - and when the indicator has returned to the level of the previous peak. If the indicator is at a new peak, the value is 100%.
 Click on graph for larger image in new window.
This graph is for real GDP through Q3 2010.
Real GDP is still 0.8% below the pre-recession peak.
Based on the June FOMC forecasts, real GDP would be close or above the pre-recession peak by now. So clearly those forecasts will be revised down next week.
And GDP has performed better than other indictors.
 The second graph is for real personal income less transfer payments (also released today for Q3 as part of the GDP report).
Real personal income less transfer payments is still 5.5% below the pre-recession peak. Much of the growth in PCE over the last year has come from transfer payments - this includes people taking Social Security early, extended unemployment benefits, and other assistance programs - and it will be some time before this indicator returns to pre-recession levels.
And two more graphs to show two key monthly indicators:
 This graph is for industrial production through Septmember.
Industrial production has been one of the stronger performing sectors because of inventory restocking and some growth in exports. However industrial production is still 7.5% below the pre-recession peak, and it appears export growth has slowed, and the inventory cycle is almost over.
One of the surprises in the GDP report today was the strong contribution from changes in private inventories. That will probably slow over the next few quarters - and may even turn negative. So it will probably be some time before industrial production returns to pre-recession levels.
 The final graph is for employment. This is similar to the graph I post every month comparing percent payroll jobs lost in several recessions.
Payroll employment is still 5.6% below the pre-recession peak. And with below trend GDP growth, payroll employment growth will likely remain sluggish.
Chicago PMI increases, Consumer Sentiment weak
by Calculated Risk on 10/29/2010 09:55:00 AM
Two stories ...
From the Institute for Supply Management – Chicago: The overall index increased to 60.6 vs 60.4. Note: any number above 50 shows expansion. Employment index increased to 54.6 from 53.4 in September. The new orders index increased to 65.0 from 61.4.
Overall this was a positive report. The national ISM manufacturing index will be released on Monday.
From MarketWatch: Consumer sentiment falls in October to 67.7
 Click on graph for larger image in new window.
This was a big story in July when consumer sentiment collapsed. Sentiment in October was slightly below the level in July - and this is the lowest level since late 2009.
Consumer sentiment is a coincident indicator and reflects the weak economy.
Q3 Advance Report: Real Annualized GDP Grew at 2.0%
by Calculated Risk on 10/29/2010 08:30:00 AM
Real gross domestic product -- the output of goods and services produced by labor and property located in the United States -- increased at an annual rate of 2.0 percent in the third quarter of 2010, (that is, from the second quarter to the third quarter), according to the "advance" estimate released by the Bureau of Economic Analysis.
 Click on graph for larger image in new window.
This graph shows the quarterly GDP growth (at an annual rate) for the last 30 years. The dashed line is the median growth rate of 3.05%. The current recovery is very weak - the 2nd half slowdown continues.
A few key numbers:
Without the boost in inventories, GDP would have been barely positive in Q3.
This was a little stronger than expected, and PCE will probably slow over the next couple of quarters.
As expected, residential investment declined sharply after the Q2 tax credit boost.
Overall this was a weak report and will not derail QE2 next wednesday (further easing from the Fed).
Thursday, October 28, 2010
Foreclosure-Gate: Title Insurers Drop Demands
by Calculated Risk on 10/28/2010 09:49:00 PM
From Elizabeth Razzi at the WaPo: Title insurers drop demands on mortgage lenders in foreclosure cases
Three major title insurance companies - First American Financial, Old Republic International and Stewart Information Services - told Wall Street analysts in conference calls Thursday that they had decided not to demand written indemnifications from lenders re-selling foreclosed homes. Combined, the three companies account for 52 percent of the title insurance market.This is means that the buyers of REO (lender Real Estate Owned) will be able to obtain title insurance, and that the new owner can sell the property. There was some concern that buyers would shy away from REOs.
House Prices have corrected to what year?
by Calculated Risk on 10/28/2010 05:45:00 PM
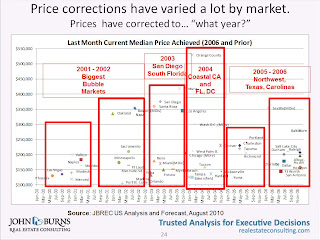
Housing consultant John Burns presented this slide as part of the UCLA Anderson Forecast this week:
 Click on graph for larger image in new window.
John Burns used median prices for this slide. It shows that the "biggest bubble markets" are back to 2000 to 2002 median prices, whereas some areas are still at 2006 prices.
And here is a timeline for the 20 Case-Shiller cities:
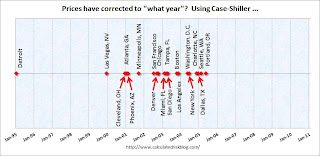 There is no y-axis because this is based on a price index (not median prices).
Detroit is back to 1995 prices, and some cities like Dallas, Portland and Seattle are only back to 2005 or 2006 prices (the bubble arrived later in the Northwest).


