 RSS Feed
 by Calculated Risk on 10/24/2010 09:00:00 AM
Sunday, October 24, 2010
Summary for Week ending Oct 23rd
A summary of last week - mostly in graphs.
With all the Fed speeches last week it is clear that the countdown to QE2 continues (QE2: quantitative easing, 2nd round). Also "put-backs" of "soured" mortgages (repurchase demands) is picking up steam, see:
From the Fed: Industrial production and Capacity Utilization
Industrial production decreased 0.2 percent in September after having increased 0.2 percent in August. ... The capacity utilization rate for total industry edged down to 74.7 percent ...
 Click on graph for larger image in new window.
This graph shows Capacity Utilization. This series is up 9.5% from the record low set in June 2009 (the series starts in 1967).
Capacity utilization at 74.7% is still far below normal - and well below the pre-recession levels of 81.2% in November 2007.
 The second graph shows industrial production since 1967.
Industrial production declined slightly in September, and production is still 7.5% below the pre-recession levels at the end of 2007.
This is below consensus expectations of a 0.2% increase in Industrial Production, and an increase to 74.8% (from 74.7% before revision) for Capacity Utilization.
 Total housing starts were at 610 thousand (SAAR) in September, up 0.3% from the revised August rate of 608 thousand (revised up from 598 thousand), and up 28% from the all time record low in April 2009 of 477 thousand (the lowest level since the Census Bureau began tracking housing starts in 1959).
 There has been an increase in multi-family starts over the last two months, although single family starts are significantly below the levels of earlier this year.
Single-family starts increased 4.4% to 452 thousand in August. This is 25% above the record low in January 2009 (360 thousand).
This was above expectations of 580 thousand starts, mostly because of the volatile multi-family starts.
 The National Association of Home Builders (NAHB) reports the housing market index (HMI) was at 16 in October. This is a 3 point increase from 13 in September, and is the highest level since June. The record low was 8 set in January 2009, and 16 is still very low ...
Note: any number under 50 indicates that more builders view sales conditions as poor than good.
This graph compares the NAHB HMI (left scale) with single family housing starts (right scale). This includes the October release for the HMI and the August data for starts (posted before starts were released).
This shows that the HMI and single family starts mostly move in the same direction - although there is plenty of noise month-to-month.
 Moody's reported today that the Moody’s/REAL All Property Type Aggregate Index declined 3.3% in August. This is a repeat sales measure of commercial real estate prices.
Here is a comparison of the Moodys/REAL Commercial Property Price Index (CPPI) and the Case-Shiller composite 20 index.
CRE prices only go back to December 2000.
The Case-Shiller Composite 20 residential index is in blue (with Dec 2000 set to 1.0 to line up the indexes).
It is important to remember that the number of transactions is very low and there are a large percentage of distressed sales.
Note: This index is a leading indicator for new Commercial Real Estate (CRE) investment.
 Reuters reports that the American Institute of Architects’ Architecture Billings Index increased to 50.4 in September from 48.2 in August. Any reading above 50 indicates expansion.
This graph shows the Architecture Billings Index since 1996. This is the first time the index has been above 50 since Jan 2008.
Note: Nonresidential construction includes commercial and industrial facilities like hotels and office buildings, as well as schools, hospitals and other institutions.
According to the AIA, there is an "approximate nine to twelve month lag time between architecture billings and construction spending" on non-residential construction. So, if the index stays at 50 or above, this suggests there will probably be further declines in CRE investment for the next 9 to 12 months.
Here is the Philadelphia Fed Index: Business Outlook Survey
Results from the Business Outlook Survey suggest that regional manufacturing activity was steady in October. Although the broad survey measures showed marginal improvement this month, the new orders index continued to suggest weak demand for manufactured goods.
...
The survey’s broadest measure of manufacturing conditions, the diffusion index of current activity, increased from a reading of –0.7 in September to 1.0 in October.
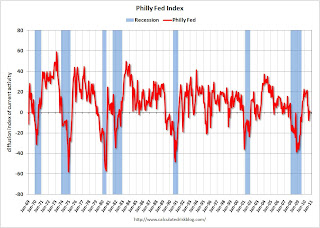 This graph shows the Philly index for the last 40 years.
This index turned down sharply in June and July and was negative in August and September (indicating contraction). The index was barely positive in October, and the internals (new orders, employment) are still weak.
These surveys are timely, but noisy. However this is further evidence of a slowdown in manufacturing. This was slightly worse than the consensus view of a reading of 1.8 (slight expansion).
Best wishes to all.
Saturday, October 23, 2010
Jim the Realtor: Sign Overload
by Calculated Risk on 10/23/2010 09:05:00 PM
The first scene is a classic with all the election signs! Jim says: "Tough time of year for open houses. Aren't you suffering from sign overload right about now?" Yeah, I am!
Jim also update us on some foreclosures and shows us an "estate" in Encinitas (in a mixed neighborhood), and Jim rocks out at the end.
I know the "estate" area very well - that was all flower growers not that many years ago. Some of the land has been sold off to builders, and it looks like some guy bought one plot and built an "estate". Here is the google map of the house (it goes about 70% of the way from Lake to Crest). A little out of character for the immediate neighborhood, and notice all the growers around it.
Number of Bank Failures: 2010 about to surpass 2009
by Calculated Risk on 10/23/2010 05:28:00 PM
I haven't updated these graphs for some time ...
There have been 307 bank failures in this cycle (starting in 2007):
| FDIC Bank Failures by Year | |
|---|---|
| 2007 | 3 |
| 2008 | 25 |
| 2009 | 140 |
| 2010 | 139 |
| Total | 307 |
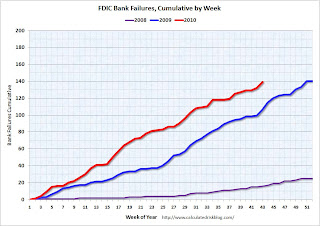 Click on graph for larger image in new window.
This graph shows bank failures by week in 2008, 2009 and 2010.
At this time last year, there were 106 bank failures - on the way to 140 total failures in 2009. This year there are 139 failures so far, and, at this pace, it looks like there will be around 175 total failures in 2010.
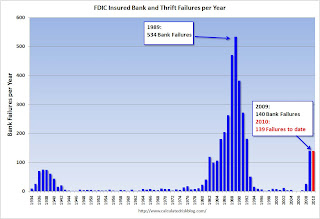 That would be the highest total since the 181 bank failures in 1992.
Bank failures peaked at 534 in 1989 during the S&L crisis.
And on total assets from the December Congressional Oversight Panel’s Troubled Asset Relief Program report:
[A]lthough the number of failed banks was significantly higher in the late 1980s than it is now, the aggregate assets of failed banks during the current crisis far outweighs those from the 1980s. At the high point in 1988 and 1989, 763 banks failed, with total assets of $309 billion. Compare this to 149 banks failing in 2008 and 2009, with total assets of $473 billion.Note: This is in 2005 dollars and doesn't include the failures in 2010 (only estimates are available so far for 2010). However this does include the failure of WaMu in 2008 with $307 billion in assets that didn't impact the DIF.
Impact of BofA Foreclosure Moratorium on North San Diego County
by Calculated Risk on 10/23/2010 01:52:00 PM
Some interesting data for just one small area ...

Graph from North County Times and shows the impact of the BofA foreclosure moratorium on repossessions in a non-judicial area.
This is just in the North San Diego and Southwest Riverside counties.
From Eric Wolff at the NC Times: Foreclosure moratorium takes hold locally
In the first week of the moratorium, starting Oct. 12, the number of houses foreclosed in the region plummeted 27 percent from the previous week, to 173 foreclosure sales, according to ForeclosureRadar.The "foreclosure-gate" scandal had no impact on existing home sales in September (to be released this coming Monday), but will probably have an impact on closed sales in October.
Much of the drop can be attributed to Bank of America's subsidiary ReconTrust NA, which handled 23.7 percent of the region's foreclosures in 2010.
Unofficial Problem Bank List at 871 Institutions
by Calculated Risk on 10/23/2010 08:39:00 AM
Note: this is an unofficial list of Problem Banks compiled only from public sources.
Here is the unofficial problem bank list for Oct 22, 2010.
Changes and comments from surferdude808:
Failures contributed to the Unofficial Problem Bank List changes this week. There were eight removals, with seven because of failure, and four additions, which leaves the list at 871 institutions with assets of $402.2 billion.
Among the removals was the unassisted merger of Citizens National Bank of Springfield ($254 million) into cross-town Empire Bank, Springfield, MO. The failures included Hillcrest Bank ($1.6 billion); First Arizona Savings, a FSB ($272 million); First Suburban National Bank ($149 million); The First National Bank of Barnesville ($136 million); Progress Bank of Florida ($111 million); First Bank of Jacksonville ($81 million); and The Gordon Bank ($29 million).
The First National Bank of Barnesville opened its doors in 1902; thus, it survived the Great Depression but it was not able to weather the Great Recession.
The FDIC could not find a buyer for First Arizona Savings so they will mail insured depositors a check; however, its cost estimate of only 12 percent of assets is the lowest of the night and one-third lower than the next cheapest deposit payoff in this cycle, which was Arcola Homestead Savings Bank at 18.8 percent in June 2010.
The four additions are Gibraltar Private Bank & Trust Co., Coral Gables, FL ($1.6 billion); Wilber National Bank, Oneonta, NY ($929 million Ticker: GIW); Highlands Union Bank, Abingdon, VA ($649 million Ticker: HBKA); and Bank of Maumee, Maumee, OH ($45 million). Gibraltar had purchased about $1.5 billion of assets from Boston Private Bank & Trust Company (Ticker: BPFH) in 2009.
Next week there should be many changes as we expect the FDIC to release its actions for September 2010.
Friday, October 22, 2010
Bank Failure #139: First Arizona Savings, Scottsdale, Arizona
by Calculated Risk on 10/22/2010 09:21:00 PM
First / Arizona / Savings
No / yes / not at all
by Soylent Green is People
From the FDIC: FDIC Approves the Payout of the Insured Deposits of First Arizona Savings, A FSB, Scottsdale, Arizona
As of June 30, 2010, First Arizona Savings, A FSB had approximately $272.2 million in total assets and $198.8 million in total deposits. ... The FDIC estimates the cost of the failure to its Deposit Insurance Fund to be approximately $32.8 million. ... The last institution closed in the state was Towne Bank of Arizona, Mesa, on May 7, 2010.No one wanted this one! That makes 7 today ...
Bank Failures #137 & 138: Kansas and Illinois
by Calculated Risk on 10/22/2010 07:11:00 PM
Federal feeding frenzy
Huge heartland heartburn
by Soylent Green is People
From the FDIC: Seaway Bank and Trust Company, Chicago, Illinois, Assumes All of the Deposits of First Suburban National Bank, Maywood, Illinois
As of June 30, 2010, First Suburban National Bank had approximately $148.7 million in total assets and $140.0 million in total deposits ... The FDIC estimates that the cost to the Deposit Insurance Fund (DIF) will be $31.4 million. .... First Suburban National Bank is the 137th FDIC-insured institution to fail in the nation this year, and the 16th in Illinois.From the FDIC: Hillcrest Bank, National Association, Overland Park, Kansas, Assumes All of the Deposits of Hillcrest Bank, Overland Park, Kansas
As of June 30, 2010, Hillcrest Bank had approximately $1.65 billion in total assets and $1.54 billion in total deposits. ... The FDIC estimates that the cost to the Deposit Insurance Fund (DIF) will be $329.7 million. ... Hillcrest Bank is the 138th FDIC-insured institution to fail in the nation this year, and the third in Kansas.
Bank Failure #136: The First National Bank of Barnesville, Barnesville, Georgia
by Calculated Risk on 10/22/2010 06:27:00 PM
Far too late for Barnsville now
Money's ridden off
by Soylent Green is People
From the FDIC: United Bank, Zebulon, Georgia, Assumes All of the Deposits of The First National Bank of Barnesville, Barnesville, Georgia
As of June 30, 2010, The First National Bank of Barnesville had approximately $131.4 million in total assets and $127.1 million in total deposits. ... The FDIC estimates that the cost to the Deposit Insurance Fund (DIF) will be $33.9 million. ... The First National Bank of Barnesville is the 136th FDIC-insured institution to fail in the nation this year, and the 16th in Georgia.Four down ...
Bank Failures #133 to 135: Florida and Georgia
by Calculated Risk on 10/22/2010 05:09:00 PM
Florida, Georgia failures
A phantom luster
by Soylent Green is People
From the FDIC: Ameris Bank, Moultrie, Georgia, Assumes All of the Deposits of First Bank of Jacksonville, Jacksonville, Florida
As of June 30, 2010, First Bank of Jacksonville had approximately $81.0 million in total assets and $77.3 million in total deposits. ... The FDIC estimates that the cost to the Deposit Insurance Fund (DIF) will be $16.2 million. ... First Bank of Jacksonville is the 133rd FDIC-insured institution to fail in the nation this year, and the 26th in Florida.From the FDIC: Bay Cities Bank, Tampa, Florida, Assumes All of the Deposits of Progress Bank of Florida, Tampa, Florida
As of June 30, 2010, Progress Bank of Florida had approximately $110.7 million in total assets and $101.3 million in total deposits. ... The FDIC estimates that the cost to the Deposit Insurance Fund (DIF) will be $25.0 million. ... Progress Bank of Florida is the 134th FDIC-insured institution to fail in the nation this year, and the 27th in Florida.From the FDIC: Morris Bank, Dublin, Georgia, Assumes All of the Deposits of The Gordon Bank, Gordon, Georgia
As of June 30, 2010, The Gordon Bank had approximately $29.4 million in total assets and $26.7 million in total deposits. ... The FDIC estimates that the cost to the Deposit Insurance Fund (DIF) will be $9.0 million. ... The Gordon Bank is the 135th FDIC-insured institution to fail in the nation this year, and the 15th in Georgia.
Report: 1.2 Million Workers could lose Unemployment Benefits next month
by Calculated Risk on 10/22/2010 04:07:00 PM
From the National Employment Law Project: 1.2 Million Workers Out in the Cold for the Holidays If Congress Fails to Renew Federal Jobless Benefits that Expire November 30th
A new analysis released by the National Employment Law Project today reveals that 1.2 million workers will be cut off of federal jobless benefits by year’s end if Congress fails to renew the federal emergency extensions that expire on November 30th.This doesn't include the '99ers - the workers who have exhausted all available unemployment benefits.
...
Of the 1.2 million workers at risk of losing federal benefits, 387,000 are workers who were recently laid-off and are now receiving the six months (26 weeks) of regular state benefits. After exhausting state benefits, these workers would be left to fend for themselves in a job market with just one job opening for every five unemployed workers and an unemployment rate that has exceeded nine percent for 17 months in a row—with no federal unemployment assistance whatsoever.


