 RSS Feed
 by Calculated Risk on 10/20/2010 07:39:00 AM
Wednesday, October 20, 2010
MBA: Mortgage Purchase Activity Declines
The MBA reports: Mortgage Applications Decrease in Latest MBA Weekly Survey
The Refinance Index decreased 11.2 percent from the previous week. The seasonally adjusted Purchase Index decreased 6.7 percent from one week earlier.
...
The average contract interest rate for 30-year fixed-rate mortgages increased to 4.34 percent from 4.21 percent, with points decreasing to 0.81 from 1.02 (including the origination fee) for 80 percent loan-to-value (LTV) ratio loans.
 Click on graph for larger image in new window.
This graph shows the MBA Purchase Index and four week moving average since 1990.
The purchase index declined to near the lows of earlier this year, but this is just one week - the decline might be related to the Columbus Day holiday or to the recent slight change in FHA lending standards.
Note that the 30 year contract rate at 4.34% is just up from the record low of 4.21%.
AIA: Architecture Billings Index shows expansion, first time since Jan 2008
by Calculated Risk on 10/20/2010 12:00:00 AM
Note: This index is a leading indicator for new Commercial Real Estate (CRE) investment.
Reuters reports that the American Institute of Architects’ Architecture Billings Index increased to 50.4 in September from 48.2 in August. Any reading above 50 indicates expansion.
"The strong upturn in design activity in the commercial and industrial sector certainly suggests that this upturn can possibly be sustained," said Kermit Baker, AIA's chief economist. "But we will need to see consistent improvement over the next few months in order to feel comfortable about the state of the design and construction industry."The ABI press release is not online yet.
 Click on graph for larger image in new window.
This graph shows the Architecture Billings Index since 1996. This is the first time the index has been above 50 since Jan 2008.
Note: Nonresidential construction includes commercial and industrial facilities like hotels and office buildings, as well as schools, hospitals and other institutions.
According to the AIA, there is an "approximate nine to twelve month lag time between architecture billings and construction spending" on non-residential construction. So, if the index stays at 50 or above, this suggests there will probably be further declines in CRE investment for the next 9 to 12 months.
Tuesday, October 19, 2010
Foreclosure-Gate: The Investigations and some comments on other issues
by Calculated Risk on 10/19/2010 08:42:00 PM
From Zachary Goldfarb at the WaPo: Task force probing whether banks broke federal laws during home seizures
Goldfarb writes that the Financial Fraud Enforcement Task Force is looking into whether the mortgage servicers misled federal housing agencies, and also "into whether the submission of flawed paperwork during the foreclosure process violated mail or wire fraud laws". There will be a meeting tomorrow (Wednesday), followed by a briefing by "HUD Secretary Shaun Donovan and the task force executive director, Robb Adkins".
White House press secretary Robert Gibbs ... said the administration is strongly supporting a parallel probe by every state's attorney general. Foreclosure law is largely the domain of state courts.And from David Streitfeld at the NY Times: States Continue Foreclosure Inquiries
“There has been an attempt by some of the major servicers to indicate there are no problems,” said Patrick Madigan, Iowa’s assistant attorney general. “We’re not at the end of this process. We’re at the beginning.”My comment: I fully support these investigations, but I've downplayed "foreclosure-gate" because I thought the impact on housing and the economy would be minor - depending of course on the length of the foreclosure delays. Many other people disagree with my view - and please remember I'm not always right.
It is important to separate out two other issues. The first is MERS (the "Mortgage Electronic Registration System"). There are many interesting issues with MERS - and plenty of litigation - but my feeling is that the defects are curable, and these issues will have little impact on the economy. Since I think the impact will be minor, once again I've mostly been ignoring these issues.
The third issue is repurchase requests based on Reps and Warranties for mortgages. This is an important story for the banks. I've been mentioning the increasing push-backs from the GSEs (Fannie and Freddie). That isn't a new story. The important development today was that several major bond investors are pressuring BofA to repurchase defective mortgages. Although I've been following this story, I haven't mentioned it - and some people think I've been "behind the curve". Could be.
The key questions are how many loans will eventually be pushed-back and how long it will take. Usually this process takes a long time and involves analyzing numerous loan files for defects. And these weren't GSE loans for a reason - the loans had significant risk layering (stated income, option ARMs, high LTV, and high debt-to-income ratios etc.) and these risk factors were fully disclosed to the investors. I expect this to be a slow process and be a drag on bank earnings for some time, but not be another major event like the collapse of Lehman. Once again I think the impact on the economy will be minor (my focus is on housing and the economy).
Housing Starts and the Unemployment Rate
by Calculated Risk on 10/19/2010 05:50:00 PM
An update by request ...
 Click on graph for larger image in new window.
This graph shows single family housing starts and the unemployment rate (inverted) through September. Note: Of course there are many other factors too, but housing is a key sector.
You can see both the correlation and the lag. The lag is usually about 12 to 18 months, with peak correlation at a lag of 16 months for single unit starts. The 2001 recession was a business investment led recession, and the pattern didn't hold.
Housing starts (blue) rebounded a little last year,and then moved sideways for some time, before declining again in May.
This is what I expected when I first posted the above graph over a year ago. I wrote:
[T]here is still far too much existing home inventory, a sharp bounce back in housing starts is unlikely, so I think ... a rapid decline in unemployment is also unlikely.Usually near the end of a recession, residential investment1 (RI) picks up as the Fed lowers interest rates. This leads to job creation and also household formation - and that leads to even more demand for housing units - and more jobs, and more households - a virtuous cycle that usually helps the economy recover.
However this time, with the huge overhang of existing housing units, this key sector isn't participating. Earlier today, NY Fed President William Dudley said the NY Fed's estimate was that "there are roughly 3 million vacant housing units more than usual". If that estimate is correct (I think it is too high), then it would take several years of housing starts at the current level, combined with more normal household growth, to eliminate the excess supply.
1 RI is mostly new home sales and home improvement.
Major Bondholders seek BofA Mortgage Repurchases
by Calculated Risk on 10/19/2010 02:46:00 PM
From Bloomberg: Pimco, New York Fed Said to Seek BofA Repurchase of Mortgages
Pacific Investment Management Co., BlackRock Inc. and the Federal Reserve Bank of New York are seeking to force Bank of America Corp. to repurchase soured mortgages packaged into $47 billion of bonds by its Countrywide Financial Corp. unit, people familiar with the matter said.This will take time - and be contested - but the battle over Reps and Warranties will probably continue to grow. Fannie and Freddie have been ramping up their push backs for some time, and here come the push backs from the private investors. I think this will be a drag on bank earnings for some time.
The bondholders wrote a letter to Bank of America and Bank of New York Mellon Corp., the debt’s trustee, citing alleged failures by Countrywide to service the loans properly ...
Moody's: Commercial Real Estate Prices fall to 2002 Levels
by Calculated Risk on 10/19/2010 12:50:00 PM
Moody's reported today that the Moody’s/REAL All Property Type Aggregate Index declined 3.3% in August. This is a repeat sales measure of commercial real estate prices.
Below is a comparison of the Moodys/REAL Commercial Property Price Index (CPPI) and the Case-Shiller composite 20 index.
Notes: Beware of the "Real" in the title - this index is not inflation adjusted. Moody's CRE price index is a repeat sales index like Case-Shiller - but there are far fewer commercial sales - and that can impact prices.
 Click on graph for larger image in new window.
CRE prices only go back to December 2000.
The Case-Shiller Composite 20 residential index is in blue (with Dec 2000 set to 1.0 to line up the indexes).
It is important to remember that the number of transactions is very low and there are a large percentage of distressed sales.
HousingWire has more:
"The commercial real estate market in the U.S. has become trifurcated with prices rising for performing trophy assets located in major markets, falling sharply for distressed assets, and remaining essentially flat for smaller healthy properties," said Nick Levidy, managing director at Moody's.
Fed's Dudley: 3 million excess vacant housing units
by Calculated Risk on 10/19/2010 10:09:00 AM
From NY Fed President William Dudley: Regional Economy and Housing Update
[L]et's consider the slow housing recovery. Housing market activity—both new construction and sales—remains depressed. On the construction side, total housing starts are running at just 600,000 units per year (seasonally-adjusted) in recent months. This is up from 530,000 units at the trough in the first quarter of 2009 but it is still extremely low by the standards of the last 50 years. In fact, the rate of new construction is so low that there is barely any net growth in the U.S. housing stock these days.For those in the New York / New Jersey area, much of Dudley speech is on the regional economy and housing market.
One reason why so little housing is being built is that many existing homes stand vacant. We estimate that there are roughly 3 million vacant housing units more than usual. And more vacancies are added daily as the foreclosure process moves homes from families to mortgage lenders. This stock of vacant homes will shrink when fewer are foreclosed upon and more of these homes are sold or rented out.
On the sales side, even though low mortgage interest rates and falling home prices have together boosted housing affordability to its highest level in 40 years, the current pace of sales is quite sluggish. Impediments to home sales include tight lending standards, a weak job market and continued uncertainty regarding the future path of home prices. The large decline in home prices that occurred between 2006 and 2008 is also important. This decline reduced the amount of equity that owners have in their homes, making it difficult for people to come up with the funds needed to "trade-up" and move into better homes.
In addition, the steep decline in home prices put many families at risk of mortgage delinquency and, ultimately, losing their homes to foreclosure. With lower home prices, many families now owe more on their mortgage than their home is worth. This means that they cannot refinance or sell their homes easily if they experience a financial crisis, such as a job loss or a serious illness. Recent developments on foreclosures have been mixed. While RealtyTrac reports that foreclosure completions in the United States exceeded 100,000 for the first time in September, it is important to remember that foreclosure is a lengthy process in most states. Our data indicate that, in recent quarters, borrowers are becoming less likely to fall behind on their mortgages, so fewer households are now entering the foreclosure process. At the same time, though, major lenders have acknowledged serious problems in the processes they have used to repossess homes and announced moratoria on new foreclosures. Taken together, these developments suggest that the situation in housing remains uncertain for the foreseeable future.
The Federal Reserve actively encourages efforts to find viable alternatives to foreclosure, like loan modifications, or deeds in lieu. We also support due process and access to legal counsel for homeowners facing foreclosure, for instance through legal aid programs. At the same time, it is important that foreclosures that properly comply with state and federal law can ultimately take place, as this is a necessary part of the adjustment that will eventually return us to more normal conditions in the housing market.
At present, the extent of the documentation problem and its wider ramifications are still uncertain. In conjunction with the Office of the Comptroller of the Currency and the Federal Deposit Insurance Corporation, the Federal Reserve is therefore seeking to establish the facts through a review of the foreclosure practices, governance and documentation at the major bank mortgage servicers. We want to ensure that the housing finance business is supported by robust back-office operations—for processing of new mortgages as well as foreclosures— so that buyers of homes and investors in mortgage securities have full confidence in the process. We are monitoring developments closely in order to evaluate any potential impact on the housing market, financial institutions and the overall economy.
Housing Starts increase in September
by Calculated Risk on 10/19/2010 08:30:00 AM
 Click on graph for larger image in new window.
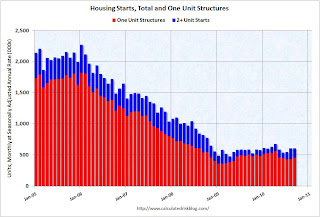
Total housing starts were at 610 thousand (SAAR) in September, up 0.3% from the revised August rate of 608 thousand (revised up from 598 thousand), and up 28% from the all time record low in April 2009 of 477 thousand (the lowest level since the Census Bureau began tracking housing starts in 1959).
There has been an increase in multi-family starts over the last two months, although single family starts are significantly below the levels of earlier this year.
Single-family starts increased 4.4% to 452 thousand in August. This is 25% above the record low in January 2009 (360 thousand).
 The second graph shows total and single unit starts since 1968. This shows the huge collapse following the housing bubble, and that housing starts have mostly been moving sideways for almost two years - with a slight up and down over the last six months due to the home buyer tax credit.
Here is the Census Bureau report on housing Permits, Starts and Completions.
Housing Starts:This was above expectations of 580 thousand starts, mostly because of the volatile multi-family starts. As I've mentioned many times - this low level of starts is good news for the housing market longer term (there are too many housing units already), but bad news for the economy and employment short term.
Privately-owned housing starts in September were at a seasonally adjusted annual rate of 610,000. This is 0.3 percent (±10.3%)* above the revised August estimate of 608,000 and is 4.1 percent (±12.0%)* above theSeptember 2009 rate of 586,000.
Single-family housing starts in September were at a rate of 452,000; this is 4.4 percent (±13.9%)* above the revised August figure of 433,000.
Building Permits:
Privately-owned housing units authorized by building permits in September were at a seasonally adjusted annual rate of 539,000. This is 5.6 percent (±1.4%) below the revised August rate of 571,000 and is 10.9 percent (±2.3%) below the September 2009 estimate of 605,000.
Single-family authorizations in September were at a rate of 405,000; this is 0.5 percent (±1.3%)* above the revised August figure of 403,000.
Monday, October 18, 2010
Foreclosure-Gate: GMAC resumes some foreclosures
by Calculated Risk on 10/18/2010 09:48:00 PM
Statement from GMAC: GMAC Mortgage Statement on Independent Review and Foreclosure Sales
GMAC Mortgage ... has engaged several leading legal and accounting firms to conduct independent reviews of its foreclosure procedures in each of the 50 states.Earlier I posted the BofA and Citi comments (BofA is resuming foreclosures, Citi said their foreclosure process was "sound".) Several large banks report Q3 results over the next two days (BofA, Goldman Sachs, Wells Fargo and Morgan Stanley), and I expect more comments on foreclosure issues (and possibly more questions).
...
In addition to the nationwide measures, the review and remediation activities related to cases involving judicial affidavits in the 23 states continues and has been underway for approximately two months. As each of those files is reviewed, and remediated when needed, the foreclosure process resumes. GMAC Mortgage has found no evidence to date of any inappropriate foreclosures.
On the Citi conference call this morning there were no questions on foreclosure-gate and only one on securitization issues - and that didn't provide any new information.
2010 Census: Final Weekly Payroll Update
by Calculated Risk on 10/18/2010 06:59:00 PM
The Census Bureau has released the final weekly payroll report for the 2010 Census. The report shows only 2,766 temporary workers were on the payroll for the week ending Oct 2nd.
 Click on graph for larger image in new window.
This graph shows the number of Census workers paid each week. The red labels are the weeks of the BLS payroll survey.
I'm providing this update because every month there is some confusion over how to report the payroll numbers in the employment report. Starting with the October employment report (to be released on November 5th), we can go back to reporting the headline number (not ex-Census), and we can ignore the impact of the temporary Census hiring on the monthly payroll numbers - well, until the next decennial Census!


