 RSS Feed
 by Calculated Risk on 7/06/2010 11:59:00 PM
Tuesday, July 06, 2010
Reis: Mall Vacancy Rate rises in Q2
 Click on graph for larger image in new window.
From Reuters: US shopping center vacancy rates rose in 2nd qtr
For U.S. strip centers, the vacancy rate in the second quarter rose ... to 10.9 percent, slightly below the 11 percent in 1991 during the prior real estate bust ...At regional malls, the vacancy rate rose to 9.0% - the highest since Reis starts tracking regional malls in 2000. The record vacancy rate for strip malls was in 1990 at 11.1%.
"Until we see stabilization and recovery take root in both consumer spending and business spending and employment, we do not foresee a recovery in the retail sector until late 2012 at the earliest," said Victor Calanog, Reis director of research.
Update on FHA Seller Concessions
by Calculated Risk on 7/06/2010 06:53:00 PM
Early this year, the FHA announced a proposal to reduce allowable seller concessions from 6% to 3%.
David H. Stevens, Assistant Secretary of Housing and FHA Commissioner, discussed the reasons for this proposal in May:
We are also proposing a third policy measure to reduce the maximum permissible seller concession from its current 6 percent level to 3 percent, which is in line with industry norms. The current level exposes the FHA to excess risk by creating incentives to inflate appraised value. ... FHA's experience shows that loans with high levels of seller concessions are significantly more likely to go to claim. Experience to-date on loans insured from FY 2003 to FY 2008 suggests that claim rates on high-concession loans are 50 percent higher or more than those on low-concession loans.I was told by the FHA today that a notice for public comment would be announced "VERY shortly". (I'm guessing that means in the next few weeks - if not this week).
The notice will be posted in the Federal Register, and will go into effect after a 30-day comment period.
LPS: Mortgage Delinquencies and Foreclosures increase to 12.38% in May
by Calculated Risk on 7/06/2010 03:19:00 PM
From Lender Processing Services: LPS' May Mortgage Monitor Report: Increase in Rate of New Delinquencies; Decline in Number of Delinquent Loans Becoming Current
The May Mortgage Monitor report released today by Lender Processing Services, Inc. ... shows a 2.3 percent month-over-month increase in the nation's home loan delinquency rate to 9.2 percent in May 2010, and that early-stage delinquencies are increasing as normal seasonal improvements taper off. This report includes data as of May 31, 2010.LPS shows 9.2% delinquent and another 3.18% in foreclosure for a total of 12.38%. I'm not sure about the days to foreclosure numbers (other sources show fewer), but they have steadily increased. For delinquency rates I usually use the quarterly report from the MBA.
According to the Mortgage Monitor report, the percentage of mortgage loans in default beyond 90 days increased slightly, while both delinquency and foreclosure rates continue to remain relatively stable at historically high levels. There are currently more than 7.3 million loans currently in some stage of delinquency or REO.
The report also shows that the average number of days for a loan to move from 30-days delinquent to foreclosure sale continues to increase, and is now at an all-time high of 449 days, resulting in an increase in "shadow" foreclosure inventory.
Here is the LPS monthly report. The increase in early stage delinquencies might be seasonal, but it is definitely bad news. And what happens when house prices start falling again later this year as I expect?
For more, from Diana Golobay at HousingWire: National Mortgage Delinquency Rate Swells to 9.2% in May: LPS
And from Diana Olick at CNBC: New Loan Delinquencies on the Rise Again
Older, more educated workers, have highest length of unemployment
by Calculated Risk on 7/06/2010 12:37:00 PM
Reader Ann (retired lawyer with economics degree) has obtained some publicly available raw data on the long term unemployed from the BLS Current Population Survey. Ann was able to break down the long term unemployed into two age cohorts, 1) 25 to 45, and 2) 45+.
She also broke down the data by four levels of education: 1) no high school degree, 2) high school only, 3) some college or Associates degree, and 4) BA degree or higher.
The following table summarizes the data (click on link to see table - it doesn't fit here):
Table Long Term Unemployed
(1) This includes all who have some college classes but no degree or certificate, those with certificates and those with an associates. Only 30%+/- of the “some college” group has an associates. There is not statistically significant difference in their average length of unemployment as between the ‘few classes’ or ‘certificate’ and an associates..
(2) I do not have the breakdown of all the unemployed by age combined with education. I only have that data for the long-term unemployed.
The first finding is not too surprising for the longer term unemployed:
The 2nd finding is a more surprising:
For the long term unemployed, it is better to be younger - and have less education.
Ann adds these comments:
More education = longer unemployment if the job is lost. The upside is the more educated the worker, the less likely they are to lose their job, but the downside of being more educated is that once they hit 45 if they lose their job, they are toast.It is tough to find a job, especially if you are older and better educated.
So what does one do with the over-45s with a BA or higher? ... The current mantra is 'more education is good for you' but this shows that it can, in the long run, hurt you.
ISM Non-Manufacturing Index shows slower expansion in June
by Calculated Risk on 7/06/2010 10:00:00 AM
The June ISM Non-manufacturing index was at 53.8%, down from 55.4% in May - and below expectations of 55. The employment index showed contraction in June at 49.7%. Click on graph for larger image in new window.
This graph shows the ISM non-manufacturing index (started in January 2008) and the ISM non-manufacturing employment diffusion index.
The employment index is showing contraction again after one month of expansion.
From the Institute for Supply Management: June 2010 Non-Manufacturing ISM Report On Business®
Economic activity in the non-manufacturing sector grew in June for the sixth consecutive month, say the nation's purchasing and supply executives in the latest Non-Manufacturing ISM Report On Business®.
The report was issued today by Anthony Nieves, C.P.M., CFPM, chair of the Institute for Supply Management™ Non-Manufacturing Business Survey Committee; and senior vice president — supply management for Hilton Worldwide. "The NMI (Non-Manufacturing Index) registered 53.8 percent in June, 1.6 percentage points lower than the 55.4 percent registered in May, indicating continued growth in the non-manufacturing sector, but at a slightly slower rate. The Non-Manufacturing Business Activity Index decreased 3 percentage points to 58.1 percent, reflecting growth for the seventh consecutive month. The New Orders Index decreased 2.7 percentage points to 54.4 percent, and the Employment Index decreased 0.7 percentage point to 49.7 percent, reflecting contraction after one month of growth. The Prices Index decreased 6.8 percentage points to 53.8 percent in June, indicating that prices are still increasing but at a slower rate than in May. According to the NMI, 15 non-manufacturing industries reported growth in June. Respondents' comments are mostly positive about business conditions; however, there is concern about the effect of employment on the economic recovery."
emphasis added
Reis: U.S. Office Vacancy Rate at 17 year high
by Calculated Risk on 7/06/2010 08:23:00 AM
 Click on graph for larger image in new window.
This graph shows the office vacancy rate starting 1991.
Reis is reporting the vacancy rate rose to 17.4% in Q1 2010, up from a revised 17.3% in Q1 (revised up from 17.2%), and up from 16.0% in Q2 2009. The peak following the previous recession was 16.9%.
From Bloomberg Office Vacancy Rate in U.S. Climbs to 17-Year High, Reis Says
The vacancy rate climbed to 17.4 percent from 16 percent a year earlier and 17.3 percent in the first quarter, the New York-based research company said today in a statement. Effective rents, the amount tenants actually pay landlords, fell 5.7 percent from a year earlier and 0.9 percent from the previous three months, according to Reis.It appears the rate of increases has slowed.
Reis should release the Mall and Apartment vacancy rates over the next few days, and those will probably be at record levels.
Monday, July 05, 2010
Rogoff sees "Collapse" in China's Property Market
by Calculated Risk on 7/05/2010 08:29:00 PM
From Bloomberg: China Property Market Beginning Collapse That May Hit Banks, Rogoff Says (ht jb)
“You’re starting to see that collapse in property and it’s going to hit the banking system,” [Kenneth Rogoff, Harvard University professor and former chief economist of the IMF] said today [in an interview with Bloomberg Television in Hong Kong].It appears Rogoff is talking about a "collapse" in sales, but price frequently follows volume in real estate - so perhaps he is also talking about a steep decline in prices.
...
He also said that while recoveries across the global economy are “very slow,” the danger of a return to recession isn’t “elevated.”
Note: Here is the weekly summary and a look ahead (with plenty of graphs from last week).
The Nikkei is off about 1.5% in early trading.
And from CNBC: Pre-Market Data shows the S&P 500 off over 1% (close to breaking under 1000) and Dow futures are off about 110 points.
Best to all.
More on the slowdown in China
by Calculated Risk on 7/05/2010 03:58:00 PM
Just a follow up to the previous posts on oil prices and the 2nd half slowdown ...
From Bloomberg: China Car Sales Grow at Slower Pace; Services Index Slides to 15-Month Low (ht Paulo)
China’s auto sales grew at a slower pace in June and a services-industry index slid to a 15-month low, adding to signs that the economy leading the world recovery is cooling.Slowing in China is just one of the 2nd half stories - there is also less stimulus spending, state and local government cutbacks, more household saving impacting consumption, another downturn in housing, and a slowdown and financial issues in Europe.
Passenger-car purchases rose 10.9 percent from a year earlier, down from May’s 25 percent gain, the China Automotive Technology & Research Center said today. The services-industry measure fell to 55.6 from 56.4, HSBC Holdings Plc and Markit Economics said in an e-mailed statement.
On the flip side, Yahoo had a headline this morning: 8 Problems That Could Trigger a Double-Dip Recession (ht Brian). Brian joked that this might be a new contrary indicator (like the old magazine cover indicator).
Update on Oil Prices
by Calculated Risk on 7/05/2010 01:21:00 PM
With the weakness in the US and European economies, and an apparent slowdown in China, it might be time to look at oil prices ...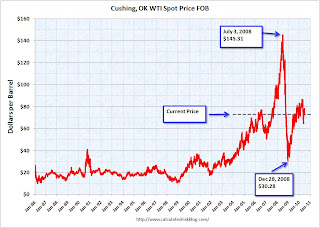 Click on graph for larger image in new window.
These are spot prices for Cushing WTI from the EIA (source).
Back in the Spring of 2008, we started seeing many signs of potential demand destruction - including fewer U.S miles driven, Asian countries reducing gasoline subsidies, and China stock piling oil for the Olympics. That was a pretty clear sign that oil prices would fall after China stopped stock piling oil.
So far miles driven have been increasing slowly (although the most recent data is for April, and there may be more weakness in June). And once again the Shanghai stock market is suggesting a slowdown in China. Not a clear sign like in 2008, but something to watch.
Europe: Austerity or "rigorous fiscal policies"?
by Calculated Risk on 7/05/2010 08:57:00 AM
A couple of quotes from the WSJ: Lagarde: Banks Will Pass Stress Tests
"There is no choice between austerity and stimulus," [Finance Minister Christine Lagarde] said at an economic conference in Aix-en-Provence. "Our policy is a subtle mix between growth-friendly spending cuts and letting play out the remainder of our stimulus package," she said.Paul Krugman disagrees: Plan XVII For Europe
...
"We are in a period when we have to manage budgets very cautiously. ... You may call that austerity if you want, I call this rigorous fiscal policies," [European Central Bank President Jean-Claude Trichet] told reporters on the sidelines of an economic conference in southern France.
"If you want sustainable growth, then you have to restore confidence and to do that you need to have balanced and sustainable fiscal policies in place," he added


