 RSS Feed
 by Calculated Risk on 6/30/2010 07:18:00 AM
Wednesday, June 30, 2010
MBA: Mortgage Refinance Applications increase, Purchase Applications near 13 Year Low
The MBA reports: Mortgage Refinance Applications Increase as Rates Continue to Drop in Latest MBA Weekly Survey
The Refinance Index increased 12.6 percent from the previous week and is the highest Refinance Index observed in the survey since the week ending May 22, 2009. The seasonally adjusted Purchase Index decreased 3.3 percent from one week earlier.
...
“Amid continuing financial market volatility, mortgage rates dropped again last week, with rates on 15-year loans reaching a record low for the MBA survey. Refinance applications jumped in response, but remain at about half the level seen in the spring of 2009,” said Michael Fratantoni, MBA’s Vice President of Research and Economics. “Purchase applications declined for the seventh time in the last eight weeks, keeping the purchase index near 13-year lows.”
...
The average contract interest rate for 30-year fixed-rate mortgages decreased to 4.67 percent from 4.75 percent, with points decreasing to 0.96 from 1.07 (including the origination fee) for 80 percent loan-to-value (LTV) ratio loans. This is the lowest 30-year contract rate recorded in the survey since the week ending April 24, 2009.
 Click on graph for larger image in new window.
This graph shows the MBA Purchase Index and four week moving average since 1990.
The purchase index has collapsed following the expiration of the tax credit suggesting home sales will fall sharply too. This is the lowest level for 4-week average of the purchase index since 1996.
Tuesday, June 29, 2010
Shanghai Composite at lowest level since April 2009
by Calculated Risk on 6/29/2010 10:57:00 PM
Just an update ... Click on graph for larger image in new window.
This graph shows the Shanghai SSE Composite Index and the S&P 500 (in blue).
The SSE Composite Index is at 2,384 - down almost 2% and off almost 25% since early April.
This is the lowest level since April 2009.
House Passes Homebuyer Tax Credit Closing Extension
by Calculated Risk on 6/29/2010 07:03:00 PM
From Reuters: U.S. House backs homebuyer tax credit extension
This is bad policy ... and the Senate will probably pass it tomorrow.
2nd Half: Slowdown or Double-Dip?
by Calculated Risk on 6/29/2010 04:00:00 PM
No one has a crystal ball, but it appears the U.S. economy will slow in the 2nd half of 2010.
For the unemployed and marginally employed, and for many other Americans suffering with too much debt or stagnant real incomes, there is little difference between slower growth and a double-dip recession. What matters to them is jobs and income growth.
In both cases (slowdown or double-dip), the unemployment rate will probably increase and wages will be under pressure. It is just a matter of degrees.
The arguments for a slowdown and double-dip recession are basically the same: less stimulus spending, state and local government cutbacks, more household saving impacting consumption, another downturn in housing, and a slowdown and financial issues in Europe and a slowdown in China. It is only a question of magnitude of the impact.
My general view has been that the recovery would be sluggish and choppy and I think this slowdown is part of the expected "choppiness". I still think the U.S. will avoid a technical "double-dip" recession.
Usually the deeper the recession, the more robust the recovery. That didn't happen this time (no "V-shaped" recovery), and it is probably worth reviewing why this period is different than an ordinary recession-recovery cycle.
An examination of the aftermath of severe financial crises shows deep and lasting effects on asset prices, output and employment. ... Even recessions sparked by financial crises do eventually end, albeit almost invariably accompanied by massive increases in government debt.
 Click on graph for larger image in new window.
 The graph from Rudebusch's shows a modified Taylor rule. According to Rudebusch's estimate, the Fed Funds rate should be around minus 5% right now if we ignore unconventional policy (obviously there is a lower bound) and probably close to minus 3% if we include unconventional policy. Obviously the Fed can't lower rates using conventional policy, although it is possible for more unconventional policy.
On this third point, I put together a table of housing supply metrics last weekend to help track the housing market. It is hard to have a robust economic recovery without a recovery in residential investment - and there will be no strong recovery in residential investment until the excess housing supply is reduced substantially.
During previous recoveries, housing played a critical role in job creation and consumer spending. But not this time. Residential investment is mostly moving sideways.
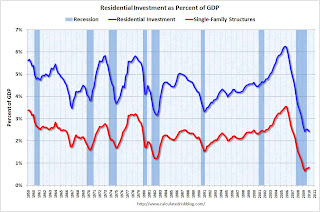 This graph shows residential investment (RI) and investment in single family structures as a percent of GDP. RI is mostly investment in single family structures, home improvement, multi-family structures and commissions on sale of existing structures.
It isn't the size of the sector (currently only about 2.5% of GDP), but the contribution during the recovery that matters - and housing is usually the largest contributor to economic growth and employment early in a recovery.
Two somewhat positive points: 1) builders will deliver a record low number of housing units in 2010, and that will help reduce the excess supply (see: Housing Stock and Flow), and 2) usually a recession (or double-dip) is preceded by a sharp decline in Residential Investment (housing is the best leading indicator for the business cycle), and it hard for RI to fall much further!
So I'm sticking with a slowdown in growth.
 And a market update from Doug Short of dshort.com (financial planner).
Click on graph for interactive version in new window.
The graph has tabs to look at the different bear markets - "now" shows the current market - and there is also a tab for the "four bears".
State and Local Tax Revenue increased slightly compared to Q1 2009
by Calculated Risk on 6/29/2010 12:05:00 PM
The Census Bureau reported this morning that state and local tax revenues grew 0.8% in the first quarter 2010 compared to Q1 2009. This was the second straight quarter of growth compared to the same quarter of the previous year.
Individual income tax increased 2.7% compared to Q1 2009.
General sales tax revenues increased 0.3%.
Corporate income tax declined 5.4%.
Property taxes declined 0.6% (the first year-over-same quarter decline since 2003).  Click on graph for larger image in new window.
This graph shows state and local tax revenue on a rolling 4 quarter basis (this removes seasonality).
The three main sources of revenue are property taxes, sales taxes and personal income taxes. Property taxes tend to be the most stable, even with the sharp drop in real estate prices.
Most of the decline in revenue during the recession came from sharp declines in personal income and sales taxes.
Consumer Confidence Plummets in June
by Calculated Risk on 6/29/2010 10:03:00 AM
From the Conference Board: Consumer Confidence Index® Drops Sharply
The Conference Board Consumer Confidence Index® which had been on the rise for three consecutive months, declined sharply in June. The Index now stands at 52.9 (1985=100), down from 62.7 in May.I rarely mention consumer confidence because it is mostly a coincident indicator, but this is quite a miss (expectations were for about the same level as May).
...
Says Lynn Franco, Director of The Conference Board Consumer Research Center: “Consumer confidence, which had posted three consecutive monthly gains and appeared to be gaining some traction, retreated sharply in June. Increasing uncertainty and apprehension about the future state of the economy and labor market, no doubt a result of the recent slowdown in job growth, are the primary reasons for the sharp reversal in confidence. Until the pace of job growth picks up, consumer confidence is not likely to pick up.”
Case-Shiller: House Prices increased in April due to tax credit
by Calculated Risk on 6/29/2010 09:00:00 AM
IMPORTANT: These graphs are Seasonally Adjusted (SA). S&P has cautioned that the seasonal adjustment is probably being distorted by irregular factors. These distortions could include distressed sales and the various government programs.
S&P/Case-Shiller released the monthly Home Price Indices for April (actually a 3 month average).
This includes prices for 20 individual cities, and two composite indices (10 cities and 20 cities).
From S&P: While Most Markets Improved in April 2010, Home Prices Do Not Yet Show Signs of Sustained Recovery According to the S&P/Case-Shiller Home Price Indices
Data through April 2010, released today by Standard & Poor’s for its S&P/Case-Shiller1 Home Price Indices, the leading measure of U.S. home prices, show that annual growth rates of all 20 MSAs and the 10- and 20-City Composites improved in April compared to March 2010. The 10-City Composite is up 4.6% from where it was in April 2009, and the 20-City Composite is up 3.8% versus the same time last year. In addition, 18 of the 20 MSAs and both Composites saw improvement in prices as measured by April versus March monthly changes.
“Home price levels remain close to the April 2009 lows set by the S&P/Case Shiller 10- and 20-City Composite series. The April 2010 data for all 20 MSAs and the two Composites do show some improvement with higher annual increases than in March’s report. However, many of the gains are modest and somewhat concentrated in California. Moreover, nine of the 20 cities reached new lows at some time since the beginning of this year. The month-over-month figures were driven by the end of the Federal first-time home buyer tax credit program on April 30th. Eighteen cities saw month-to-month gains in April compared to six in the previous month. Miami and New York were the two that fared the worst in April compared to March. New York is the only MSA to have posted a new relative index low with April’s report.” says David M. Blitzer, Chairman of the Index Committee at Standard & Poor’s.
“Other housing data confirm the large impact, and likely near-future pullback, of the federal program. Recently released data for May 2010 show sharp declines in existing and new home sales and housing starts. Inventory data and foreclosure activity have not shown any signs of improvement. Consistent and sustained boosts to economic growth from housing may have to wait to next year. ”
 Click on graph for larger image in new window.
 The first graph shows the nominal not seasonally adjusted Composite 10 and Composite 20 indices (the Composite 20 was started in January 2000).
The Composite 10 index is off 29.7% from the peak, and up 0.3% in April (SA).
The Composite 20 index is off 29.0% from the peak, and up 0.4% in April (SA).
 The second graph shows the Year over year change in both indices.
The Composite 10 is up 4.6% compared to April 2009.
The Composite 20 is up 3.8% compared to April 2009.
This is the third month with YoY price increases in a row.
The third graph shows the price declines from the peak for each city included in S&P/Case-Shiller indices.
 Prices increased (SA) in 17 of the 20 Case-Shiller cities in April (SA).
 Prices in Las Vegas are off 55.9% from the peak, and prices in Dallas only off 5.2% from the peak.
Case Shiller is reporting on the NSA data (18 cities up), and I'm using the SA data. As S&P noted, there probably was a small boost to prices from tax credit related buying, but prices will probably fall later this year.
Monday, June 28, 2010
Ireland: Austerity in Action
by Calculated Risk on 6/28/2010 10:41:00 PM
From Liz Alderman in the New York Times: In Ireland, a Picture of the High Cost of Austerity
As Europe’s major economies focus on belt-tightening, they are following the path of Ireland. But the once thriving nation is struggling, with no sign of a rapid turnaround in sight.As the Irish government cut the budget, the economy contracted faster and the deficit as a percent of GDP increased.
...
Rather than being rewarded for its actions, though, Ireland is being penalized. ... Lacking stimulus money, the Irish economy shrank 7.1 percent last year and remains in recession.
Joblessness in this country of 4.5 million is above 13 percent, and the ranks of the long-term unemployed — those out of work for a year or more — have more than doubled, to 5.3 percent.
...
The budget went from surpluses in 2006 and 2007 to a staggering deficit of 14.3 percent of gross domestic product last year — worse than Greece. It continues to deteriorate.
And how will they break the downward cycle? Export to England and America ...
[T]he government is pinning nearly all its hopes on an export revival to lift the economy. Falling wage and energy costs, and a weaker euro, have improved competitiveness.This approach works for one country - or a few - but not if every country is doing it.
Fed Econ Letter: State budget crisis poses "modest risk to national recovery"
by Calculated Risk on 6/28/2010 07:24:00 PM
From Jeremy Gerst and Daniel Wilson at the SF Fed: Fiscal Crises of the States: Causes and Consequences. Here is their conclusion:
The current fiscal crises that most states are facing are generally the result of a severe macroeconomic downturn combined with a limited ability of the states to respond to such shocks. States are facing increased demand for public services at the same time revenue is falling. Federal stimulus support for state budgets is winding down over the next two years. Rainy-day funds are all but exhausted. Thus, state fiscal crises aren’t likely to go away soon and will probably get worse before they get better. The solutions states employ to close projected budget gaps will have painful effects on state residents and businesses but pose a more modest risk to the national recovery. Historically, the health of the national economy determines the health of state finances, not the other way around. Sustained improvement in the national economy is essential for states to grow their way out of their current problems and improve their fiscal conditions.Although the authors didn't quantify the impact, Mark Zandi, chief economist at Moody’s Analytics, recently estimated that state and local cutbacks may cut 0.25% from U.S. GDP in 2010 and 2011.
But this is just one drag on the economy. I've been forecasting a 2nd half slowdown in GDP growth based on:
1) less Federal stimulus spending in the 2nd half of 2010. The decline in stimulus will probably be a drag of about 0.5% on GDP growth by Q4.
2) the end of the inventory correction. The inventory adjustment contributed 3.79 percentage points in Q4 2009 of the 5.6% annualized growth rate, and 1.88 percentage points of the 2.7% GDP growth (annualized) in Q1 2010. This will probably fall close to zero in the 2nd half (maybe even slightly negative).
3) more household saving leading to slower growth in personal consumption expenditures. The personal saving rate increased to 4.0% in May, and will probably rise further in the 2nd half.
4) another downturn in housing (lower prices, less residential investment). This might subtract 0.25 to 0.5 percentage points from growth in the 2nd half.
5) slowdown and financial issues in Europe and a slowdown in China,
6) and the cutbacks at the state and local level. According the Mark Zandi, this will subtract about 0.25% from GDP growth.
As I've noted before, a quarter point here, and half point there ... and pretty soon you have some real drag.
Misc: Greece Spreads Widen, Spanish Liquidity issues, Market Update
by Calculated Risk on 6/28/2010 04:00:00 PM
The 10-year Greece-to-German bond spread has widened to over 800 bps today. This is the highest level since the the EU / ECB policy response when the spread peaked at just under 1000 bps.
And from the Financial Times: Banks in Spain hit by end of ECB offer
Spanish banks have been lobbying the European Central Bank to act to ease the systemic fallout from the expiry of a €442bn ($542bn) funding programme this week ... On Thursday, the clock runs out ... One senior bank executive said: “Any central bank has to have the obligation to supply liquidity. But this is not the policy of the ECB. We are fighting them every day on this. It’s absurd.”This liquidity facility was put in place during the financial crisis. The ECB is offering one week and three month liquidity facilities, so there won't be any short term liquidity crisis - but there are concerns that his could lead to less lending in Spain.
excerpted with permission
And a market update from Doug Short of dshort.com (financial planner).Click on graph for interactive version in new window.
The graph has tabs to look at the different bear markets - "now" shows the current market - and there is also a tab for the "four bears".


