 RSS Feed
 by Calculated Risk on 6/19/2010 09:02:00 PM
Saturday, June 19, 2010
Housing Starts and the Unemployment Rate
An update on a theme ...  Click on graph for larger image in new window.
This graph shows single family housing starts and the unemployment rate through May (inverted).
You can see both the correlation and the lag. The lag is usually about 12 to 18 months, with peak correlation at a lag of 16 months for single unit starts. The 2001 recession was a business investment led recession, and the pattern didn't hold.
Usually housing starts and residential construction employment lead the economy out of a recession, but not this time because of the huge overhang of existing housing units. After rebounding a little in early '09, housing starts (blue) have mostly moved sideways.
This is what I expected when I first posted the above graph last summer. I wrote:
[T]here is still far too much existing home inventory, a sharp bounce back in housing starts is unlikely, so I think ... a rapid decline in unemployment is also unlikely.Usually near the end of a recession, residential investment (RI) picks up as the Fed lowers interest rates. This lead to job creation and also household formation - and that leads to even more demand for housing units - and more jobs, and more households - a virtuous cycle that usually helps the economy recovery.
Note: RI is mostly new home sales and home improvement.
However this time, with the huge overhang of existing housing units, this key sector isn't participating. So in this recovery there is less job creation, less household formation, and less demand for housing units than a normal recovery. This is sort of a circular trap for both GDP growth and employment.
Eventually the excess housing units will be absorbed - (progress is slowly being made, see Housing Stock and Flow) - but until then, this key sector will remain under pressure and I expect the recovery will be sluggish and the unemployment rate will stay elevated.
Summers cautious about recovery
by Calculated Risk on 6/19/2010 05:02:00 PM
From the Boston Globe: Summers cites recovery, risks
The US economy has probably begun a lasting recovery, but the outlook has become more uncertain in recent weeks ... said Lawrence Summers, President Obama’s top economic adviser.No one has a crystal ball, but Summers sure doesn't seem very confident.
...
Summers ... presented a cautious, measured view of economic conditions. For example, after expressing confidence that European policy makers would contain the government debt crisis and avoid another global financial crisis, he added that the assessment was “my best guess, and I could be wrong.’’
Or, when asked if the nation had achieved a self-sustaining recovery, Summers responded, “I think that’s the right presumption and my expectation. I wouldn’t be foolish enough to be certain.’’
Impact of Decennial Census on June Payroll Report
by Calculated Risk on 6/19/2010 01:05:00 PM
In a post last month I reviewed the impact of the decennial Census hiring on the payroll report. Here is an update ...
We can estimate the Census hiring using weekly payroll data from the Census bureau (ht Bob_in_MA). If we subtract the number of temporary 2010 Census workers in the week containing the 12th of the month, from the same week for the previous month - this provides a close estimate for the impact of the Census hiring.
The Census Bureau releases the actual number with the employment report.  Click on graph for larger image in new window.
This graph shows the number of Census workers paid each week. The red labels are the weeks of the BLS payroll survey.
So far the decennial Census payroll has decreased by 156 thousand this month, and will probably subtract 200 to 250 thousand from the payroll report (we will have a good estimate this coming Wednesday when the week ending June 12th is released).
When the employment report is released on July 2nd, a key number will be payroll jobs ex-Census (to understand the underlying trend). The headline number for June - including Census numbers - will probably be negative.
China statement: "To proceed with exchange rate reform"
by Calculated Risk on 6/19/2010 08:48:00 AM
From Bloomberg: China Yuan Pledge Suggests Peg to Dollar May Go
Here are some excerpts from the statement (via WSJ):
In view of the recent economic situation and financial market developments at home and abroad, and the balance of payments (BOP) situation in China, the People´s Bank of China has decided to proceed further with reform of the RMB exchange rate regime and to enhance the RMB exchange rate flexibility.I'll believe it when I see it ...
...
The global economy is gradually recovering. The recovery and upturn of the Chinese economy has become more solid with the enhanced economic stability. It is desirable to proceed further with reform of the RMB exchange rate regime and increase the RMB exchange rate flexibility.
Friday, June 18, 2010
Unofficial Problem Bank List increases to 781 Institutions
by Calculated Risk on 6/18/2010 11:45:00 PM
Sheila may be taking it easy, but surferdude808 is working hard ... Note: this is an unofficial list of Problem Banks compiled only from public sources.
Here is the unofficial problem bank list for June 18, 2010.
Changes and comments from surferdude808:
After relative calm last week, there were many changes to the Unofficial Problem Bank List this week as the OCC finally released their actions for May. The list stands at 781 institutions with aggregate assets of $404.3 billion, up from 760 institutions with aggregate assets of $385.2 billion last week. Only one removal this week -- the failed Nevada Security Bank ($492 million Ticker: TBHS).
There were 22 additions with aggregate assets of $19.6 billion. Most notable among the additions are Pacific Capital Bank, National Association, Santa Barbara, CA ($7.4 billion Ticker: PCBC); Bank Midwest, National Association, Kansas City, MO ($4.3 billion); Bank of Hampton Roads, Norfolk, VA ($2.7 billion); Seaside National Bank & Trust, Orlando, FL ($808 million); and Waccamaw Bank, Whiteville, NC ($585 million Ticker: WBNK). Bank Midwest is controlled by Dickinson Financial Corporation, a multi-bank holding company, and its other bank subsidiaries were also added this week including Academy Bank, National Association ($507 million), Armed Forces Bank, National Association ($835 million), Armed Forces Bank of California, National Association ($22 million), Southern Commerce Bank, National Association ($257 million), and SunBank, National Association ($88 million).
The OCC issued a Formal Agreement against Saigon National Bank, Westminster, CA ($71 million Ticker: SAGN), which has the dubious distinction of missing six TARP dividend payments. It is a mind scratcher why it has taken the OCC so long to issue an action against Saigon National Bank. One is even more challenged to understand the tardiness in action against Pacific Capital Bank, National Association.
As anticipated, there were two add backs -- Mission Oaks National Bank and Valley National Bank that were removed in the past two weeks when the OCC terminated Formal Agreements. Now these banks are operating under Consent Orders.
Other changes include Prompt Corrective Action Orders against banks already on the list and the conversion of some actions. The Federal Reserve issued PCA Orders against Pierce Commercial Bank ($258 million) and Sterling Bank ($408 million), and the OTS issued a PCA Order against Turnberry Bank ($264 million). The OCC converted Formal Agreements to Consent Orders against Rosemount National Bank ($38 million) and Security Bank, National Association ($160 million).
Bank Failure #83: Nevada Security Bank, Reno, Nevada
by Calculated Risk on 6/18/2010 09:10:00 PM
Silver State institution
Sugar-coat veneer
by Soylent Green is People
From the FDIC: Umpqua Bank, Roseburg, Oregon, Assumes All of the Deposits of Nevada Security Bank, Reno, Nevada
As of March 31, 2010, Nevada Security Bank had approximately $480.3 million in total assets and $479.8 million in total deposits ... The FDIC estimates that the cost to the Deposit Insurance Fund (DIF) will be $80.9 million. ... Nevada Security Bank is the 83rd FDIC-insured institution to fail in the nation this year, and the third in Nevada. The last FDIC-insured institution closed in the state was Sun West Bank, Las Vegas, on May 28, 2010.Friday wasn't cancelled ...
CoreLogic: House Prices increase 0.8% in April
by Calculated Risk on 6/18/2010 07:20:00 PM
From CoreLogic (formerly First American LoanPerformance): CoreLogic® Home Price Index Shows Year-Over-Year and Month-Over-Month Increase
National home prices increased in April, the second consecutive monthly increase. According to the CoreLogic HPI, national home prices, including distressed sales, increased by 2.6 percent in April 2010 compared to April 2009. This was an improvement over March’s yearover-year price increase of 2.3 percent. Excluding distressed sales, year-over-year prices increased in April by 2.2 percent; an improvement over the March non-distressed HPI which increased by 1.0 percent year-over-year.
On a month-over-month basis, the national average home price index increased by 0.8 percent in April 2010 compared to March 2010, which was stronger than the previous one-month increase of 0.1 percent from February to March.
...
“The monthly increase in the HPI shows the lingering effects of the homebuyer tax credit,” said Mark Fleming, chief economist for CoreLogic. “We expect that we will see home prices remain strong through early summer, but in the second half of the year we expect price growth to soften and possibly decline moderately.”
 Click on graph for larger image in new window.
 This graph shows the national LoanPerformance data since 1976. January 2000 = 100.
The index is up 2.6% over the last year, and off 29.5% from the peak.
House prices are off 3.5% from the recent peak in August 2009 (although some of the decline might be seasonal). The index bottomed in March 2009 ... and the index is up 3.1% since then.
CoreLogic expects prices to "soften and possibly decline moderately". I expect that we will see lower prices on this index later this year.
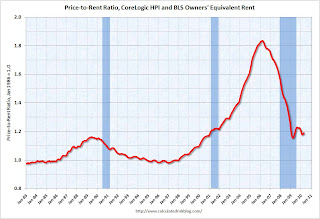 The second graph is an update on the price-to-rent ratio similar to the approach used by Fed economist John Krainer and researcher Chishen Wei in 2004: House Prices and Fundamental Value. Kainer and Wei presented a price-to-rent ratio using the OFHEO house price index and the Owners' Equivalent Rent (OER) from the BLS.
This graph shows the price to rent ratio using the CoreLogic data (January 2000 = 1.0).
This suggests that house prices are much closer to the bottom than the top, but that prices still have a ways to fall on a national basis.
Lumber Prices off 30% since April
by Calculated Risk on 6/18/2010 03:39:00 PM
By request, a graph of lumber prices ... Click on graph for larger image in new window.
From the NAHB, framing lumber prices have collapsed since the end of April.
This graph shows two measures of lumber prices: 1) from Random Lengths (via NAHB), and 2) CME futures.
With so many mills shut down during the bust, the supply of lumber was way down - and prices surged early this year. Now that construction has slowed, prices have collapsed.
Obama urges G-20 Nations to continue stimulus; Cautions about a Double-dip
by Calculated Risk on 6/18/2010 01:25:00 PM
From President Obama: Letter from the President to G-20 Leaders
Our highest priority in Toronto must be to safeguard and strengthen the recovery. We worked exceptionally hard to restore growth; we cannot let it falter or lose strength now.He also cautioned about global imbalances:
This means that we should reaffirm our unity of purpose to provide the policy support necessary to keep economic growth strong. It is essential that we have a self-sustaining recovery that creates the good jobs that our people need. In fact, should confidence in the strength of our recoveries diminish, we should be prepared to respond again as quickly and as forcefully as needed to avoid a slowdown in economic activity.
A strong and sustainable global recovery needs to be built on balanced global demand. Significant weaknesses exist across G-20 economies. I am concerned by weak private sector demand and continued heavy reliance on exports by some countries with already large external surpluses. Our ability to achieve a durable global recovery depends on our ability to achieve a pattern of global demand growth that avoids the imbalances of the past. ... I also want to underscore that market-determined exchange rates are essential to global economic vitality. The signals that flexible exchange rates send are necessary to support a strong and balanced global economy.Obama was clearly writing about China.
Obama argued for stimulus now - while the economy is weak - and fiscal discipline over the medium term:
We need to commit to fiscal adjustments that stabilize debt-to-GDP ratios at appropriate levels over the medium term.
State Unemployment Rates: Slightly lower in May
by Calculated Risk on 6/18/2010 10:00:00 AM
From the BLS: Regional and State Employment and Unemployment Summary
Regional and state unemployment rates were slightly lower in May. Thirty-seven states and the District of Columbia recorded unemployment rate decreases over the month, 6 states had increases, and 7 states had no change, the U.S. Bureau of Labor Statistics reported today. ...
In May, nonfarm payroll employment increased in 41 states and the District of Columbia, decreased in 5 states, and was unchanged in 4 states.
...
Nevada reported the highest unemployment rate among the states, 14.0 percent in May. This is the first month in which Nevada recorded the highest rate among the states and the first time since April of 2006 that a state other than Michigan has posted the highest rate. The rate in Nevada also set a new series high. (All region, division, and state series begin in 1976.) The states with the next highest rates were Michigan, 13.6 percent; California, 12.4 percent; and Rhode Island, 12.3 percent.
emphasis added
 Click on graph for larger image in new window.
This graph shows the high and low unemployment rates for each state (and D.C.) since 1976. The red bar is the current unemployment rate (sorted by the current unemployment rate).
Sixteen states and D.C. now have double digit unemployment rates. New Jersey is close.
Nevada set a new series high at 14% and now has the highest state unemployment rate. Michigan held the top spot for over 4 years.


