 RSS Feed
 by Calculated Risk on 6/17/2010 09:18:00 PM
Thursday, June 17, 2010
Merle Hazard: "Legal Tender"
Previous Merle Hazard hits include Inflation or Deflation?, H-E-D-G-E and Mark to Market ...
S&P expects up to 70% redefault on Loan Mods
by Calculated Risk on 6/17/2010 06:47:00 PM
From Zach Fox at SNL Financial: Analysts believe loan mod redefaults could hit 70%
Diane Westerback, S&P's managing director of global surveillance analytics, told SNL that the previously reported 30% to 40% redefault rates typically only count borrowers after two or three months of payments. A year after the modification, Westerback expects redefaults to hit between 60% and 70%.More shadow inventory ...
...
Fitch Ratings on June 16 issued similar projections, albeit only for subprime and Alt-A loans in RMBS. The rating agency projects modifications on those product types to redefault at a 65% to 75% range, while prime loans in RMBS are expected to redefault at a rate of 55% to 65%.
European Bond Spreads continue to widen
by Calculated Risk on 6/17/2010 04:02:00 PM
Here are two graphs from the Atlanta Fed weekly Financial Highlights released today (graph as of June 16th): Click on graph for larger image in new window.
From the Atlanta Fed:
After initially declining in early May, sovereign debt spreads have begun widening for peripheral euro-area countries. As of June 16, the 10-year bond spread (over German bonds) stands at 640 basis points (bps) for Greece, 283 bps for Ireland, 274 bps for Portugal, and 209 bps for Spain.Note: The Atlanta Fed data is one day old. Nemo has links to the current data on the sidebar of his site.
The spread to Spanish bonds has increased 110 bps since May 11, from 1% to 2.09%, while Portuguese bond spreads are 121 bps higher during the same period.
The spreads have widened further today: Greece is up to 668 bps, Ireland 290 bps, Portugal 293 bps, and Spain 211 bps. Oh, and Hungary is up sharply to 495 bps.

Similarly, while CDS spreads declined slightly last week, they are wide relative to earlier this year.Apparently this is what IMF Managing Director Dominique Strauss-Kahn meant by "contained" last week.
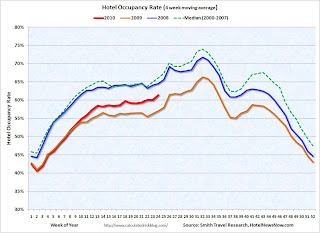
Hotel Occupancy Increases
by Calculated Risk on 6/17/2010 03:03:00 PM
From HotelNewsNow.com: STR: Luxury segment leads weekly increases
Overall, the industry’s occupancy increased 8.2 percent to 65.8 percent, ADR was up 1.7 percent to US$98.55, and RevPAR rose 10.0 percent to US$64.83.Note: As I noted last week, Memorial Day was late this year. That made last week look worse than actual, and made this week look better. This is why I use the 4-week moving average.
The following graph shows the four week moving average for the occupancy rate by week for 2008, 2009 and 2010 (and a median for 2000 through 2007).
 Click on graph for larger image in new window.
Notes: the scale doesn't start at zero to better show the change.
On a 4-week basis, occupancy is up 7.6% compared to last year (the worst year since the Great Depression) and still about 7% below normal.
Note: The graph shows the distinct seasonal pattern for the occupancy rate - higher in the summer because of leisure/vacation travel.
Last year leisure travel (summer) held up better than business travel, now it appears business travel is recovering - and we will soon see if leisure travel will also pick up this year.
Data Source: Smith Travel Research, Courtesy of HotelNewsNow.com
Have Residential Rents bottomed?
by Calculated Risk on 6/17/2010 01:04:00 PM
There is some evidence that apartment rents have bottomed ... at least temporarily.
The BLS reported this morning:
The shelter index increased for the first time since August 2009, rising 0.1 percent. The rise was mostly due to the index for lodging away from home, which increased 2.5 percent. The indexes for both rent and owners' equivalent rent were unchanged in May.The OER measure was up slightly and tends to lag other measures of rents.
Back in May, the NMHC reported that the market tightness index had increased sharply:
The Market Tightness Index, which measures changes in occupancy rates and/or rents, rose sharply from 38 to 81. This was the highest figure in nearly four years.There are some monthly private apartment data providers why say that rents have risen over the first 4 months of the year (on month-to-month basis, rents are still down year-over-year). They are reporting that the occupancy rate has risen slightly too.
...
“We saw a sharp increase in the Market Tightness Index, which fits with the surprisingly strong (for a seasonally weak period) effective rent growth.” [said NMHC Chief Economist Mark Obrinsky]
I spoke with a large apartment owner in Texas who told me they are seeing effective rents rising over the last few months.
I've also heard that the mood really changed at the NMHC meeting in May compared to the January meeting. There is a growing consensus among large apartment owners that rents have bottomed and the industry will rebound in 2011.
And from Dawn Wotapka the WSJ: Apartment Leases, Rents Pick Up
For the first time since the downturn, some of the nation's largest apartment-building landlords are reporting that rent declines have stopped and some are even boasting modest increases. Green Street Advisors, a real-estate research firm, says demand might have struck bottom in the first quarter ... From January through May, rents climbed 2.8% nationwide, according to Axiometrics, which tracks the national apartment market.This seems surprising given that REIS reported a record vacancy rate in Q1: "Nationally, the apartment vacancy rate stayed flat at 8%, the highest level since Reis Inc., a New York research firm, began its tally in 1980" and the Census Bureau reported the rental vacancy rate was at 10.6% in Q1, just below the all time high. Note: Reis is for large cities, the Census Bureau is nationwide.
Just something to be aware of ... rents could start falling again, but it does appear the slide has stopped for now - at least for the large apartment complexes.
Philly Fed Index "decreased notably" in June, Employment turned slightly negative
by Calculated Risk on 6/17/2010 10:00:00 AM
Here is the Philadelphia Fed Index released today: Business Outlook Survey.
The survey’s broadest measure of manufacturing conditions, the diffusion index of current activity, decreased notably from a reading of 21.4 in May to 8.0 in June. The index, which had edged higher for four consecutive months, fell back to its lowest reading in 10 months (see Chart). Although still positive and suggesting growth, indexes for new orders and shipments showed a mixed pattern this month — the new orders index increased 3 points, while the shipments index decreased 2 points. The current inventory index increased 13 points and moved back from a negative reading into positive territory, suggesting an increase in inventories this month.
Until this month, firms’ responses had been suggesting that labor market conditions were improving, but indexes for current employment and work hours were both slightly negative. For the first time in seven months, more firms reported a decrease in employment (18 percent) than reported an increase (17 percent).
emphasis added
 Click on graph for larger image in new window.
This graph shows the Philly index for the last 40 years.
The index has been positive for ten months now, but turned down "notably" in June.
This might suggest that growth in the manufacturing sector is slowing. Especially concerning is the slightly negative employment index.
Weekly Initial Unemployment Claims increase to 472,000
by Calculated Risk on 6/17/2010 08:34:00 AM
The DOL reports on weekly unemployment insurance claims:
In the week ending June 12, the advance figure for seasonally adjusted initial claims was 472,000, an increase of 12,000 from the previous week's revised figure of 460,000. The 4-week moving average was 463,500, a decrease of 500 from the previous week's revised average of 464,000.
...
The advance number for seasonally adjusted insured unemployment during the week ending June 5 was 4,571,000, an increase of 88,000 from the preceding week's revised level of 4,483,000.
 Click on graph for larger image in new window.
This graph shows the 4-week moving average of weekly claims since January 2000.
The four-week average of weekly unemployment claims decreased this week by 500 to 463,500 (the "decrease" was because last week was revised up).
The dashed line on the graph is the current 4-week average. Initial weekly claims first fell to this level in December 2009, and have been at the same level for about 6 months. The current level of 472,000 (and 4-week average of 463,500) is still high, and suggests ongoing weakness in the labor market.
Wednesday, June 16, 2010
Summary and Misc
by Calculated Risk on 6/16/2010 09:29:00 PM
A quick roundup ...
Remember MERS? From American Banker: Challenges to Foreclosure Docs Reach a Fever Pitch (ht Terry)
From HuffPost: Fannie Mae, Freddie Mac Shares To Be Pulled From NYSE (ht Paulo)
Homebuilder Toll Brothers warns: Demand Choppy, Sales Down
From CNBC: Europe Will Soon Publish Bank Stress Tests: ECB Official
Iceland: Court rules Foreign currency indexed loans illegal
From the NY Times: France and Spain Act to Rein in Budgets
From Bloomberg: Former Taylor Bean Chief Farkas Charged With Fraud
Lee Farkas, the former chairman of Taylor, Bean & Whitaker Mortgage Corp., was accused by the U.S. of helping run a more than $1.9 billion fraud scheme that unsuccessfully attempted to steal money from the government’s Troubled Asset Relief Program.From CNBC: More Than 90 Banks Miss TARP Payments (ht Scott, Ron)
 Click on graph for larger image in new window.
Total housing starts were at 593 thousand (SAAR) in May, down 10% from the revised April rate of 659,000 (revised down from 672 thousand), and up 24% from the all time record low in April 2009 of 477 thousand (the lowest level since the Census Bureau began tracking housing starts in 1959).
Single-family starts collapsed 17.2% to 468,000 in May.
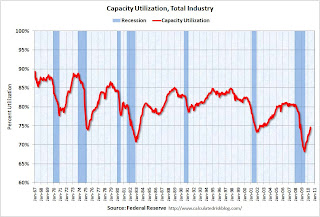 This graph shows Capacity Utilization. This series is up 9.4% from the record low set in June 2009 (the series starts in 1967).
 Capacity utilization at 73.7% is still far below normal - and 7.2% below the the pre-recession levels of 80.5% in November 2007.
Best to all.
Toll Brothers: Demand Choppy, Sales Down
by Calculated Risk on 6/16/2010 06:19:00 PM
Just a few weeks ago, new Toll CEO-designate Doug Yearley, Jr. noted:
"With demand increasing in many areas, we are very focused on growth."Uh, nevermind ...
From Toll today (ht Brian):
Joel H. Rassman, chief financial officer, stated: ... "While much of the attention surrounding the recent decline in housing indicators has focused on the expiration of the housing tax credit, we believe our customers' buying decisions have been driven more by consumer confidence than by the tax credit. As we noted in our second-quarter earnings press release of May 26, 2010, we believe the volatility in the financial markets and the high U.S. unemployment rate continue to weigh on the nation's psyche. Additionally, in the past several weeks, concerns about the financial crisis in Europe and escalating regional political tensions, coupled with worries about the oil spill in the Gulf of Mexico and its effects on the economy and the environment have negatively impacted the outlook of American consumers.Slightly ahead on a community bases - with 21% fewer communities. Do the math - they are running close to 20% below last year. And 40% below last year over the last three weeks (20% fewer deposits and 21% fewer communities).
"In the three weeks following our earnings conference call on May 26, 2010, our per-community deposits have been running about 20% behind the comparable period in last year's third quarter and our per-community traffic has been running about 3% behind. Thus, for the first six weeks of our FY 2010 third quarter beginning May 1, 2010, we are slightly ahead of last year's third-quarter pace of contracts signed on a per community basis. However, we have 21% fewer communities than one year ago.
"Although demand in recent weeks has been quite choppy, in general, we continue to believe that the housing market has emerged from its darkest period of late 2008 through early 2009. ... At the moment, consumers view the economic glass as half empty: volatile financial markets, global deficit concerns and the oil spill in the Gulf are all contributing to this gloom. We believe that once the employment picture begins to brighten and the economy stabilizes, consumer confidence will improve and the housing market should begin a steadier recovery."And there you have what might be the popular Q2 meme: blame the oil spill for poor results.
Iceland: Court rules Foreign currency indexed loans illegal
by Calculated Risk on 6/16/2010 04:44:00 PM
Here is a little different story ...
From The Iceland Weather Report: Foreign currency loans deemed illegal (ht Steinn)
The Icelandic supreme court ruled this afternoon that Icelandic loans indexed to a foreign currency are illegal.From The Reykjavík Grapevine: Supreme Court Rules Loans Pinned to Foreign Currency Illegal (ht Warlock)
This is hugely significant for thousands of people in this country.
Two cases were connected to the ruling involving car loans taken from the companies Lýsingu hf. and SP-fjármögnun that were pinned to foreign currency. With the collapse of the Icelandic crown in 2008, many people who took out such loans - at a time when the crown was strong - saw their debts double almost overnight.It was apparently pretty common in Iceland for car and some home loans to be indexed to a basket of foreign currencies. However when the Iceland Krona collapsed, the borrower was stuck with a much higher payment (and debt) than expected. Apparently many borrowers in eastern European countries also borrowed using these "basket of foreign currency" indexes.
Reader Warlock mentions that these loans appeared cheaper than other loans, and were frequently used to buy expensive foreign autos - and the financing was also from abroad. Just another risk for some banks, especially if this ruling spreads to other countries.


