 RSS Feed
 by Calculated Risk on 5/11/2010 01:23:00 PM
Tuesday, May 11, 2010
Senate Passes One-Time Fed Audit
From the NY Times: Senate Backs One-Time Audit of Fed’s Bailout Role
The Senate on Tuesday voted unanimously to require a one-time audit of the Federal Reserve’s emergency actions during and after the 2008 financial crisis as part of broad legislation overhauling the nation’s financial regulatory system.This is a one time audit (as opposed to the house bill), and would also require the Fed to release a list by Dec 1, 2010 of all of the institutions that received emergency assistance during the financial crisis.
BLS: Low Labor Turnover, More Hiring in March
by Calculated Risk on 5/11/2010 10:00:00 AM
From the BLS: Job Openings and Labor Turnover Summary
There were 2.7 million job openings on the last business day of March 2010, the U.S. Bureau of Labor Statistics reported today. The job openings rate was unchanged over the month at 2.0 percent. The hires rate (3.3 percent) was little changed, and the separations rate (3.1 percent) was unchanged in March.Note: The difference between JOLTS hires and separations is similar to the CES (payroll survey) net jobs headline numbers. The CES (Current Employment Statistics, payroll survey) is for positions, the CPS (Current Population Survey, commonly called the household survey) is for people.
The following graph shows job openings (purple), hires (blue), Total separations (include layoffs, discharges and quits) (red) and Layoff, Discharges and other (yellow) from the JOLTS.
Unfortunately this is a new series and only started in December 2000.
 Click on graph for larger image in new window.
Notice that hires (blue) and separations (red) are pretty close each month. This is the level of turnover each month. Right now about 4 million people lose their jobs each month, and a little over 4 million are hired (this is the labor turnover in the economy).
When the hires (blue line) is above total separations (as in March), the economy is adding net jobs, when the blue line is below total separations, the economy is losing net jobs.
According to the JOLTS report, there were 4.242 million hires in March (SA), and 4.016 million total separations, or 226 thousand net jobs gained. The comparable CES report showed a gain of 230 thousand jobs in March (after revision).
Layoffs and discharges have declined sharply from early 2009 - and that is a good sign.
Hiring picked up in March, although the number of job openings is still very low, as is the turnover rate.
Small Business Optimism Improves in April
by Calculated Risk on 5/11/2010 08:52:00 AM
From NFIB: Small Business Optimism Index Improves in April
The National Federation of Independent Business Index of Small Business Optimism gained 3.8 points in April, rising to 90.6 and ending seven straight quarters of under 90 readings. The persistence of Index readings below 90 is unprecedented in survey history. Nine of the 10 Index components rose, particularly the outlook for general business conditions and sales, and one was unchanged. Still, job measures barely moved and capital expenditure plans were flat.The outlook has improved, and sales and earnings have picked up some, but hiring is "bleak".
“The gains are a step in the right direction, but they are not enough to signal a solid recovery is in place,” said William Dunkelberg, NFIB chief economist. “Owners are feeling a little better about things, but not enough to turn them into concrete action.”
“What small businesses need are customers, giving them a reason to hire and make capital expenditures and borrow to support those activities,” said Dunkelberg. “Bottom line, the recovery will be sub-par in comparison to the recoveries we experienced following past severe recessions such as 1980-82."Note: although the press release doesn't mention it, there is a heavy concentration of construction related businesses in the small business sector - and obviously that is one of the weakest areas.
Monday, May 10, 2010
Small Business hiring "Bleak"
by Calculated Risk on 5/10/2010 10:43:00 PM
Note: this is the employment section of the April survey that will be released Tuesday.
From the WSJ: At Small Businesses, Hiring Still Drags
April marked the 27th consecutive month in which small businesses either shed more or the same number of jobs that they added, according to a monthly survey to be released Tuesday by the National Federation of Independent Business, a trade group in Washington, D.C. Since July 2008, employment per firm has fallen steadily each quarter, logging the largest reductions in the survey's 35-year history. Going forward, more small-business owners say they plan to eliminate jobs compared with those that expect to create new jobs over the next three months.And from the National Federation of Independent Business: Jobs Picture Still Bleak for Small Business
“The steep recession will unlikely be followed by a steep recovery, the numbers just aren’t moving in that direction. [said William C. Dunkelberg, chief economist for the National Federation of Independent Business] "April marks the 27th consecutive ‘no new jobs’ monthly reading."
“There is little enthusiasm among owners to hire more workers, primarily due to continued weak sales trends.”
60 Minutes on Walking Away
by Calculated Risk on 5/10/2010 07:11:00 PM
Here is a 60 Minutes piece on Walking Away, aka 'Strategic Defaults' and as ' Ruthless Defaults' by lenders. (ht Michael).
Just a note - anyone considering this should talk to an attorney, and they should also talk with their lender. If it can be arranged, a short sale is much better than a foreclosure for all parties ...
Fannie, Freddie, FHA REO Inventory Surges 22% in Q1 2010
by Calculated Risk on 5/10/2010 03:55:00 PM
The combined REO (Real Estate Owned) inventory for Fannie, Freddie and the FHA increased by 22% in Q1 2010 from Q4 2009. The REO inventory (foreclosed homes) increased 59% compared to Q1 2009 (year-over-year comparison). Click on graph for larger image in new window.
This graph (ht Tom Lawler) shows the REO inventory for Fannie, Freddie and FHA through Q1 2010.
Even with all the delays in foreclosure, the REO inventory has increased sharply over the last three quarters, from 135,868 at the end of Q2 2009, to 153,007 in Q3 2009, 172,357 at the end of Q4 2009 and now 209,500 at the end of Q4 2010.
These are new records for all three agencies.
Remember this is just a portion of the total REO inventory. Private label securities and banks and thrifts hold an even larger number of REOs. For more, see Tom Lawler's earlier post: REO: Agencies vs. Private Label and from James Hagerty at the WSJ in March writing about a Barclays Capital report: Supply of Foreclosed Homes on the Rise Again.
SEC: Exchanges agree on "structural framework" to strengthen circuit breakers
by Calculated Risk on 5/10/2010 02:16:00 PM
From the SEC: Statement on Meeting With Exchanges
"This morning, SEC Chairman Mary Schapiro had a constructive meeting with the leaders of six exchanges — the New York Stock Exchange, NASDAQ, BATS, Direct Edge, ISE and CBOE — and the Financial Industry Regulatory Authority to discuss the causes of Thursday's market events, the potential contributing factors, and possible market reforms.Why not use technology to slow down price changes on individual stocks? It is amazing that we still don't have an explanation for the weird price changes last Thursday.
"As a first step, the parties agreed on a structural framework, to be refined over the next day, for strengthening circuit breakers and handling erroneous trades."
Report: 11.2 Million U.S. Properties with Negative Equity in Q1
by Calculated Risk on 5/10/2010 11:23:00 AM
First American CoreLogic released the Q1 2010 negative equity report today.
CoreLogic reported today that more than 11.2 million, or 24 percent, of all residential properties with mortgages, were in negative equity at the end of the f irst quarter of 2010, down slightly from 11.3 million and 24 percent from the fourth quarter of 2009. An additional 2.3 million borrowers had less than five percent equity. Together, negative equity and near-negative equity mortgages accounted for over 28 percent of all residential properties with a mortgage nationwide.From the report:
Negative equity continues to be concentrated in five states: Nevada, which had the highest percentage negative equity with 70 percent of all of its mortgaged properties underwater, followed by Arizona (51 percent), Florida (48 percent), Michigan (39 percent) and California (34 percent). Las Vegas remains the top ranked CBSA with 75% of mortgaged properties being underwater, followed by Stockton (65%), Modesto (62%), Vallejo-Fairfield (60%) and Phoenix (58%). Phoenix had more than 550,000 underwater borrowers, the most households of any metropolitan market in the country. Riverside (463,000), Los Angeles (406,000) Atlanta (399,000) and Chicago (365,000) round out the top five markets.
 Click on image for larger graph in new window.
This graph shows the negative equity and near negative equity by state.
Although the five states mentioned above have the largest percentage of homeowners underwater, 10 percent or more of homeowners have negative equity in 33 states and the D.C., and over 20% have negative equity or near negative equity in 23 states and D.C. This is a widespread problem.
Note: Louisiana, Maine, Mississippi, South Dakota, Vermont, West Virginia and Wyoming are NA on the graph above.
 The second graph shows the distribution of homeowners with a mortgage with near or negative equity.
The share of borrowers whose mortgage debt exceeds the property value by 25% or more fell slightly to 10.4% or 4.9 million borrowers, down from 10.6% or 5 million borrowers. The aggregate dollar value of negative equity for these deeply underwater borrowers was $656 billion dollars.Research has shown that once negative equity exceeds 25 percent "owners begin to default with the same propensity as investors", and it is these 4.9 million borrowers - with $656 billion in debt - that are most at risk for foreclosure.
Fannie Mae: $11.5 billion loss, sees no profits for "indefinite future"
by Calculated Risk on 5/10/2010 08:58:00 AM
For a EU / ECB summary, please see previous post: Euro Summary
From Fannie Mae:
Fannie Mae (FNM/NYSE) reported a net loss of $11.5 billion in the first quarter of 2010, compared with a net loss of $15.2 billion in the fourth quarter of 2009. Including $1.5 billion of dividends on our senior preferred stock held by the U.S. Department of Treasury, the net loss attributable to common stockholders was $13.1 billion ...Foreclosure activity is increasing:
We acquired 61,929 single-family real estate-owned properties through foreclosure in the first quarter of 2010, compared with 47,189 in the fourth quarter of 2009. As of March 31, 2010, our inventory of single-family real estate owned properties was 109,989, compared with 86,155 as of December 31, 2009.Greg Morcroft at MarketWatch reports:
Fannie sees no profits for the "indefinite future" ... financial sustainability uncertain.Here is the monthly Fannie Mae seriously delinquent graph through February ...
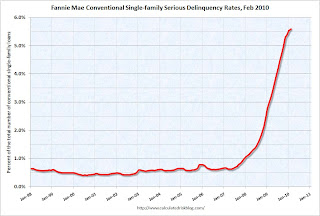 Click on graph for larger image in new window.
Fannie Mae reported that the rate of serious delinquencies - at least 90 days behind - for conventional loans in its single-family guarantee business increased to 5.59% in February, up from 5.52% in January - and up from 2.96% in February 2009.
"Includes seriously delinquent conventional single-family loans as a percent of the total number of conventional single-family loans."
It does appear the increases in the delinquency rate have slowed.
Sunday, May 09, 2010
Euro Summary and Futures
by Calculated Risk on 5/09/2010 11:53:00 PM
Just a summary ... Europe and futures.
1) The EU created a €60 billion fund based on article 122 (special circumstances). The IMF will add €30 billion. Press conference archive here (40 minutes)
2) The EU will create a Special Purpose Vehicle (SPV) for 3 years based on inter government agreements. These are potential loan guarantees backed by all Euro Zone countries. This is in addition to €60 billion and will be up to €440 billion - plus a contribution from the IMF up to half of European Union contribution (up to €220 billion). The total of the two is €750 billion.
3) There are apparently agreements from Portugal and Spain to take steps to reduce their deficits.
4) The European Central Bank (ECB) announced "interventions in the euro area public and private debt securities markets (Securities Markets Programme) to ensure depth and liquidity in those market segments which are dysfunctional."
5) The Federal Reserve reopened swap lines to provide dollar liquidity.
Story Links:
From the NY Times: E.U. Details $957 Billion Rescue Package
From the WSJ: World Races to Avert Crisis in Europe
From Bloomberg: EU Crafts $962 Billion Show of Force to Halt Euro Crisis
Futures:
From CNBC, the Dow is up 225 and the S&P 500 is up about 30 points.
Asia is mostly up, the Nikkei is up 1.3% and the Shanghai Composite is off slightly.
And buried in the news, here is the weekly summary and a look ahead (with plenty of graphs).


