 RSS Feed
 by Calculated Risk on 4/11/2010 09:20:00 AM
Sunday, April 11, 2010
Report: Germany Agrees to Below Market Interest Rates for Loans to Greece
From Bloomberg: Germany Said to Accept EU Loan Compromise for Greece
Germany is prepared to give Greece loans at below-market interest rates ... a European government official said.
The loans would be priced above the rate charged by the International Monetary Fund, which would also participate in a European Union-led rescue ...
The European Commission said in an e-mailed statement that there will be a news conference today in Brussels at about 4 p.m. local time
Saturday, April 10, 2010
Shiller: "Don’t Bet the Farm on the Housing Recovery"
by Calculated Risk on 4/10/2010 10:46:00 PM
From Robert Shiller in the NY Times: Don’t Bet the Farm on the Housing Recovery
MUCH hope has been pinned on the recovery in home prices that began about a year ago. A long-lasting housing recovery might provide a balm to households, mortgage lenders and the entire United States economy. But will the recovery be sustained?Momentum only goes so far. And I think it is likely that prices will fall further in many bubble areas later this year as more distressed properties hit the market.
Alas, the evidence is equivocal at best.
The most obvious reason for hope is that, unlike stock prices, home prices tend to show a great deal of momentum.
Shiller also argues prices might fall:
Consider some leading indicators. The National Association of Home Builders index of traffic of prospective home buyers measures the number of people who are just starting to think about buying. In the past, it has predicted market turning points: the index peaked in June 2005, 10 months before the 2006 peak in home prices, and bottomed in November 2008, six months before the 2009 bottom in prices.Usually I graph the total NAHB Housing Market Index. Here is a graph of the NAHB traffic of prospective buyers and two home prices indexes: the Case-Shiller Composite 10 (seasonally adjusted) and First American Corelogic's LoanPerformance HPI (NSA).
The index’s current signals are negative. After peaking again in September 2009, it has been falling steadily, suggesting that home prices may have reached another downward turning point.
 Click on graph for larger image in new window.
Although Shiller is correct about traffic index peaking in 2005 and declining sharply in 2006 (when prices started to fall), I think this isn't a reliable indicator of future house price movements. I think a better indicator that prices were about to decline in 2006 was the rapid rise in inventories in the 2nd half of 2005 and into 2006 - and I think we should watch inventory levels again this year.
I think the NAHB does provide hints about housing starts.
 This second graph compares the NAHB HMI (left scale) with single family housing starts (right scale). This includes the March release for the HMI and the February data for starts.
This shows that the HMI and single family starts mostly move generally in the same direction - although there is plenty of noise month-to-month.
For house prices, I think we need to watch inventory levels - especially distressed inventory.
Shiller concludes:
Recent polls show that economic forecasters are largely bullish about the housing market for the next year or two. But one wonders about the basis for such a positive forecast.
Momentum may be on the forecasts’ side. But until there is evidence that the fundamental thinking about housing has shifted in an optimistic direction, we cannot trust that momentum to continue.
Hamilton: "Do rising oil prices threaten the economic recovery?"
by Calculated Risk on 4/10/2010 05:17:00 PM
From Professor Hamilton at Econbrowser: Do rising oil prices threaten the economic recovery?
Ten of the 11 recessions in the United States since World War II have been preceded by a sharp increase in the price of crude petroleum. Oil had been holding around $80/barrel over the last month, but traded as high as $87 last week, leading the Financial Times to ask whether oil could give the "kiss of death to recovery." Here is how I would answer that question.See Hamilton's post for his analysis with several graphs. He concludes:
$87 oil is certainly not helping the recovery. But I would be very surprised if it proves to be the kiss of death.And with the opposite view from the Financial Times article:
Olivier Jakob, of Swiss consultant Petromatrix, said in a note that the “recovery of 2009 was fuelled with crude oil at $62 a barrel, not at $90 a barrel or $100 a barrel. We fear that the latest run on WTI will be the kiss of death for a global economy that was trying to avoid the possibility of a double-dip recession.”I tend to agree with Dr. Hamilton. However I also vehicle watch miles driven from the Department of Transportation (DOT), and the DOT recently reported that vehicle miles driven in January were down from January 2009:
excerpted with permission
Travel on all roads and streets changed by -1.6% (-3.7 billion vehicle miles) for January 2010 as compared with January 2009. Travel for the month is estimated to be 222.8 billion vehicle miles.Here is a repeat of the graph I posted last month:
 Click on graph for larger image in new window.
This graph shows the percent change from the same month of the previous year as reported by the DOT.
As the DOT noted, miles driven in January 2010 were down -1.6% compared to January 2009, and miles driven have declined 2.9% compared to January 2008, and are down 4.7% compared to January 2007.
If miles driven continues to decline, I'll be more concerned about oil prices.
Planet Money interview with NY Fed President Dudley
by Calculated Risk on 4/10/2010 01:01:00 PM
From Adam Davidson, Chana Joffe-Walt and Jacob Goldstein at Planet Money: The Friday Podcast: New York Fed Chief, Bubble Fighter
And here is the transcript of the interview: New York Fed Chief: We Should 'Try To Identify Bubbles'. An excerpt:
MR. DUDLEY: I mean, my view is not so much that we are going to prevent all asset bubbles. I think that's unrealistic. But what we might be able to do is prevent the asset bubbles from being quite so big and maybe preventing the consequences of the asset bubbles from when they burst being quite so bad.There were quite a few people arguing that the regulators should tighten standards in 2004 and 2005. And I don't think Dudley should focus on subprime mortgage - there were weak underwriting standards in Prime and Alt-A residential mortgages, commercial real estate, and many other areas.
So imagine in the last few years if, let's say, a much tougher approach had been taken to subprime underwriting. So we basically said, you can't have no-doc loans. You have to have restrictions on loan-to-value ratios. You have to make sure the subprime loans that the people actually can afford them once their teaser rates periods end.
Q: Crazy ideas. Why would you want to do any of that?
MR. DUDLEY: If you had done all those things -- if you had done all those things, I would speculate that -- if all those had been in place, there would have been less credit that had flowed into the housing sector, housing prices would have gone up less far and when the whole situation reversed, we'd see a less severe decline in housing prices, less stress on the financial system and therefore less stress on the macro-economy.
So it seems to me that, you know, obviously, hindsight is 20-20. But it seems to me with the benefit of hindsight, it seems like things could have been done to restrain the asset price movements in a way that would have generated a more stable financial system and a more stable macro-economy.
Oh, and one final excerpt (based on Bear Stearns assets):
Q: So just one very last question. We actually called one of the REO properties, a mall in Oklahoma that's in default. And I don't know how to say this other than as inarticulately as, it just blows my mind to think that we could call a mall in Oklahoma and realize their owner is the Fed. Just how do you feel when you think about that? It's such a weird thing.
...
MR. DUDLEY: I did not expect as president of the New York Federal Reserve that I'd be having to worry about a mall in Oklahoma City.
Office Vacancy Rate hits 17.7% in San Francisco
by Calculated Risk on 4/10/2010 08:59:00 AM
The following article makes a couple of key points: 1) office vacancy rates are still rising as leases expire, and 2) new construction has essentially stopped - and there will probably be little new office construction for a number of years. That is also what the Architecture Billings Index, a leading indicator for commercial real estate (CRE) suggests ...
From Robert Selna at the San Francisco Chronicle: Office vacancy rate rises in San Francisco
The 13 million square feet of available space in the first quarter of 2010 translates to a 17.7 percent office vacancy rate, up from 14.7 percent a year ago and nearly one percentage point from the previous quarter ending in December, according to data released Friday by the real estate firm Jones Lang LaSalle.
...
Boston's commercial district has a vacancy rate of 18.4 percent and Chicago's is 16.3 percent, according to Jones Lang LaSalle.
...
[Colin Yasukochi, research director at Jones Lang LaSalle] said that only one office building, located in Mission Bay, is currently under construction.
Friday, April 09, 2010
Unofficial Problem Bank List at 682
by Calculated Risk on 4/09/2010 10:25:00 PM
This is an unofficial list of Problem Banks compiled only from public sources. Here is the unofficial problem bank list for April 9, 2010.
Changes and comments from surferdude808:
This week the Unofficial Problem Bank List stands at 682 institutions with assets of $364 billion compared with 683 institutions with assets of $361 billion last week. There are seven removals including one failure -- Beach First National Bank ($602 million), and six unassisted mergers that have happened during the first quarter. However, two of the unassisted deals were just a combination of weak affiliates as the survivor is still on the list. For example, on March 1, 2010 Community Banks of Northern California merged with its sister bank Community Banks of Colorado ($1.7 billion), which is subject to a formal enforcement action by the Federal Reserve.
There are six additions this week with aggregate assets of $3.3 billion. Additions include PremierWest Bank, Medford, OR ($1.5 billion Ticker: PRWT); First Commercial Bank of Florida, Orlando, FL ($669 million); and Cornerstone Community Bank, Chattanooga, TN ($530 million Ticker: CSBQ.OB)
We have updated the transition matrix for the first appearance of the Unofficial Problem Bank List on August 7, 2009. (see below) Back then, the list had 389 institutions with assets of $276.3 billion. Subsequently, 296 institutions or 76 percent still remain open with an outstanding formal enforcement action.
Approximately 24 percent or 93 institutions have been removed from the initial list. The majority of the removals have occurred through failure (70 institutions or 75 percent of removals). Other removals are for action termination or a return to healthy status (16 institutions or 17 percent of removals) and unassisted mergers (7 institutions or 7.5 percent of removals).
So far, the failure rate for institutions on the initial list is approximately 18 percent (70 institutions/389 institutions). This failure rate is higher than the historical 13 percent rate mentioned by the FDIC and frequently cited by the media (see links):
From CNNMoney: Banks at risk of going bust tops 700
From CNNMoney: Bank 'problem' list climbs to 552
Video: Problem Bank List Growing (listen to analyst quoting FDIC historical rate)
We have long suspected that the often cited historical failure rate of 13 percent for institutions on the problem bank list was a bit misleading for the current crisis because it is most likely derived from a long time series that includes non-crisis periods. Thus, the FDIC historical metric cannot be used to estimate how many institutions on the problem bank list during this crisis will fail. Already, the failure rate is 18 percent, which is five percentage points above the historical rate. Moreover, it can only go higher for institutions on the initial list. Therefore, anyone that continues to cite this statistic, especially to downplay the magnitude of having 700 institutions on the official list, is badly misinformed.
Interestingly, in an interview with Time Magazine, FDIC Chairman Shelia Bair is now citing a higher failure rate of 23 percent for institutions on the problem bank list. In addition, Chairman Bair sounds more sanguine on the outlook for failures and predicts they peak in 2010 at a rate not much higher than 2009. See comments from a Time Magazine interview published April 9, 2010: FDIC's Sheila Bair on Bank Failures and Too-Big-To-FailTime: We saw 140 bank failures in 2009; another 41 so far this year. Is the worst behind us?
Bair: I think we'll go above the 2009 level, but that bank failures will peak this year. The institutions by asset size might be a little smaller, but there will be more of them. But it's important that people understand that the number of bank failures is still a very small percentage of the overall number of insured institutions in the country — and obviously their insured deposits are protected.
Time: How many banks are on your watch list right now?
Bair: There are about 700 right now, but most of these banks will not fail. Historically, about 23% of banks that go on the list actually fail. One of the reasons we put them on the troubled bank list is so that they can get some extra supervisory attention and...get nursed back to health.
| Unofficial Problem Bank List | |||
|---|---|---|---|
| Change Summary | |||
| Number of Institutions | Assets ($Thousands) | ||
| Start (8/7/2009) | 389 | 276,313,429 | |
| Subtractions | |||
| Action Terminated | 16 | (2,932,948) | |
| Unassisted Merger | 7 | (988,349) | |
| Failures | 70 | (120,826,006) | |
| Asset Change | (12,544,845) | ||
| Still on List at 4/02/2010 | 296 | 139,021,281 | |
| Additions | 387 | 222,013,694 | |
| End (4/02/2010) | 683 | 361,034,975 | |
| Interperiod Deletions1 | |||
| Action Terminated | 0 | - | |
| Unassisted Merger | 5 | 1,184,165 | |
| Failures | 38 | 39,300,874 | |
| Total | 43 | 40,485,039 | |
| 1Institution not on 8/7/2009 or 4/02/2010 list but appeared on a list between these dates. | |||
FDIC Bank Failure #42: Beach First National Bank, Myrtle Beach, South Carolina
by Calculated Risk on 4/09/2010 05:10:00 PM
When the tide it does recede
Taxpayers stranded
by Rob Dawg
From the FDIC: Bank of North Carolina, Thomasville, North Carolina, Assumes All of the Deposits of Beach First National Bank, Myrtle Beach, South Carolina
Beach First National Bank, Myrtle Beach, South Carolina, was closed today by the Office of the Comptroller of the Currency, which appointed the Federal Deposit Insurance Corporation (FDIC) as receiver. ...The FDIC gets back to work ...
As of December 31, 2009, Beach First National Bank had approximately $585.1 million in total assets and $516.0 million in total deposits. ...
The FDIC estimates that the cost to the Deposit Insurance Fund (DIF) will be $130.3 million. ... Beach First National Bank is the 42nd FDIC-insured institution to fail in the nation this year, and the first in South Carolina. The last FDIC-insured institution closed in the state was Victory State Bank, Columbia, on March 26, 1999.
The Housing Bust and Construction Employment
by Calculated Risk on 4/09/2010 02:15:00 PM
Back in 2006 some analysts argued that strong local economies (because of construction) would keep certain areas from being impacted by the housing bust. I disagreed and wrote:
As the housing bubble unwinds, housing related employment will fall; and fall dramatically in areas like the Inland Empire. The more an area is dependent on housing, the larger the negative impact on the local economy will be.Here is an update to one of the graphs I posted in 2006 (data is not seasonally adjusted):
So I think some pundits have it backwards: Instead of a strong local economy keeping housing afloat, I think the bursting housing bubble will significantly impact housing dependent local economies.
 Click on graph for larger image in new window.
This graph shows the percentage of construction payroll jobs in three areas of California: San Diego, Riverside (Inland Empire), and Sacramento. The California percentages exclude the three metropolitan areas.
Sure enough, generally the areas with the largest price declines and total lost jobs, were the areas with the highest percentage of construction employment during the boom. As an example, total employment in the Inland Empire is off 14.3% compared to 10.4% for all of California.
I also took a look at some of the Case-Shiller cities. The next graph shows the price declines from the peak for each city included in S&P/Case-Shiller indices (NSA).
 Unfortunately the BLS doesn't break out construction employment for Denver, Dallas or Charlotte (the cities with the smallest Case-Shiller house price declines).
 So I compared Boston (4th smallest price decline) with Las Vegas and Phoenix with the largest price declines. I added Texas because of the minimal housing bust in that state.
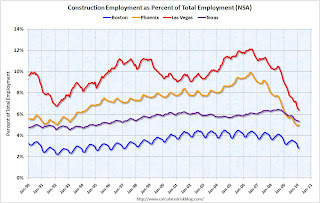 Sure enough - the cities with the highest level of construction employment were hit the hardest. Boston has a fairly low percentage of construction jobs and a fairly mild bust. In Texas there are a fair number of construction jobs, but there wasn't a huge surge in construction (construction in Texas is probably heavily commercial).
In Las Vegas total employment is down 14.6%, and in Phoenix employment is off 12.9%, but in Boston total employment only declined 7% - and only 4.9% in Texas.
This was all part of the cycle. Rising prices meant more home construction - and more construction meant more construction employment and that meant more homebuyers. When the bust came, many of these workers lost their jobs, and then their homes, and that put additional pressure on the local housing markets. So it was pretty easy to tell in 2006 which areas would get crushed.
Fannie Mae Official: Hoocoodanode?
by Calculated Risk on 4/09/2010 11:03:00 AM
From Ron Orol (updated) at MarketWatch: Fannie Mae official: We were surprised by extent of crisis. First the obligatory "no one saw it coming" comment:
"Few if any predicted the unusual and rapid destruction of real estate values that occurred," Robert Levin, former Executive Vice President and Chief Business Officer of Fannie Mae told a financial crisis inquiry panel.And the real argument:
"In hindsight, if we and the industry as a whole had been able to appreciate the nature and extent of the crisis, it is clear we all would have conducted our business differently during this period, but we like everyone else were surprised by the unprecedented extent of the economic crisis."
During the build up to the financial crisis the two entities were hybrid public private entities - so-called government-sponsored entities -- that had goals of increasing their stock price and competing with Wall Street at the same time as they met low-income housing goals set by the Department of Housing and Urban DevelopmentYes, the worst loans - by far - were in the private label MBS issued by Wall Street. But the Fannie and Freddie structure - that privatized profits and socialized losses - incentivized executives at Fannie and Freddie to compete with Wall Street.
Levin and Mudd argued that in a key period, in 2005 and early 2006, the dollar volume of private label mortgage securities issued by Wall Street outpaced mortgages securities issued by Fannie Mae, Freddie Mac and Ginnie Mae combined.
Note: It is the one year anniversary of the comment section called "Hoocoodanode?" - (Who could of known?) - a running joke on this blog for several years. Thanks to Ken for the awesome site - and to all the great contributors in the comments. Try it out!
Bank Failures and Puerto Rico
by Calculated Risk on 4/09/2010 08:49:00 AM
It appears the FDIC is getting closer to taking action in Puerto Rico.
Back in February, José Carmona and John Marino at caribbeanbusinesspr.com wrote: Feds expected to take action against island banks next month and last month from Dow Jones: FDIC Seeks Buyers for Three Puerto Rican Banks
Joe Adler explains some of the complications in Puerto Rico writing in American Banker: Puerto Rico Forces FDIC to Scramble
Three banks on the island holding more than $20 billion of assets are in trouble ... The banks — $12 billion-asset Westernbank Puerto Rico, $6 billion-asset R-G Premier Bank of Puerto Rico and $2.6 billion-asset Eurobank — account for nearly a quarter of the assets on the island ...It appears the remaining healthy banks in Puerto Rico don't have the capacity to acquire these troubled banks - and most banks not in Puerto Rico just aren't interested.
Many observers said the FDIC cannot afford to deal with each failure individually. ... if the FDIC needs to resolve all three institutions at the same time, it may face a shortage of buyers. ...
Moreover, the large mainland banking companies ... have all but abandoned Puerto Rico. ... "There hasn't been a lot of interest from banks who aren't already in Puerto Rico," said Joe Gladue, an analyst with B. Riley & Co. Inc.


