 RSS Feed
 by Calculated Risk on 3/17/2009 03:40:00 PM
Tuesday, March 17, 2009
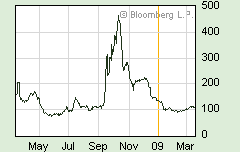
Thornburg Mortgage may file bankruptcy
From Reuters: Thornburg Mortgage may file Chapter 11 bankruptcy
Thornburg Mortgage ... a large and troubled provider of "jumbo" mortgage loans, on Tuesday said it may file for Chapter 11 bankruptcy protection.We're all subprime now!
...
A bankruptcy filing would make Thornburg one of the largest U.S. mortgage providers to seek protection from creditors since the housing slump began ...
Thornburg has specialized in making mortgages larger than $417,000 to borrowers with good credit ...
Last March, Thornburg arranged a $1.35 billion bailout from the distressed debt investor MatlinPatterson Global Advisors LLC and other investors to stay out of bankruptcy.
According to a Tuesday regulatory filing, MatlinPatterson surrendered all of its Thornburg common stock -- 120.8 million shares -- on March 12 and 16 without any compensation. ...
DataQuick: SoCal Home Sales Up, Foreclosure Resales 56.4% of Market
by Calculated Risk on 3/17/2009 01:18:00 PM
Note: I ignore the median price data because it is skewed by the mix of homes sold. A repeat sales index like Case-Shiller is a better indicator of price changes.
From DataQuick: Southland home sales outpace last year again; median price steady
Southland home sales stayed above year-ago levels for the eighth consecutive month in February ... Market activity was dominated by bargain-hunting in affordable neighborhoods while buying and selling in more expensive established areas remained largely on hold ...Sales are up because of foreclosure resales in less expensive neighborhoods. Meanwhile, sales in "more expensive established areas" have slowed to a trickle. This build up in supply will eventually lead to more price declines in the expensive areas ...
A total of 15,231 new and resale homes sold in Los Angeles, Riverside, San Diego, Ventura, San Bernardino and Orange counties last month. That was essentially unchanged from 15,227 for January, and up 41.3 percent from 10,777 for February 2008, according to MDA DataQuick of San Diego.
...
Regionwide, foreclosure resales accounted for 56.4 percent of February’s resales activity, which was the same as the revised January figure and up from 36.2 percent in February 2008.
Credit Crisis Indicators
by Calculated Risk on 3/17/2009 10:58:00 AM
Here is a quick look at a few credit indicators:
First, the British Bankers' Association reported that the three-month dollar Libor rates were fixed at 1.30%, down from 1.31% on Monday. This has been a slight improvement over the last week. Click on table for larger image in new window.
The first graph shows the spread between 30 year Moody's Aaa and Baa rated bonds and the 30 year treasury.
There has been some increase in the spread the last few weeks, but the spread is still way below the recent peak. The spreads are still very high, even for higher rated paper, but especially for lower rated paper.
The Moody's data is from the St. Louis Fed:
Moody's tries to include bonds with remaining maturities as close as possible to 30 years. Moody's drops bonds if the remaining life falls below 20 years, if the bond is susceptible to redemption, or if the rating changes.
 There has been improvement in the A2P2 spread. This has declined to 0.84. This is far below the record (for this cycle) of 5.86 after Thanksgiving, but still above the normal spread.
This is the spread between high and low quality 30 day nonfinancial commercial paper.
 | Meanwhile the TED spread has decreased a little over the last week, and is now at 107.5. This is the difference between the interbank rate for three month loans and the three month Treasury. The peak was 463 on Oct 10th and a normal spread is around 50 bps. |
 This graph shows the at the Merrill Lynch Corporate Master Index OAS (Option adjusted spread) for the last 2 years.
This is a broad index of investment grade corporate debt:
The Merrill Lynch US Corporate Index tracks the performance of US dollar denominated investment grade corporate debt publicly issued in the US domestic market.The recent surge in this index was a cause for alarm, but the index appears to have stabilized over the last week.
All of these indicators are still too high, but at least none of them are increasing this week.
Housing Starts Rebound
by Calculated Risk on 3/17/2009 08:30:00 AM
 Click on graph for larger image in new window.
Total housing starts were at 583 thousand (SAAR) in February, well off the record low of 477 thousand in January (the lowest level since the Census Bureau began tracking housing starts in 1959).
Single-family starts were at 357 thousand in February; just above the record low in January (353 thousand).
Permits for single-family units increased in February to 373 thousand, suggesting single-family starts could increase in March.
Here is the Census Bureau report on housing Permits, Starts and Completions.
Building permits increased slightly:
Privately-owned housing units authorized by building permits in February were at a seasonally adjusted annual rate of 547,000. This is 3.0 percent (±3.5%)* above the revised January rate of 531,000, but is 44.2 percent (±1.2%) below the revised February 2008 estimate of 981,000.On housing starts:
Single-family authorizations in February were at a rate of 373,000; this is 11.0 percent (±2.1%) above the January figure of 336,000.
Privately-owned housing starts in February were at a seasonally adjusted annual rate of 583,000. This is 22.2 percent (±13.8%) above the revised January estimate of 477,000, but is 47.3 percent (±5.3%) below the revised February2008 rate of 1,107,000.And on completions:
Single-family housing starts in February were at a rate of 357,000; this is 1.1 percent (±11.0%)* above the January figure of 353,000.
Privately-owned housing completions in February were at a seasonally adjusted annual rate of 785,000. This is 2.3 percent (±14.8%)* above the revised January estimate of 767,000, but is 37.3 percent (±7.7%) below the revised February 2008 rate of 1,251,000.Note that single-family completions are still significantly higher than single-family starts. This is important because residential construction employment tends to follow completions, and completions will probably decline further.
Single-family housing completions in February were at a rate of 505,000; this is 8.2 percent (±11.8%)* below the January figure of 550,000.
One month does not make a trend - and the graph shows this is just a slight increase in total starts (and single family starts are basically flat with the record low). However I do expect housing starts to bottom sometime in 2009.
Monday, March 16, 2009
Obama Administration Hoping to Avoid Auto Bankruptcies
by Calculated Risk on 3/16/2009 09:58:00 PM
From the WSJ: Obama Seeks to Avoid Auto Bankruptcies
The leaders of President Barack Obama's auto task force are focused on restructuring General Motors Corp. and Chrysler LLC outside of bankruptcy court ...Meanwhile: Chrysler Presses Request for Loans. Just another $5 billion by the end of the month ...
...
"It sometimes becomes a necessary place for some companies, but it's certainly not a desired place and it is certainly not our goal to see these companies in bankruptcy, particularly considering the consumer-facing nature of their businesses," [Steven Rattner, a private-equity executive leading the team] said in an interview.
...
By the end of the month, the government plans to lay out its view on the companies' viability and what the industry should look like in future years, Mr. Rattner said.
Credit Card Defaults at 20 Year-High
by Calculated Risk on 3/16/2009 07:56:00 PM
From Reuters: U.S. credit card defaults rise to 20 year-high
U.S. credit card defaults rose in February to their highest level in at least 20 years, with losses particularly severe at American Express ... and Citigroup ...The Treasury and Federal Reserve haven't publicly released the indicative loss rates for various asset classes associated with the two stress test economic scenarios (baseline and more adverse), but these numbers are probably approaching the "more adverse" scenario range for credit cards.
AmEx ... said its net charge-off rate ... rose to 8.70 percent in February from 8.30 percent in January.
... Citigroup Inc (C.N) ... default rate soared to 9.33 percent in February, from 6.95 percent a month earlier ...
...
Chase ... reported its charge-off rate rose to 6.35 percent in February from 5.94 percent in January. ...
Capital One Financial Corp's ... default rate increased to 8.06 percent in February from 7.82 percent in January.
...
Analysts estimate credit card chargeoffs could climb to between 9 and 10 percent this year from 6 to 7 percent at the end of 2008.
Comparing the NAHB Housing Market Index and New Home Sales
by Calculated Risk on 3/16/2009 06:06:00 PM
Here is a comparison of the National Association of Home Builders (NAHB) Housing Market Index and new home sales from the Census Bureau. Since new home sales are released with a lag, the NAHB index provides a possible leading indicator for sales.
Note: the NAHB index released this morning was for a March survey. New Home sales for February will be released on March 25th - so the NAHB is released almost 6 weeks ahead of the corresponding sales numbers. Click on graph for larger image in new window.
This shows that major tops and bottoms (green arrows) for the two series line up pretty well (usually within 1 month). However both series are noisy month to month, and there are plenty of head fakes in between the significant peaks and troughs. Also the new home sales data is revised significantly (this graph uses revised data).
Just something to watch going forward ...
FASB to Propose Changes to Mark-to-Market
by Calculated Risk on 3/16/2009 03:46:00 PM
From Bloomberg: FASB Moves Toward Giving Banks More Flexibility on Fair-Value (ht Justin)
The Financial Accounting Standards Board, pressured by lawmakers to change the fair-value rule blamed for worsening the financial crisis, proposed permitting companies to use “significant judgment” in valuing assets.From the American Bankers Association: Breaking News: FASB to Propose Improvements to Mark-to-Market, OTTI
Companies would be able to apply the revised rule to their first-quarter financial statements, FASB Chairman Robert Herz said today during a meeting at the U.S. accounting rulemaker’s Norwalk, Connecticut, headquarters. The board is set to vote on the proposal April 2, after a 15-day public comment period. ...
Mark-to-Market. The proposal for estimating market values will take into consideration whether there is an active market (such as the number of recent transactions, whether price quotes are based on current information, whether price quotes vary substantially, etc.). If there is not an active market, then the quoted price is a distressed transaction unless certain other conditions exist. For distressed transaction prices, “Level 3” techniques (such as present values of future cash flows) are used instead of the distressed prices and should reflect an orderly transaction between market participants, including a reasonable profit margin for uncertainty in a non-distressed situation.
Other-Than-Temporary-Impairment. FASB will also propose that the full market loss continue to be reported through earnings (and capital) only if the entity intends to sell or will be required to sell the security prior to its recovery. For all other OTTI, the amount of market loss will be split between the credit portion of the loss, which will be reported in earnings, and the remainder of the loss, which will be reported in “other comprehensive income.”
Report: Mortgage Fraud Increased in 2008
by Calculated Risk on 3/16/2009 03:21:00 PM
Update: Housing Wire has more: Mortgage Fraud at All-Time High: Report
This report appears to deal with Fraud for Housing, and not Fraud for Profit (what most people think of as mortgage fraud).
From Dina ElBoghdady at the WaPo: Mortgage Fraud Rises Even as Loans Decline
Mortgage fraud rose last year even though fewer loans were issued nationwide ... Fraud jumped by 26 percent in 2008 from the previous year, the study concluded, based on data collected from roughly 70 percent of the nation's lenders as well as mortgage insurance companies and mortgage investors. The study was prepared by the Mortgage Asset Research Institute, an arm of LexisNexis, for the Mortgage Bankers Association.Historically there have been two types of mortgage fraud: fraud for housing, and fraud for profit. The MBA/MARI report focuses on fraud for housing (and that probably includes refinance fraud because borrowers are desperate).
...
"With fewer loan originations today, the data suggest that the economic downturn may have created more desperation, causing more people than ever before to try to commit mortgage fraud," said Denise James, one of the study's authors.
The most common type of fraud continues to be application misrepresentation, which includes falsifying a borrower's income. That kind of fraud represented about 61 percent of all the reported cases last year, followed by fraud on tax returns and financial statements. The volume of reported fraud related to credit reports dropped from 9 percent to 4 percent in the past year.
...
The study noted that the spike in fraudulent activity cases can be partially attributed to more vigorous reporting and investigations.
Tanta explained this well: Unwinding the Fraud for Bubbles
There is a tradition in the mortgage business of distinguishing between two major types of mortgage fraud, called “Fraud for Housing” and “Fraud for Profit.” The former is the borrower-initiated fraud—inflating income or assets, lying about employment, etc.—that is motivated by the borrower’s desire to get housing (not the same thing as “real estate”), by means of getting a loan he or she doesn’t actually qualify for. It may require some collusion by the loan originator or appraiser, but it may not. It is usually the least expensive kind of fraud to lenders and investors, since the goal is getting (and keeping) the property, so the borrower is at least usually motivated to make the payments. The problems come about, of course, because these borrowers failed to qualify honestly for a reason. Borrower-initiated fraud loans may be considered “self-underwritten,” and such loans do have a much higher failure rate than the “lender-underwritten” ones. Their only saving grace is that the lender tends to recover more in a foreclosure than in a fraud for profit case. Penalties to the borrower rarely ever come in the form of prosecution; losing the home and becoming a subprime borrower for the next four to seven years—with the credit costs that implies—are the borrower's punishment.As Tanta noted, during the housing bubble, these two frauds merged, and that is probably not happening now. I suspect most of the fraud today is "fraud for housing" by homeowners desperate to refinance.
Fraud for profit is simply someone trying to extract cash—not housing—out of the transaction somewhere. If it is borrower-initiated fraud, it’s not a borrower who wants a house; it’s a borrower who wants to flip a piece of real estate or launder money or in some other way grab the cash and leave the lender holding the bag. Most of it, however, is initiated by a seller, real estate broker, lender, or closing agent (or all of them in collusion). It generally requires additional collusion by bribable appraisers, although it can certainly be initiated by a corrupt appraiser looking for a kickback, or can merely take advantage of a trainee or gullible appraiser. This is the flip scam, straw borrower, equity skimming, misappropriation of payoff funds, identity theft kind of fraud. It may not be as common as fraud for housing, at least in some markets, but it’s much, much more expensive to the bagholder. At minimum, the fraud-for-housing borrower wants to take clear, merchantable title to the property and maintain it at an acceptable level. That’s either unnecessary expense or (in the case of title) a hurdle to be gotten over by the fraud-for-profit participant.
NAHB Housing Market Index Still Near Record Low
by Calculated Risk on 3/16/2009 01:00:00 PM
 Click on graph for larger image in new window.
This graph shows the builder confidence index from the National Association of Home Builders (NAHB).
The housing market index (HMI) was flat at 9 in March (same as February). The record low was 8 set in January.
This is the fifth month in a row at either 8 or 9.
Note: any number under 50 indicates that more builders view sales conditions as poor than good.
Press release from the NAHB: Builder Sentiment Unchanged In March
Builder confidence in the market for newly built single-family homes remained unchanged in March as economic woes continued to take their toll on potential buyers, according to the latest National Association of Home Builders/Wells Fargo Housing Market Index (HMI), released today. The HMI held steady at 9 in March, marking a fifth consecutive month of single-digit readings.
“Home builders are hopeful that the recent economic stimulus package, and particularly the first-time home buyer tax credit that it included, will have a positive impact on consumer behavior and home sales as the prime home buying season gets underway,” said NAHB Chairman Joe Robson, a home builder from Tulsa, Okla. “But it’s still too soon to tell how much of an impact that will be, especially as builders find potential buyers are reluctant because of uncertainty about their future job security and the overall economic outlook.”
“The economy continues to be the main drag on home sales activity right now, in terms of consumer confidence across most of the country,” acknowledged NAHB Chief Economist David Crowe. “What’s more, home builders report that tight credit conditions are posing a further hurdle, especially for potential first-time buyers, while potential trade-up buyers are finding it very tough to sell their existing homes so they can make a move.”
Derived from a monthly survey that NAHB has been conducting for more than 20 years, the NAHB/Wells Fargo HMI gauges builder perceptions of current single-family home sales and sales expectations for the next six months as “good,” “fair” or “poor.” The survey also asks builders to rate traffic of prospective buyers as “high to very high,” “average” or “low to very low.” Scores for each component are then used to calculate a seasonally adjusted index where any number over 50 indicates that more builders view conditions as good than poor.
Two out of three of the HMI’s component indexes were unchanged in March, with the index gauging current sales conditions holding at 7 and the index gauging sales expectations in the next six months holding at a record-low 15. Meanwhile, the index gauging traffic of prospective buyers declined two points to 9.
Three out of four regions saw no change in their HMI reading in March. The Midwest, South and West each held at near-record lows of 8, 12, and 5, respectively. The Northeast rose a single point from a record low of 8 in February to 9 in March.


