 RSS Feed
 by Calculated Risk on 11/29/2007 08:43:00 PM
Thursday, November 29, 2007
The Run on Florida’s Local Government Investment Pool
On Nov 15th David Evans at Bloomberg wrote: Public School Funds Hit by SIV Debts Hidden in Investment Pools
What ... municipal finance managers ... across the country still haven't been told -- is that state-run pools have parked taxpayers' money in some of the most confusing, opaque and illiquid debt investments ever devised.This story led to a run on the fund, and Evans wrote today: Florida Halts Withdrawals From Local Investment Fund
These include so-called structured investment vehicles, or SIVs, which are among the subprime mortgage debt-filled contrivances that have blown up at the biggest banks in the world.
Florida officials voted to suspend withdrawals from an investment fund for schools and local governments after redemptions sparked by downgrades of debt held in the portfolio reduced assets by 44 percent.Before the run, the fund had $27 Billion in assets, and the fund was frozen today with $15 Billion remaining.
The Florida LGIP had strict investment guidelines, but unfortunately the guidelines allowed investment in asset backed commercial paper (CP) backed by prime and Alt-A mortgages.
A small percentage of the fund's investments have been downgraded and no longer meet the guidelines of the fund.
 Click on chart for larger image.
This chart shows the investments that have been downgraded below the standards of the fund. This chart shows losses of about $45 million; not much for a $27 Billion fund (0.17%). Of course with each redemption at par (the run on the fund), the percentage losses for the remaining funds grow. $45 million for a $15 Billion fund is 0.3%. Considering the fund was paying investors 5.77%, even a 0.3% loss is not horrible.
However there are serious questions about the investment decisions of the pool. And there are other investments that could go bad. As an example the Fund invested $650 million in certificates of deposit in Countrywide Bank - with the recent redemptions that investment now amounts to over 4% of the pool's assets - and there is some risk that Countrywide could go under.
The two main concerns are: 1) Will there be a run on other investment pools? and 2) If other funds stop investing in asset backed CP, this might further the credit crunch and increase spreads for other products.
ETrade ABS Haircuts
by Calculated Risk on 11/29/2007 07:26:00 PM
Brian has dug up the value of the ETrade ABS as of Sept 30, 2007. The assets included a substantial amount of prime residential first liens.
Here is Brian's spreadsheet: Etrade Haircut Spreadsheet
He would appreciate comments on the haircuts.
The importance of these marks can't be overstated.
From Dow Jones: E*Trade's CDO Sale May Mean Lower Values For Bank Holdings (no link yet)
Hedge fund Citadel Investment Group's agreement to buy a troubled debt portfolio from E*Trade Financial Corp. ... could be bad news for banks still holding similar securities on their books.
Banks like Citigroup ... and Merrill Lynch ... "mark to model" approach produced some $36 billion in losses for banks in the third quarter ... The E*Trade deal, however, could show that losses have been worse. The discount broker sold Citadel its $3 billion portfolio of asset backed securities ... at a cut-rate price of around 27 cents on the dollar.
Florida REO: Priced Below 2002 New Home Price
by Calculated Risk on 11/29/2007 05:35:00 PM
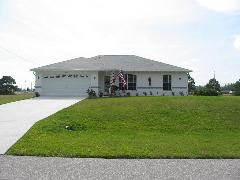 The asking price for this foreclosed property in Florida is below the price the home sold for new in 2002. (hat tip John)
Here are the details:
Feb 15, 2002: $122,300 (New)
Mar 15, 2006: $259,600
Oct 23, 2007: Foreclosed.
Current Asking Price: $99,900
There are probably some special circumstances with this house, but ... yikes! According to the public tax records, the larger house on the 2nd lot away sold for $185,300 new in 2004, and for $370,000 in 2006.
This raises some interesting questions: How far have prices really fallen?
How will the neighbors react when they discover their homes are worth far less than they paid in recent years?
As OFHEO noted today:
Declines in home prices will increase the frequency with which homeowners find themselves with no equity and thus may be motivated to “walk away” from the property and the mortgage.No kidding - this has to be depressing for the neighbors. Note: I rarely mention Florida, but this is worth noting.
Florida Freezes Fund Withdrawals
by Calculated Risk on 11/29/2007 04:16:00 PM
UPDATE: This Bloomberg Special Report has more info: Florida Suspends Withdrawals From Investment Pool (hat tip Andrew)
The pool had $3 billion of withdrawals today alone, putting assets at $15 billion, said Coleman Stipanovich, executive director of the State Board of Administration. The board manages the pool along with other short-term investments and the state's $137 billion pension fund.Original post from the WSJ: Florida Moves to Halt Run on Fund
``If we don't do something quickly, we're not going to have an investment pool,'' said Stipanovich at the meeting in the state capitol in Tallahassee. The fund was the largest of its kind, managing $27 billion before this month's withdrawals.
Local governments including Orange County and Pompano Beach that use the pool like a money-market fund asked for their money back after the State Board of Administration disclosed in a report earlier this month that holdings in the fund were lowered to below investment grade.
...
The pool has invested $2 billion in structured investment vehicles and other subprime-tainted debt, state records show. About 20 percent of the pool is in asset-backed commercial paper, Stipanovich said at the meeting today.
``There is no liquidity out there, there are no bids'' for those securities, he said.
Florida halted withdrawals from a $15 billion local-government fund Thursday after concerns over losses ... prompted investors to pull roughly $10 billion out of the fund in recent weeks.
The State Board of Administration met Thursday and voted to immediately freeze withdrawals ...
The decision shows how far this year's ... credit crisis has spread. Florida's Local Government Investment Pool, which had more than $27 billion in assets at the end of September, is a money-market fund that's supposed to invest in ultrasafe assets to provide participants with a secure place to stash spare cash. But even these types of funds have been hit by the widening crunch.
House Prices and Foreclosures
by Calculated Risk on 11/29/2007 02:34:00 PM
OFHEO provides a discussion of foreclosures and house prices in the Q3 House Price Index report.
The causal relationship between home prices and foreclosures is two-directional: high foreclosure activity can both cause and be caused by home price declines. Home price declines can cause foreclosures by decreasing the equity homeowners have in their properties. Mortgagors are much more likely to default on their loans if the current value of their property falls below the outstanding loan balance (i.e., their equity is zero or less). Declines in home prices will increase the frequency with which homeowners find themselves with no equity and thus may be motivated to “walk away” from the property and the mortgage.Historically foreclosure activity peaks when prices bottom. The following graph shows this relationship for California.
Home foreclosures contribute to weakening prices by introducing additional supply to the inventory of unsold homes. Compounding this influence is the fact that the sellers of foreclosed homes, frequently creditors, may be strongly averse to holding onto the property for an extended period of time. As a result, they may be willing to sell for lower prices than resident homeowners.
 Click on graph for larger image.
In the '90s, as prices fell in California, foreclosure activity (using Notice of Defaults NODs) increased. Prices bottomed in 1996, as foreclosure activity peaked.
Now imagine what will happen over the next few years as house prices fall. Foreclosure activity is already at record levels (2007 estimated on graph). Yet, as prices fall, foreclosure activity will probably continue to increase - the activity will be literally off the chart!
Back to OFHEO:
The upshot of the interrelatedness of foreclosures and house price changes is that the empirical evidence should reveal sharp differences in measured appreciation for states and cities with higher foreclosure rates. ...

Figure 1 plots recent appreciation rates and foreclosure filings by state since the third quarter of 2006. The bars reflect the relative intensity of foreclosure activity for states, where intensity is defined as the ratio of statewide foreclosure filings to the number of households. The blue squares show house price appreciation between the third quarters of 2006 and 2007. OFHEO’s “purchase-only” price index, which is constructed exclusively with sales price data, is used to estimate price changes.OFEHO's conclusion on house prices and foreclosure:
The graph clearly depicts the negative correlation over the latest year. With few exceptions, states with the lowest appreciation (i.e., greatest depreciation) tended to have the most foreclosure filings. For instance, Nevada had by far the greatest relative foreclosure activity and, at the same time, showed the third largest price decline. By contrast, states with relatively few foreclosure filings, including the Dakotas and Vermont, had relatively strong price growth of between 5 and 6 percent.
In conclusion, it should be recognized that house prices are very hard to track in housing market downturns. Empirical evidence has consistently shown that homeowners are hesitant to sell their homes for losses, often leaving their homes on the market for long periods awaiting the “right” price. Price declines may appear muted, as inventories of for-sale properties grow sharply and the properties that do sell may not fully reflect price declines that have occurred. In this environment, if the inventory of unsold properties is relatively large in high-foreclosure areas, then it may take some time for the association between foreclosures and price trends to reveal itself within cities. The best empirical estimates will only become available after the market normalizes and excess inventory has been sold.Translation: There are large price declines coming.
MGIC Tightens Alt-A
by Anonymous on 11/29/2007 12:45:00 PM
AP, via our Clyde:
MILWAUKEE (AP) -- The nation's leading mortgage insurer, MGIC Investment Corp., says it will raise prices and limit its coverage of loans made without proof of income to try to rein in growing losses. . . .You know, I actually believe that MGIC always thought stated income for wage earners was silly.
One of the bigger changes proposed announced Wednesday will limit the insurance MGIC offers people who have Alt-A loans, which generally require only limited verification of income.
MGIC will insure these loans only for people who are self-employed, the original market for them, Culver said. They have been used more recently by people who wanted to borrow more than they could really afford, resulting in losses for MGIC and other mortgage insurers, he said.
"We always thought it was silly, a wage earner who could show you a paycheck would pay a higher interest rate not to show you their paycheck," he said.
The company will raise prices on Alt-A loans, other loans worth 95 percent of a home's value and certain loans for people with low credit scores or small down payments. More specifics will be announced next week, Culver said.
What is missing here is the explanation for why they went ahead and insured something this "silly."
ETrade Sells Portfolio for 27 cents on the Dollar
by Calculated Risk on 11/29/2007 12:43:00 PM
From MarketWatch: CEO leaves as E-Trade gets $2.55 billion from Citadel
The subprime crisis claimed a new scalp Thursday, as E-Trade's CEO Mitch Caplan said he was stepping down as part of a deal that has private equity firm Citadel injecting $2.55 billion into the troubled firm.That is about 27 cents on the dollar for the ABS portfolio.
Under the deal, Citadel will end up with about a 20% stake in E-Trade after acquiring its $3 billion asset backed securities portfolio for $800 million and making other investments.
More on New Home Sales
by Calculated Risk on 11/29/2007 11:45:00 AM
First, three key points to consider on housing.
Note: For more graphs, please see my earlier post: October New Home Sales
Let's start with revisions. In August, I wrote:
The new homes sales number today [August] will probably be revised down too. Applying the median cumulative revision (4.8%) during this downtrend suggests a final revised Seasonally Adjusted Annual Rate (SAAR) sales number of 757 thousand for August (was reported as 795 thousand SAAR by the Census Bureau). Just something to remember when looking at the data.Sure enough, sales for August have been revised down to 717 thousand! The same is true for September (initially reported at 770 thousand, now revised down to 716 thousand).
The same will probably be true for the just reported October sales number of 728 thousand. It is likely the final number will be below 700K.
I believe the Census Bureau is doing a good job, but the users of the data need to understand what is happening (during down trends, the Census Bureau initially overestimates sales).
For an analysis on Census Bureau revisions, see the bottom of this post.
Next up, inventory. The Census Bureau reported that inventory was 516 thousand units. But this excludes the impact of cancellations. Currently the inventory of new homes is understated by about 100K (See this post for an analysis of the impact of cancellations on inventory).
This also means that the months of supply is understated. The Census Bureau reported the months of supply as 8.5 months. Assuming a typical downward revision, and adjusting for the impact of cancellations, the actual months of supply is probably closer to 10.5 months.
The impact of OFHEO reported falling prices on household assets. Also this morning, OFHEO reported that house prices fell in Q3. This will impact the Fed's calculation of household real estate assets. I expect household real estate assets to decline around $60 Billion in Q3. (0.3% price decline times $21 Trillion in assets).
Since Mortgage Equity Withdrawal appears to have still been strong in Q3, the percent equity will decline sharply! I believe this will start to impact the ability of homeowners to use the Home ATM in the near future.
 Click on graph for larger image.
This graph shows New Home Sales vs. Recession for the last 35 years. New Home sales were falling prior to every recession, with the exception of the business investment led recession of 2001.
This is what we call Cliff Diving!
And this shows why so many economists are concerned about a possible consumer led recession - possibly starting right now!
The second graph compares annual New Home Sales vs. Not Seasonally Adjusted (NSA) New Home Sales through October.

Typically, for an average year, about 86% of all new home sales happen before the end of October. Therefore the scale on the right is set to 86% of the left scale.
It now looks like New Home sales will be around 800 thousand - the lowest level since 1996 (758K in '96). My forecast was for 830 to 850 thousand units in 2007 and that now appears a little too high.
OFHEO: House Prices Fall in Q3
by Calculated Risk on 11/29/2007 10:38:00 AM
From OFHEO: House Prices Weaken Further in Most Recent Quarter
For the first time in nearly thirteen years, U.S. home prices experienced a quarterly decline. The OFHEO House Price Index (HPI), which is based on data from sales and refinance transactions, was 0.4 percent lower in the third quarter than in the second quarter of 2007. This is similar to the quarterly decline of 0.3 percent (seasonally-adjusted) shown in the purchase-only index. The annual price change, comparing the third quarter of 2007 to the same period last year showed an increase of 1.8 percent , the lowest four-quarter increase since 1995. OFHEO’s purchase-only index, which is based solely on purchase price data, indicates the same rate of appreciation over the last year.Finally OFHEO shows prices falling.
October New Home Sales
by Calculated Risk on 11/29/2007 10:10:00 AM
According to the Census Bureau report, New Home Sales in October were at a seasonally adjusted annual rate of 728 thousand. Sales for September were revised down substantially to 716 thousand, from 770 thousand. Numbers for July and August were also revised down.
 | Click on Graph for larger image. Sales of new one-family houses in October 2007 were at a seasonally adjusted annual rate of 728,000 ... This is 1.7 percent above the revised September rate of 716,000 and is 23.5 percent below the October 2006 estimate of 952,000. |
 | The Not Seasonally Adjusted monthly rate was 57,000 New Homes sold. There were 74,000 New Homes sold in October 2006. October '07 sales were the lowest October since 1996 (56,000). |
 | The median and average sales prices are generally declining. Caution should be used when analyzing monthly price changes since prices are heavily revised and do not include builder incentives. The median sales price of new houses sold in October 2007 was $217,800; the average sales price was $305,800. |
 | The seasonally adjusted estimate of new houses for sale at the end of October was 516,000. The 516,000 units of inventory is slightly below the levels of the last year. Inventory numbers from the Census Bureau do not include cancellations - and cancellations are once again at record levels. Actual New Home inventories are probably much higher than reported - my estimate is about 100K higher. |
 | This represents a supply of 8.5 months at the current sales rate. |
This is another VERY weak report for New Home sales. The stunning - but not surprising - downward revision to the August and September sales numbers was extremely ugly. This is the third report after the start of the credit turmoil, and, as expected, the sales numbers are very poor.
I expect these numbers to be revised down too - perhaps below 700K. More later today on New Home Sales.


