 RSS Feed
 by Calculated Risk on 9/27/2007 11:03:00 AM
Thursday, September 27, 2007
More on August New Home Sales
For more graphs, please see my earlier post: August New Home Sales Click on graph for larger image.
The first graph shows New Home Sales vs. Recession for the last 35 years. New Home sales were falling prior to every recession, with the exception of the business investment led recession of 2001. This should raise concerns about a possible consumer led recession - possibly starting right now!
The second graph compares annual New Home Sales vs. Not Seasonally Adjusted (NSA) New Home Sales through August.
Typically, for an average year, about 70% of all new home sales happen before the end of August. Therefore the scale on the right is set to 70% of the left scale.
It now looks like New Home sales will be in the low 800s - the lowest level since 1997 (805K in '97). My forecast was for 830 to 850 thousand units in 2007 and that might be a little too high.
A comment on revisions:
The Census Bureau revises the New Home sales number three times (plus annual revisions). During a housing down turn, most of the revisions from the Census Bureau are down. This is important to keep in mind when looking at a new monthly report. This chart shows the cumulative revisions for each month since sales activity peaked in July 2005 (annual revisions are not shown). The last time there was a positive cumulative revision (red column) was in September 2005.
The median change for the first revision is a decline of 1.6% (average decline of 1.8%) over the last two years.
The cumulative median change for the second revision is a decline of 3.6%.
The cumulative median change for the third revision is a decline of 4.8%. Since the last upward cumulative revision (Sept 2005), the range has been from a small decline of 0.2% in Dec '05, to a decline of almost 11% for May '06.
The new homes sales number today will probably be revised down too. Applying the median cumulative revision (4.8%) during this downtrend suggests a final revised Seasonally Adjusted Annual Rate (SAAR) sales number of 757 thousand for August (was reported as 795 thousand SAAR by the Census Bureau). Just something to remember when looking at the data.
August New Home Sales
by Calculated Risk on 9/27/2007 09:59:00 AM
According to the Census Bureau report, New Home Sales in August were at a seasonally adjusted annual rate of 795 thousand. Sales for July were revised down to 867 thousand, from 870 thousand. Numbers for May and June were also revised down. 
Click on Graph for larger image.
Sales of new one-family houses in August 2007 were at a seasonally adjusted annual rate of 795,000 ... This is 8.3 percent below the revised July rate of 867,000 and is 21.2 percent below the August 2006 estimate of 1,009,000.
The Not Seasonally Adjusted monthly rate was 68,000 New Homes sold. There were 88,000 New Homes sold in August 2006.
Aug '07 sales were the lowest August since 1995 (63,000).
The median and average sales prices were down sharply. Caution should be used when analyzing monthly price changes since prices are heavily revised and do not include builder incentives.
The median sales price of new houses sold in August 2007 was $225,700; the average sales price was $292,000.
The seasonally adjusted estimate of new houses for sale at the end of August was 529,000.
The 529,000 units of inventory is slightly below the levels of the last year.
Inventory numbers from the Census Bureau do not include cancellations - and cancellations are once again at record levels. Actual New Home inventories are probably much higher than reported - some estimate are about 20% higher.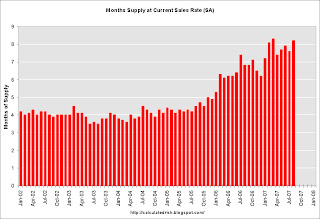
This represents a supply of 8.2 months at the current sales rate.
This is another very weak report for New Home sales. This is the first report after the start of the credit turmoil, and, as expected, the numbers are very ugly.
More later today on New Home Sales.
Who Should Pay the Rating Agencies?
by Anonymous on 9/27/2007 09:48:00 AM
From the International Herald Tribune, we see that Congress is getting up on its hind legs and barking over the perennial issue of who pays for bond ratings:
Democratic and Republican senators said they were particularly concerned with one aspect of the agencies' business models: They get paid by the companies whose bonds they rate. That is like a film production company paying a critic to review a movie, and then using that review in its advertising, said Senator Jim Bunning, Republican of Kentucky.Right. Because we all know that film critics' salaries are paid by surcharges on movie tickets, not newspaper advertising revenue. Whatever.
I really do want to know why those who believe that rating agency fees should be paid by investors, not issuers, believe that this is going to improve anything. I'm not defending the status quo; I'm legitimately curious. There's no context we can imagine in which, say, large institutional investors who pay the lion's share of those fees might not put pressure on the RAs to keep them from downgrading an outstanding issue, against which the investor doesn't really want to hold more reserves or capital? There are no transparency concerns when only those "accredited investors" who pay subscription fees can see rating benchmarks? (It's working so well for the hedge fund industry . . .) Issuers would somehow become unable to pressure the agencies for the "right" rating if they didn't directly pay those invoices? You know a clear, bright-line distinction between "issuers" and "investors" you could share with me? If Bear Stearns, say, buys tranches for its own trading account, and also issues them off its own shelf, what difference does it make which cost center cuts the checks to Moodys?
Let's contrast this situation with the highly satisfactory smooth working of consumer credit reports. The information in those reports is provided by creditors, not the individuals who are subject to them. The fee for use of that information is paid by subscribers--creditors, mostly--although they turn around and pass that cost onto applicants and borrowers. You pay the cost of lenders getting your credit report from a for-profit company who considers its information on you to be its property, not yours. In an environment of rampant identity theft and privacy violation--an environment caused, basically, by the existence of electronic repositories of sensitive data that consumers don't profit from, although they take the incalculable privacy risk--there can be no "transparency" of FICOs, and you wouldn't want there to be.
However, in an attempt to fight back, a whole industry of manipulating consumer credit ratings has sprung up, driven by both consumers wanting more or cheaper credit and lenders wanting more or more profitable borrowers. In all of this, the mortgage industry in particular is reeling from the results of its overreliance on FICOs, which were designed more for evaluating the risk of unsecured lending than mortgage lending, and that can rather easily be used to find not the most credit-worthy borrowers but the most profitable ones: those who do not default, but who run up balances sufficiently and pay enough periodic late fees to be a credit card issuer's dream come true. As more people are granted more unsecured credit by savy users of FICOs, the FICOs themselves "improve" for a class of borrowers who now want mortgage loans based on those FICOs.
Some of you may not know this, but there used to be a chronic problem with subprime mortgage servicers refusing to report data to the credit repositories. That meant that those borrowers who got a subprime loan and then paid it on time were not benefitting, since their credit record didn't show the on-time payments; when they went to refinance, they got put into another subprime loan. You would also find subprime servicers not reporting current balances, only original ones, making these borrowers look more indebted than they really were. It took Fannie and Freddie coming out with the declaration that they would no longer buy loans from seller/servicers who did not "full file report" to the credit bureaus to put a stop to this practice. Anyone who is convinced that users of ratings always have an interest in the accuracy of ratings should ponder this: there's always money to be made off of information asymmetry. It's fashionable these days to see bond investors as the hapless innocent victims of issuers and their lapdog rating agencies, but I'm old enough to have seen lenders who foot the bill for consumer credit reports going out of their way to make sure those reports didn't tell the whole picture.
I really want to know why we think subscriber-paid fees in the bond rating world is going to result in something we'll be happy with.
Thursday Close Harmony Blogging
by Anonymous on 9/27/2007 07:06:00 AM
I know, it's not Saturday yet, but CR's little caption contest below was just too tempting.
Wednesday, September 26, 2007
LA Times Photo Caption Contest
by Calculated Risk on 9/26/2007 09:06:00 PM
From the LA Times:

News item: "For 10 days now, a sagging house parked on the Hollywood Freeway's northbound shoulder in the Cahuenga Pass has had people gawking -- and talking."Some of the captions are great. My favorites:
"If you lived here, you'd be home now!"
Gary
"Halfway to Calabasas, Bob realizes his mistake and decides to mail in the keys instead."
Raughle
Subprime-Mortgage Defaults Increase
by Calculated Risk on 9/26/2007 08:50:00 PM
From Bloomberg: Subprime-Mortgage Defaults Rose Last Month, Data Show (hat tip John & Jim)
Late payments and defaults among subprime mortgages packaged into bonds rose last month ...
After August payments, 19.1 percent of loan balances in 20 deals from the second half of 2005 were at least 60 days late, in foreclosure, subject to borrower bankruptcy or backed by seized property, up from 17.5 percent a month earlier, according to a report yesterday from Wachovia Corp.
Prepayment speeds for the loans slowed, suggesting it's more difficult for borrowers to sell their homes or refinance, according to another report by New York-based analysts at UBS AG. Record levels of delinquencies and defaults on subprime mortgages are worsening as home prices decline and interest rates on loans adjust higher for the first time. As lenders tighten standards, borrowers are finding it harder to refinance into new mortgages with lower payments.
The ``reports showed the first inkling of the impact of shutdown of subprime market,'' the UBS analysts led by Thomas Zimmerman wrote late yesterday. ``In our opinion, the full impact is yet to come.''
Sallie Mae Deal in Trouble
by Calculated Risk on 9/26/2007 04:58:00 PM
From MarketWatch: Sallie Mae says deal to buy lender threatened
The group of investors that agreed to buy SLM Corp. has said that it can't close the deal under the agreed-upon terms, the giant student lender announced Wednesday.The NY Times had an article on the Sallie Mae deal last week: Deal to Buy Sallie Mae in Jeopardy
SLM, commonly known as Sallie Mae said that the group "has no contractual basis to repudiate its obligations" under the agreement, and pledged to pursue "all remedies available" to get the deal done.
While the group is hoping to renegotiate the price of Sallie Mae, these people said, it may also be willing to walk away and pay the $900 million breakup fee.The $900 million breakup fee is a little higher than the reported percentage writedowns at Lehman and Morgan Stanley. The total deal value is $25 Billion.
Graphing Housing Prices
by Calculated Risk on 9/26/2007 01:07:00 PM
My apologies to Tanta, this is my version of an UberNerd post: How to graph housing prices.
The NY Times included a graph of real house prices based on the Case-Shiller index in the following article: They Cried Wolf. They Were Right.

Click on graph for larger image in new window.
The graph has several interesting events annotated, including when economist Dean Baker sold his condo in May 2004, and Fed Chairman Ben Bernanke's comment in Feb 2006 that Fed policy makers "expect the market to cool but not to change very sharply".
Unfortunately I think this graph is somewhat misleading and technically incorrect. So I'd like to use this graph to illustrate how to graph housing prices.
This graph is based on the quarterly S&P/Case-Shiller® U.S. National Home Price Values. The S&P/Case-Shiller® index is for nominal house price (not adjusted for inflation).
To adjust for inflation, the NY Times used the CPI from the BLS. This is a slight technical error; an economist would adjust the Case-Shiller index using "CPI less shelter". Admittedly the differences are minor.
Setting Q1 1987 to 100, the NY Times calculated prices fell to 92 in Q4 1996. Using CPI less Shelter, prices would have only fallen to 93 (minor difference).
However, the NY Times calculated prices peaked at 171 in Q1 2006. Using CPI less Shelter, the peak was actually 176, about a 3% difference.
The other problem with the NY Times graph is the choice of scale without warning the reader. IMO the starting value for the y-axis should be clear. This graph is fine if the reader understands that the graph shows the changes in real values, but not the relative absolute values.
 Click on graph for larger image.
The second graph shows the same data with the scale starting at zero (the blue line is the NY Times calculation of real values, the shaded area is the technically correct calculation).
But even this graph could mislead the reader. Will prices return to 100 (the Q1 1987 price)? Unlikely. First, 1987 was chosen because that is one the Case-Shiller index starts. We do not know from this chart if prices in 1987 were too high, too low, or just about right.
Second, real prices for houses do increase over time - perhaps on the order of 1% to 2% per year. Using 1987 as a starting point, a 2% real return would have put current real prices at 150; a 1% annual return would put the current value at 122.
What people really want to know is what will happen to nominal prices in the future. But the focus on real prices helps predict changes in future nominal prices. I'll have more on this later.
Modification Update
by Anonymous on 9/26/2007 11:19:00 AM
Many of our commenters have expressed concern over the possibility that servicers offering workout modifications will lead to "freeloading" by borrowers who could make their payment, but who wish to tell the servicer a sob story and get a rate break. I thought you might find the following from American Banker (subscription only) interesting:
In an interview this month, J.K. Huey, the senior vice president of home loan servicing at IndyMac Bancorp Inc., said that more than half of the borrowers who call the company for a workout or a loan modification do not qualify.The gist of the article is that modification rates are still very low relative to the number of troubled borrowers; Moodys estimates that about 1.00% of 2005-vintage ARMs have been modified this year.
"We want to help people stay in their home provided they have the financial ability to do so," she said. "But we have to make sure they're going to be successful and the loan is going to perform. We can't do a modification just for the sake of it."
Of those whose requests for relief are rejected, roughly 60% did not respond to written requests for financial information, such as the borrower's last two pay stubs, a W-2 form or the last income tax return. "A lot of people do not want to send the financial information needed to prove what their income is," Ms. Huey said. "They really don't want to take the time to work with us."
The other 40% of loans that are denied loss mitigation are to borrowers who are current on their mortgage payments but who contacted IndyMac in an effort to get a lower rate, she said.
"We do have some customers calling us that shouldn't be calling us," Ms. Huey said. After reviewing those customers' finances, "we say that they have a $4,000 surplus and are able to make their payments, and they say they just wanted to check."
For those interested in data sources, the article quotes a spokesman for First American Title indicating that requests for modification-related title updates are up about 40%. (A modification does not require a new title insurance policy, as a refinance does, but it does need a "date-down" endorsement to bring the mortgage date down to the modification date, which is much cheaper than a new refi policy.) So title update volume might be a useful proxy for modification activity outside the securitized sector (which a source like the investment banks or rating agencies will limit themselves to).
ARM Pain: Updated BofA Reset Chart
by Calculated Risk on 9/26/2007 10:26:00 AM
Mathew Padilla at the O.C. Register has an updated ARM reset chart from Bank of America analyst Robert Lacoursiere.
See Mathew's blog for more discussion and a comparison to the previous chart.
Some readers have noted that the BofA numbers are higher than the Credit Suisse and UBS reset numbers. CS and UBS are apparently only looking at securitized loans, and BofA includes unsecuritized loans.
Also, CS and UBS apparently only include the first reset when the loan goes from "fixed to floating". Perhaps BofA includes subsequent resets too, double counting some loans.


