 RSS Feed
 by Calculated Risk on 1/18/2007 11:06:00 AM
Thursday, January 18, 2007
Housing: Starts and Completions
The Census Bureau reports on housing Permits, Starts and Completions. Seasonally adjusted permits rose slightly:
Privately-owned housing units authorized by building permits in December were at a seasonally adjusted annual rate of 1,596,000. This is 5.5 percent above the revised November rate of 1,513,000, but is 24.3 percent below the December 2005 estimate of 2,107,000.Starts were up for the second straight month:
Privately-owned housing starts in December were at a seasonally adjusted annual rate of 1,642,000. This is 4.5 percent above the revised November estimate of 1,572,000, but is 18.0 percent below the December 2005 rate of 2,002,000.And Completions were flat, at just below the recent record levels:
Privately-owned housing completions in December were at a seasonally adjusted annual rate of 1,900,000. This is 0.4 percent above the revised November estimate of 1,893,000, but is 2.7 percent below the December 2005 rate of 1,953,000.
 Click on graph for larger image.
The first graph shows Starts vs. Completions.
I'm a little surprised at the slight rebound in starts, especially since completions and inventories are still near record levels. Still Starts have fallen "off a cliff", and completions have just started to fall.

This graph shows starts, completions and residential construction employment. (starts are shifted 6 months into the future). Completions and residential construction employment are highly correlated, and Completions lag Starts by about 6 months.
Based on historical correlations, it is reasonable to expect Completions and residential construction employment to follow Starts "off the cliff". This would indicate the loss of 400K to 600K residential construction employment jobs by this Summer.
Wednesday, January 17, 2007
Worth a second look ...
by Calculated Risk on 1/17/2007 05:51:00 PM
If you missed Tanta's most recent post, it is definitely worth reading (and rereading): Information is Power, Which is Why You Don’t Get Any.
Make sure you read the comments too.
I just hope she wasn't referring to me when she wrote:
"... next time I'll write something calm and polite and professional and bland and get my case jumped by the readers who are tired of calm and polite and professional and bland because that's all you ever get in the newspaper and we come to blogs for some juice."
DataQuick: Bay Area home prices flat, slow sales
by Calculated Risk on 1/17/2007 05:14:00 PM
From DataQuick: Bay Area home prices flat, slow sales
Bay Area home prices were flat last month while the sales pace was the slowest pace in a decade ...Just six months ago, DataQuick reported "indicators of market distress are still largely absent" and "foreclosure rates are coming up from last year's low point, but are still below normal levels". Now foreclosures are in the "normal range", and from the information I'm receiving, foreclosures will be significantly above normal shortly.
A total of 7,488 new and resale houses and condos sold in the Bay Area last month. That was up 3.9 percent from 7,204 in November, and down 19.9 percent from 9,347 for December last year, according to DataQuick Information Systems.
Sales have declined on a year-over-year basis the last 21 months. Last month's sales count was the lowest for any December since 1996 when 7,180 homes were sold. The average for all Decembers since 1988 is 8,339.
...
The median price paid for a Bay Area home was $612,000 in December. That was down 0.6 percent from $616,000 in November and up 0.5 percent from $609,000 for December a year ago. The median peaked last June at $644,000.
...
Indicators of market distress are still in the normal range. Financing with adjustable-rate mortgages is flat. Foreclosure activity is rising but is still in the normal range. Down payment sizes are stable. Flipping rates and non-owner occupied buying activity are down, DataQuick reported.
Fed's Mishkin on Monetary Policy and House Prices
by Calculated Risk on 1/17/2007 01:12:00 PM
From Fed Governor Frederic Mishkin: The Role of House Prices in Formulating Monetary Policy
Once again the Fed is arguing against taking action when a possible bubble is forming. This is the same argument Greenspan made during the stock market bubble, but this time the issue is housing. However, the Fed stands ready to take action if the bursting of the bubble impacts the general economy.
Mishkin's conclusion:
Large run-ups in prices of assets such as houses present serious challenges to central bankers. I have argued that central banks should not give a special role to house prices in the conduct of monetary policy but should respond to them only to the extent that they have foreseeable effects on inflation and employment. Nevertheless, central banks can take measures to prepare for possible sharp reversals in the prices of homes or other assets to ensure that they will not do serious harm to the economy.
NAHB: Builder Confidence Improves in January
by Calculated Risk on 1/17/2007 12:59:00 PM
From NAHB: Builder Confidence Improves in January
 Click on graph for larger image.
Excerpts:
The HMI increased from an upwardly revised 33 in December to 35 in January, its highest level since July of 2006.
...
Two out of three component indexes registered improvement in January. The index gauging current single-family home sales and the index gauging traffic of prospective buyers each gained three points, to 36 and 26 respectively, while the index gauging sales expectations for the next six months remained unchanged at 49.
Meanwhile, three out of four regions surveyed in the HMI posted gains in January. Two-point gains were registered in the Northeast, Midwest and South, to 39, 24 and 41, respectively. The HMI for the West remained unchanged from the previous month at 32.
MBA: Purchase Applications Decrease
by Calculated Risk on 1/17/2007 10:39:00 AM
The Mortgage Bankers Association (MBA) reports: Refinance Applications Increase and Purchase Applications Decrease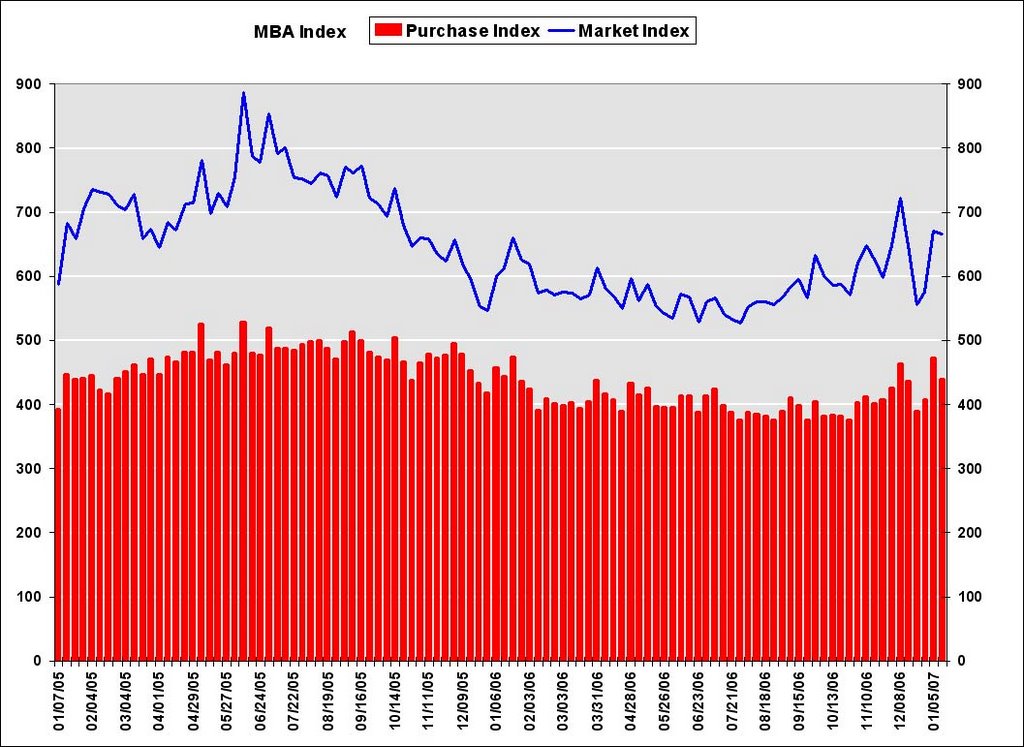 Click on graph for larger image.
The Market Composite Index, a measure of mortgage loan application volume, was 667.2, a decrease of 0.6 percent on a seasonally adjusted basis from 671.1 one week earlier. On an unadjusted basis, the Index increased 28.9 percent compared with the previous week and was up 9.8 percent compared with the same week one year earlier.Mortgage rates increased:
The Refinance Index increased by 6.3 percent to 2045.8 from 1923.8 the previous week and the seasonally adjusted Purchase Index decreased by 7 percent to 439.7 from 472.8 one week earlier.
The average contract interest rate for 30-year fixed-rate mortgages increased to 6.19 from 6.13 percent ...
The average contract interest rate for one-year ARMs increased to 5.85 percent from 5.79 ...
 The second graph shows the Purchase Index and the 4 and 12 week moving averages since January 2002. The four week moving average is up 0.2 percent to 427.4 from 426.6 for the Purchase Index.
The refinance share of mortgage activity increased to 49.9 percent of total applications from 48.4 percent the previous week. The adjustable-rate mortgage (ARM) share of activity increased to 21.2 from 20.1 percent of total applications from the previous week.
Tuesday, January 16, 2007
Leamer: Is a Recession Ahead?
by Calculated Risk on 1/16/2007 02:59:00 PM
Dr. Edward Leamer, Director UCLA Anderson Forecast, writes in The Economists' Voice: Is a Recession Ahead? The Models Say Yes, but the Mind Says No
My view, announced in December 2005, is that this time will be different. This time the problems in housing will stay in housing. So far, I am feeling very smug. But this keeps me up at night. In this column, first the models, and then the mind. The models say that a recession is coming soon. The mind says otherwise.I'll have more later, but here is Dr. Leamer's conclusion:
The mind: why i think the models are wrong
The models that rely on history suggest that the extreme problems in housing currently being corrected will almost surely infect the rest of the economy, but that history does not take into account two important facts:
• Manufacturing is not poised to contribute much to job loss.
• Real interest rates are very low and there is no evident credit crunch, now or on the horizon.
These facts make the problem in housing less severe than it would be otherwise, and help to confine the pathology to the directly affected real estate sectors: builders, real estate brokers and real estate bankers.
...
The models say “recession;” the mind says “no way.” I’m going with the mind. This time the problems in housing will stay in housing. If you are a builder or a broker, it will feel like a deep depression. The rest of us will hardly notice.
DataQuick: SoCal New price peak, slowest December in ten years
by Calculated Risk on 1/16/2007 02:06:00 PM
DataQuick reports: New price peak, slowest December in ten years
Southern California's housing market ... prices reached a new peak while sales volume remained at a ten-year low ...
The median price paid for a home in Los Angeles, Riverside, San Diego, Ventura, San Bernardino and Orange counties was $495,000 last month, a new record. That was up 1.6 percent from $487,000 for the month before, and up 3.3 percent from $479,000 for December a year ago, according to DataQuick Information Systems.
The previous peak was $493,000 last June. Year-over-year price increases have been in the single digits for nine months. Last month's record median was in large part due to strong sales of new homes, which is normal for December.
"The market is still readjusting after the frenzy in 2004 and 2005. Market indicators tend to point in different directions during a turn. We are watching the San Diego market carefully, sales and price trends there have tended to lead the region," said Marshall Prentice, DataQuick president.
A total of 22,485 new and resale homes were sold regionwide last month. That was up 10.3 percent from 20,388 in November, and down 22.3 percent from 28,952 in December a year ago. Last month was the slowest December since 1995 when 19,202 homes were sold. DataQuick's statistics go back to 1988, the December average is 23,699 sales.
...
While year-over-year sales in the region have declined for the last 13 months, San Diego County's sales started to decline 30 months ago. San Diego County's median peaked in November 2005 at $518,000 and was $483,000 last month, a 6.8 percent decline.
Centex, KB Home
by Calculated Risk on 1/16/2007 11:27:00 AM
"We are navigating through one of the most challenging housing environments in the past 25 years. We are responding by reducing our land position and inventory, aligning our workforce to the current sales pace and improving our overall cost structure."
Centex Chairman and Chief Executive Tim Eller, Jan 16, 2007
From MarketWatch: Centex, KB Home write off $793 million on value of land holdings, options
Centex said it will record land-valuation adjustments of about $300 million because of the declining housing market. It also has decided not to exercise land-option contracts on 37,000 lots, resulting in walk-away costs of about $150 million.
...
Centex added closings for the quarter dropped fell 12% to 8,360, and net orders slumped 24% to 6,139.
As for KB Home, it said ... that it will take an inventory-impairment charge of $255 million and an $88 million charge from the abandonment of some land-option contracts.
Monday, January 15, 2007
Berson on Housing Overhang
by Calculated Risk on 1/15/2007 10:35:00 PM
Fannie Mae economist David Berson asks: How large is the housing overhang?
We have argued for some time that the surge in housing demand in recent years (principally from investors over the period from 2004 to early-2006) was unsustainable. Understandably, builders responded to this pickup in overall housing demand by significantly increasing house construction. As a result, too many housing units were built in recent years relative to the underlying pace of housing demand-- bringing unsold inventories up to record highs. But how large is this overhang relative to long-term housing demand?Berson estimates the overhang at about 600K units. In an earlier post, I estimated the overhang at 1.1 to 1.4 million units. The differences in our estimates come from two main sources: 1) I estimated current total demand at about 1.7 million units per year, Berson used 1.8 million units. 2) Since I used a lower number, I also calculated some excess overbuilding prior to 2004; Berson only calculated overbuilding in 2004 through 2006.
The difference is important for estimating the length and depth of the building slump. Using my estimates, I further calculated completions "might fall to 1.2 million units per year over the next few years" and "New Home Sales might fall to 800 thousand per year or less - until the excess inventory is absorbed".
Using Berson's 600K estimate, completions will probably stabilize at around 1.5 million units per year for the next couple of years, and New Home sales will probably decline to 900K per year or so. This is close to Berson's forecast of 975K New Home sales in 2007, and starts of 1.58 million units. (Starts and completions will be close in 2007 if starts stabilize at the 1.5+ million SAAR level).


