 RSS Feed
 by Calculated Risk on 11/16/2006 01:14:00 AM
Thursday, November 16, 2006
UK: Banks told to predict effects of a 40% crash in house prices
From The Times: Banks told to predict effects of a 40% crash in house prices (hat tip: Kevin)
BANKS in the UK have been ordered by financial regulators to assess how they would cope in the event of house prices crashing by 40 per cent.And from the Business Online: House prices most overvalued since 1948
...
The FSA said yesterday that an “appropriate” benchmark was to assume property prices fell by 40 per cent and that 35 per cent of mortgages in default ended with homes being re-possessed. It stressed that this was not a forecast but a “severe but plausible scenario” and one that banks should examine when deciding how robust their balance sheets were.
...
[Clive Briault, the FSA’s managing director for retail markets] warned bankers to ensure that they have properly stress-tested their mortgage portfolios in the wake of decisions by some to lend people greater multiples of their incomes.
...
House prices fell about 15 per cent nationwide in 1989-1992, and in parts of East Anglia by 40 per cent, leading to repossessions, write-downs and bank losses.
...
The FSA move came as UK house prices grew at their fastest for four years, according to new figures from RICS.
BRITAIN’S housing market is more overvalued than at any time since 1948 as buyers compete to snap up scarce properties, according to Dresdner Kleinwort.
The research will fuel fears that easy credit is inducing buyers to pay too much when buying their homes and over-stretch themselves financially.

The ratio of house prices to disposable incomes typically peaks at more than six times, the analysis reveals. On this measure, peaks in the housing market were seen in 1948, 1973, 1988 and 2006.
The current ratio is higher than in all previous episodes apart from 1948, when private homes were very scarce after the second world war.
David Owen, an economist at Dresdner Kleinwort, said: “There was an earlier period when inflation and interest rates were both low and the UK housing market was as expensive as it is today: the late 1940s. As in other housing corrections house prices then fell in real terms by over 30%. They also fell in nominal terms.”
After each previous peak, house prices went on to fall sharply in real terms, usually by more than 30%.
Wednesday, November 15, 2006
DataQuick: Bay Area home sales slow, prices flat
by Calculated Risk on 11/15/2006 05:10:00 PM
DataQuick reports: Bay Area home sales slow, prices flat
Bay Area home sales held steady at a five-year low in October ... Prices remained flat.
The median price paid for a Bay Area home was $614,000 last month, up 0.5 percent from September's $611,000, and unchanged from October last year. The median hovered around $630,000 last spring and early summer, and spiked to $644,000 in June before coming down.
| Bay Area California Median Home Prices | ||||
| Area | Oct '04 | Oct '05 | Oct '06 | Pct Change |
| Alameda | $497K | $571K | $578K | 1.2% |
| Contra Costa | $468K | $575K | $544K | -5.4% |
| Marin | $688K | $817K | $844K | 3.3% |
| Napa | $527K | $608K | $555K | -8.7% |
| San Francisco | $666K | $778K | $771K | -0.9% |
| San Mateo | $656K | $759K | $745K | -1.8% |
| Santa Clara | $552K | $639K | $658K | 3.0% |
| Solano | $413K | $476K | $462K | -2.9% |
| Sonoma | $477K | $564K | $531K | -5.9% |
| Bay Area | $524K | $614K | $614K | 0.0% |
I added the October 2004 median prices to give a two year perspective on prices.
A total of 7,979 new and resale houses and condos were sold in the nine-county region in October. That was up 0.9 percent from 7,907 for the month before, and down 24.1 percent from 10,508 for October last year, according to DataQuick Information Systems.
Last month's sales count was the lowest for any October since 2001 when 7,867 homes were sold. An average October has 8,445 sales in DataQuick's statistics, which go back to 1988. The range is from 5,767 in 1994 to 11,728 in 2003.
| Bay Area California Homes Sold | ||||
| Area | Oct '04 | Oct '05 | Oct '06 | Pct Change |
| Alameda | 2,458 | 2,187 | 1,586 | -27.5% |
| Contra Costa | 2,252 | 2,104 | 1,658 | -21.2% |
| Marin | 404 | 395 | 286 | -27.6% |
| Napa | 206 | 187 | 140 | -25.1% |
| San Francisco | 650 | 605 | 523 | -13.6% |
| San Mateo | 840 | 754 | 653 | -13.4% |
| Santa Clara | 2,595 | 2,557 | 1,971 | -22.9% |
| Solano | 978 | 936 | 605 | -35.4% |
| Sonoma | 797 | 783 | 557 | -28.9% |
| Bay Area | 11,180 | 10,508 | 7,979 | -24.1% |
OFHEO: No Change to Conforming Loan Limit
by Calculated Risk on 11/15/2006 03:53:00 PM
If housing prices fall, the 2007 conforming loan limit will not be changed. From OFHEO:
... a decline in price appears likely this year as the September number showed a 3.1 percent decrease. The FHFB’s October 2006 data will not be published until Nov. 28, 2006, but households and lenders are making decisions today that may be affected by the limits put in place next January.
...
If the October-to-October increase is negative, its effect on the maximum conforming limits will be deferred for one year. Thus, if the October 2006 average price is less than that of October 2005, the maximum 2007 loan limits will be unchanged from current levels. This year’s decrease would be netted against any increase next year in determining the 2008 limits. If a decrease in average price this year is followed by another decrease next year, the maximum loan limits will decline in 2008 by at least this year's percentage decrease in average prices.
MBA: Rates Fall and Mortgage Applications Rise
by Calculated Risk on 11/15/2006 12:33:00 AM
The Mortgage Bankers Association (MBA) reports: Rates Fall and Mortgage Applications Rise  Click on graph for larger image.
The Market Composite Index, a measure of mortgage loan application volume, was 647.5, an increase of 4.3 percent on a seasonally adjusted basis from 620.9 one week earlier. On an unadjusted basis, the Index decreased 7.6 percent compared with the previous week and was down 0.1 percent compared with the same week one year earlier.Mortgage rates decreased:
The seasonally-adjusted Refinance Index increased by 6.5 percent to 2022.2 from 1897.9 the previous week and the Purchase Index increased by 2.7 percent to 412.9 from 402.2 one week earlier. The Refinance Index is at its highest level since October 2005.
The average contract interest rate for 30-year fixed-rate mortgages decreased to 6.15 percent from 6.24 percent ...
The average contract interest rate for one-year ARMs decreased to 5.87 percent from 5.89 ...
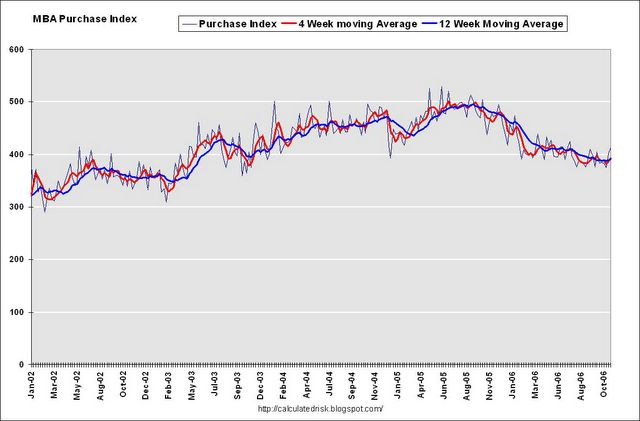 The second graph shows the Purchase Index and the 4 and 12 week moving averages since January 2002.
The four week moving average for the seasonally-adjusted Market Index is up 2.6 percent to 606.8 from 591.5. The four week moving average is up 1.8 percent to 393.1 from 386.2 for the Purchase Index, while this average is up 3.7 percent to 1854.9 from 1788.9 for the Refinance Index.
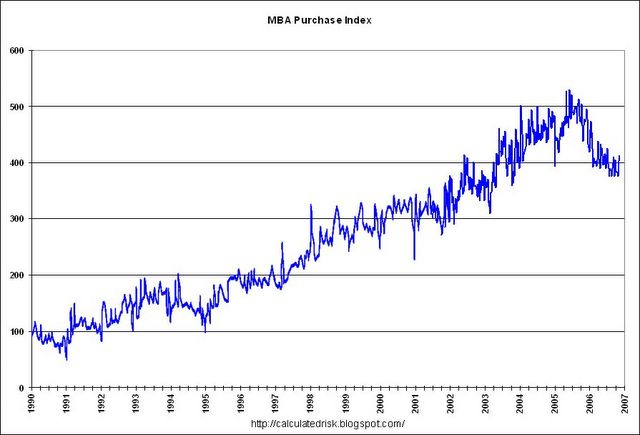 The third graph shows the MBA purchase index since 1990.
The Market Composite Index is at about the same level as one year ago, even though the Purchase Index is about 15% below the comparable week for 2005. The difference is refinance activity is very strong - almost 20% above the comparable week for 2005.
Tuesday, November 14, 2006
Schwab's Sonders Interviews Greenspan
by Calculated Risk on 11/14/2006 08:55:00 PM
Liz Sonders, Chief Investment Strategist, Charles Schwab & Co. spoke with Alan Greenspan last week: The Maestro: A Conversation With Alan Greenspan
I asked ... about the state of the U.S. economy, to which Greenspan replied, "Not bad." He predicted a continued weakening into early next year, but said he's confident "the worst is behind us" since profit margins are high and capital orders are potent. "We have been in a slowing period, but it's temporary," he said. "The global economy is in extraordinarily good shape."And on housing:
Although it's "too soon to say" if we're close to the bottom of the housing bust, Greenspan doesn't predict a rapid decline. I did get the sense that he was back-pedaling a bit from his well-quoted view recently that housing may have hit bottom. In fact, I reminded him that his "irrational exuberance" comment in 1996 came over three years prior to the market's ultimate top in 2000. In his well-crafted reply, he suggested, "This is not the bottom, but the worst is behind us." My skepticism about a muted impact of housing on the broad economy is well-documented, so I wasn't fully in agreement when he went on to say that housing market activity is likely no longer to be a drag on overall economic growth as unsold inventories clear out and stabilize against sales levels.And on nontraditional mortgages:
I followed up by asking about the rash of non-traditional mortgages that characterized this housing boom/bust. He replied that those "flaky" exotic mortgages, which allowed consumers to purchase homes more expensive than they could afford, will be financially devastating for those families holding them, but will have little impact on the macro economy. Again, I hope he's right, but I have my doubts.
DataQuick: Southland home sales slow to ten-year low
by Calculated Risk on 11/14/2006 01:18:00 PM
DataQuick reports: Southland home sales slow to ten-year low
Last month was the slowest October for Southern California home sales in a decade. Prices continued to level off, a real estate information service reported.
...

"It's harder to buy a home if you think it might go down in value than it is if you're convinced it's going up. Buyers are taking their time, trying to wait out the uncertainty in a market that is rebalancing itself. Additionally, many potential buyers are in the move-up category, and they have their own home they need to sell," said Marshall Prentice, DataQuick president.
The median price paid for a Southland home was $484,000 last month, the same as in September. The median was up 2.3 percent from $473,000 for October a year ago. Year-over-year increases have been in the single digits for seven months and are expected to be slightly negative by the end of the year or early next year.
| Southern California Median Home Prices | ||||
| Area | Oct '04 | Oct '05 | Oct '06 | Pct Change |
| Los Angeles | $409K | $492K | $514K | 4.5% |
| Orange County | $532K | $606K | $625K | 3.1% |
| San Diego | $489K | $513K | $485K | -5.5% |
| Riverside | $339K | $391K | $410K | 4.9% |
| San Bernardino | $266K | $354K | $362K | 2.3% |
| Ventura | $518K | $596K | $582K | -2.3% |
| Southern California | $410K | $473K | $484K | 2.3% |
I added the October 2004 median prices to give a two year perspective on prices.
A total of 22,117 new and resale homes sold in Los Angeles, Riverside, San Diego, Ventura, San Bernardino and Orange counties last month. That was down 2.4 percent from 22,654 in September, and down 22.4 percent from 28,489 for October a year ago, according to DataQuick Information Systems.
Last month's sales count was the lowest for any October since 1996 when 18,505 homes were sold. October sales have ranged from 14,608 in 1991 to 32,522 in 2003. The October average is 23,077, slightly above last month's sales. DataQuick's sales statistics go back to 1988.
| Southern California Homes Sold | ||||
| Area | Oct '04 | Oct '05 | Oct '06 | Pct Change |
| Los Angeles | 9,709 | 9,792 | 7,662 | -21.8% |
| Orange County | 3,508 | 3,614 | 2,715 | -24.9% |
| San Diego | 4,758 | 4,155 | 3,282 | -21.0% |
| Riverside | 5,070 | 5,542 | 4,200 | -24.2% |
| San Bernardino | 3,941 | 4,217 | 3,318 | -21.3% |
| Ventura | 1,203 | 1,169 | 940 | -19.6% |
| Southern California | 28,189 | 28,489 | 22,117 | -22.4% |
DataQuick expects to be reporting YoY price declines soon:
"Year-over-year increases have been in the single digits for seven months and are expected to be slightly negative by the end of the year or early next year."Buyer psychology will probably change for the worse when price declines are routinely reported. As DataQuick's Marshall Prentice noted:
"It's harder to buy a home if you think it might go down in value than it is if you're convinced it's going up."
State Version of Nontraditional Mortgage Guidance Released
by Calculated Risk on 11/14/2006 01:04:00 PM
From the CSBS:
The Conference of State Bank Supervisors and the American Association of Residential Mortgage Regulators have distributed guidance to state agencies that regulate residential mortgage brokers and companies on the risks posed by nontraditional mortgage products. CSBS and AARMR encouraged the state regulatory agencies to adopt the guidance for the organizations they regulate. The CSBS/AARMR guidance is based upon an interagency guidance released on Sept. 29, 2006, by FDIC, the Office of the Comptroller of the Currency, the Federal Reserve, the Office of Thrift Supervision and the National Credit Union Administration. The CSBS/AARMR guidance mirrors substantially the interagency guidance except for the deletion of sections that do not apply to nondepository institutions. “We are hopeful the interagency guidance and parallel state-issued guidance will serve to inform and protect consumers and enhance the safety and soundness of the industry,” said CSBS President and CEO Neil Milner. Consistent guidance for all market participants will provide an opportunity to gauge its influence on consumer behavior and the mortgage market, CSBS added.Here is the guidance: GUIDANCE ON NONTRADITIONAL MORTGAGE PRODUCT RISKS
Monthly Retail Sales
by Calculated Risk on 11/14/2006 12:43:00 PM
The October advanced monthly retail sales from the Census Bureau are a little confusing this month due to the steep drop in gasoline prices.
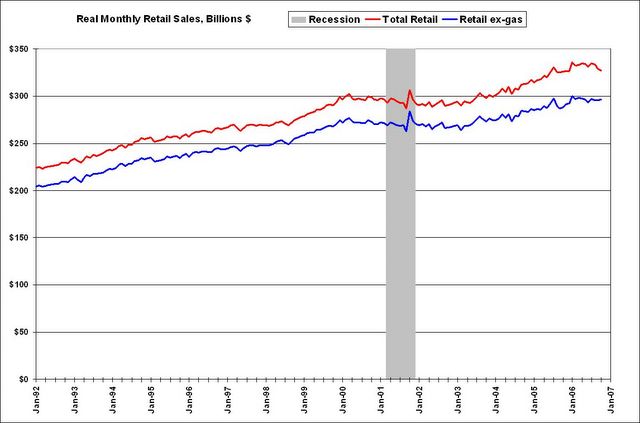
The U.S. Census Bureau announced today that advance estimates of U.S. retail and food services sales for October, adjusted for seasonal variation and holiday and trading-day differences, but not for price changes, were $363.7 billion, a decrease of 0.2 percent from the previous month, but up 4.5 percent from October 2005. Total sales for the August through October 2006 period were up 5.3 percent from the same period a year ago. The August to September 2006 percent change was revised from -0.4 percent to -0.8 percent.The following graph shows real monthly retail sales with and without gasoline stations.
 Click on graph for larger image.
Note: Adjusted using Median CPI from Cleveland Fed, Oct estimated.
Total retail sales are declining. Excluding gasoline stations, real monthly retail sales are flat.
Even the National Retail Federation is cautious: Retailers See Moderate Retail Sales Growth in October, Slow Housing Market Beginning to Impact Home-Related Sales
"Although gas prices have declined, the slow housing market appears to be hurting consumer spending power as home improvement and home furnishing categories begin to struggle," said NRF Chief Economist Rosalind Wells.Roubini see the numbers as portending a recession: Inflation and Sales Faltering
Home Depot and Housing
by Calculated Risk on 11/14/2006 11:29:00 AM
From Reuters: Home Depot cuts outlook amid housing downturn
Home Depot Inc. on Tuesday reported a 3 percent drop in third-quarter profit that missed Wall Street estimates, and sharply cut its forecast for earnings growth this year as the U.S. housing slowdown crimps spending on big-ticket projects.
The world's largest home improvement retailer said weakness would likely continue into 2007, and its shares fell 1 percent.
"I don't think we've seen the bottom yet," Home Depot Chairman Robert Nardelli said during a conference call. "I don't see anything that suggests it's going to get significantly better in '07."
...
Total sales rose 11.3 percent to $23.1 billion, falling short of analysts' average estimate of $23.3 billion. Sales at stores open at least a year, an important retail measure, fell 5.1 percent.
...
Other key metrics weakened. The average purchase fell 1 percent to $58.33, the first decline in four years, while average weekly sales per store fell 7 percent. Home Depot cited softness in most departments and said consumers were taking on fewer costly improvements such as kitchen renovations and flooring projects.
Monday, November 13, 2006
San Diego: Prices Decline 5.5%, Sales Lowest Since 1996
by Calculated Risk on 11/13/2006 06:09:00 PM
The San Diego Union reports: County housing prices rise slightly
San Diego County housing prices reversed course and rose slightly last month to reach a median of $485,000, locally based DataQuick Information Systems reported Monday.There is month to month variability in the numbers, however on a YoY basis, the median San Diego home price declined 5.5% from $513,000 in October 2005.
As for sales, San Diego County had 3,282 transactions last month, up 2.3 percent from September but down 21 percent from a year ago, the 28th straight month to have a year-over-year decline.
 Click on graph for larger image.
There were 3,282 sales in October 2006, down from 4,155 sales in October 2005.
This is the lowest transaction level for October in San Diego since 1996 - the end of the previous housing bust in San Diego.
The DataQuick numbers for the rest of California will be released this week.

In Memoriam: Doris "Tanta" Dungey


| Privacy Policy |
| Copyright © 2007 - 2025 CR4RE LLC |
| Excerpts NOT allowed on x.com |