RSS Feed
by Calculated Risk on 6/01/2006 02:09:00 PM
Thursday, June 01, 2006
May: Record YTD Increase in National Debt
For the first eight months of the 2006 fiscal year (starts Oct 1st), the National Debt has increased $424.1 Billion. The previous record was $413.2 Billion for the first eight months of fiscal 2004.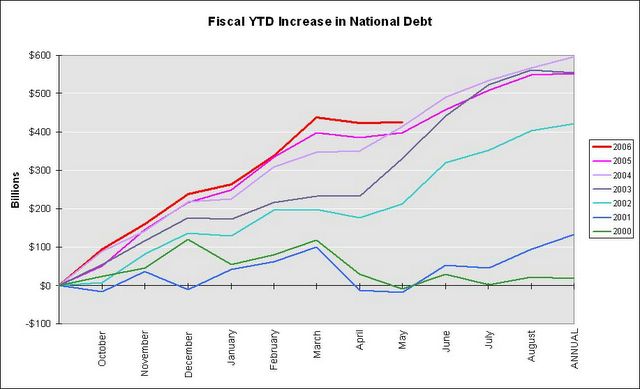
Click on graph for larger image.
As a percent of GDP, the deficit has improved slightly over the last few years.
The annual increase in the debt is running around 4.5% to 5.0% of GDP. This is a classic "structural budget deficit" or "high employment deficit" - something most economists believe should be avoided.
If someone says the deficit is falling - laugh (or cry). Its not true. Here are some recent delusional comments:
"[Hank Paulson] will work closely with Congress to help restrain the spending appetite of the federal government and keep us on track to meet our goal of cutting the deficit in half by 2009."
George W. Bush, May 30, 2006
"That surge in government receipts, along with the strict control on spending that you've advocated, are putting us on a path to not only meet your deficit-reduction target but to do so ahead of schedule."
Treasury Secretary John Snow, May 30, 2006
OFEHO: House Price Increases Continue; Some Deceleration Evident
by Calculated Risk on 6/01/2006 10:02:00 AM
The Office of Federal Housing Enterprise Oversight (OFHEO) released the Q1 2006 House Price Index.
House Price Increases Continue; Some Deceleration Evident
OFHEO House Price Index Shows Annual Rise of 12.5 Percent
WASHINGTON, D.C. – U.S. home prices were 12.54 percent higher in the first quarter of 2006 than they were one year earlier. Appreciation for the most recent quarter was 2.03 percent, or an annualized rate of 8.12 percent. The quarterly rate is about one percentage point below the rate from the previous quarter and is the lowest rate since the first quarter of 2004. The figures were released today by OFHEO Acting Director James Lockhart, as part of the House Price Index (HPI), a quarterly report analyzing housing price appreciation trends.
“These data show average housing prices still growing stronger than some might have expected,” said Lockhart. “They do indicate, however, that price growth is moderating in some parts of the country, particularly in areas where prices have been rising the most.”
House prices continued to grow considerably faster over the past year than did prices of non-housing goods and services reflected in the Consumer Price Index. House prices rose 12.5 percent, while prices of other goods and services rose
only 4.2 percent.
“Increasing sales inventories are apparently giving buyers greater bargaining power, while increasing interest rates are dampening demand," said OFHEO Chief Economist Patrick Lawler.
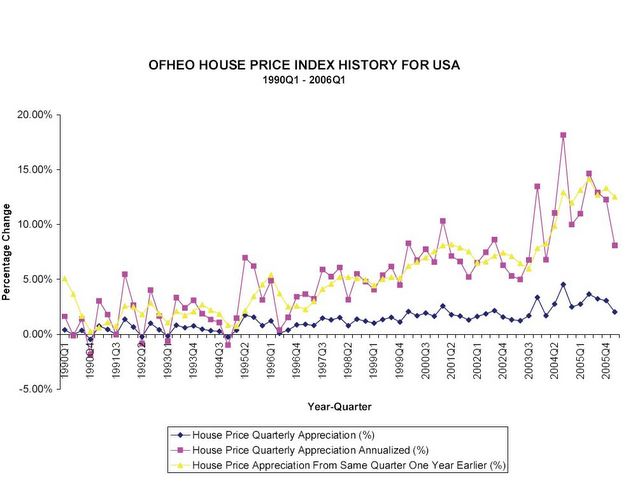
Click on graph for larger image.
As noted, the quarterly appreciation slowed - but not as much as I had expected.
From a bubble perspective, three of the most closely watched cities have been Boston, Sacramento and San Diego - all three have shown signs of a housing slowdown.
Boston prices increased 0.51% in Q1 2006 and 5.6% for the year.
Sacramento prices increased -0.24% for the quarter, and 13.2% for the year.
San Diego prices increased 0.23% for the quarter, and 8% for the year.
The housing slowdown is starting to show up in the prices for these areas.
Wednesday, May 31, 2006
Reuters on Housing Slowdown
by Calculated Risk on 5/31/2006 03:26:00 PM
Reuters reports: US housing slowdown well under way, set to drag on
America's booming housing market has clearly slowed ...
...
"I think that the housing market actually crested in the fall of 2005 and we've been in a gradual cool-down," said Frank Nothaft, chief economist at mortgage finance company Freddie Mac.
...
So far this year, total home sales are 3.9 percent below the first four months of 2005. And despite surprising gains in March and April, sales of newly built homes are down too versus a year ago, according to the Mortgage Bankers Association.
That trade group's data also show fewer people are applying for mortgages. In fact, purchase applications year to date are down 10 percent from the comparable period in 2005.
"We're running at about 2003 levels," said Mike Fratantoni, senior economist at the Mortgage Bankers Association. "It's still a pretty strong purchase market, but not nearly as strong as it was in '04 or '05."
The number of houses up for sale offers a telling sign too, said Jeff Taylor, the National Association of Federal Credit Unions' senior economist.
Indeed, inventories are soaring. The number of new homes and existing houses on the market both hit records in April, according to the National Association of Realtors and the U.S. Commerce Department.
At the current sales pace, the number of homes up for resale amounted to a six-month supply -- the largest in more than eight years.
Fed Minutes: Inflation Risk Rising, Growth Slowing
by Calculated Risk on 5/31/2006 02:11:00 PM
Here are the minutes for the May 10th FOMC meeting. The members were worried about rising inflation and slowing growth:
Core inflation recently had been a bit higher than had been expected, and several members remarked that core inflation was now around the upper end of what they viewed as an acceptable range. Moreover, a number of factors were augmenting the upside risks to inflation: the surge in energy and commodity prices, some recent weakness in the foreign exchange value of the dollar, and the possibility that the apparent increase in inflation expectations could, if it persisted, impart momentum to inflation.And on housing:
...
At the same time, members also saw downside risks to economic activity. For example, the cumulative effect of past monetary policy actions and the recent rise in longer-term interest rates on housing activity and prices could turn out to be larger than expected.
The underlying pace of residential activity seemed to moderate in the first quarter. After unseasonably warm weather allowed a high level of single-family housing starts in January and February, starts fell in March to their lowest level in a year. New permit issuance for single-family homes also fell in March, continuing its downward trend. Multifamily starts recovered a bit in March from their low rate in February but remained well within their historical range. Home sales also declined, on net, in recent months. Although sales of existing single-family homes edged up in February and March, the level of sales for the first quarter as a whole was notably below the record high in the second quarter of last year. Sales of new homes also moved up in March, but their average in the first quarter was down substantially from the peak in the third quarter of last year. House price appreciation appeared to have slowed from the elevated rates seen over the past summer. Growth in the average sales price of existing homes in March, versus a year earlier, decelerated sharply, and the average price for new homes in March fell compared to a year earlier. In addition, other indicators, such as months' supply of both new and existing homes for sale and the index of pending home sales, supported the view that housing markets had cooled in recent months.
...
In their discussion of major sectors of the economy, some participants noted that growth of household spending was likely to slow over the remainder of the year. Anecdotal information pointed to some cooling of housing markets. That cooling was especially noticeable for high-end homes and for houses in markets that previously had experienced the steepest appreciation. Data on home sales, permits, and starts on the whole likewise suggested that activity was gradually diminishing. Some reports indicated that speculative building of homes had dropped off considerably, but inventories of unsold homes still seemed to be expanding. Although fresh comprehensive data were not available, home prices on average appeared still to be rising, but at a slower pace than over the past few years.
MBA: Mortgage Application Volume Declines
by Calculated Risk on 5/31/2006 10:44:00 AM
UPDATE: Also see Barry Ritholtz' Recent Housing Data: Charts & Analysis (with graphs from Northern Trust). This graph from NT's Asha Bangalore shows a longer term view of the MBA Purchase Index.
ORIGINAL POST: The Mortgage Bankers Association (MBA) reports: Mortgage Application Volume Declines
Click on graph for larger image.


The Market Composite Index, a measure of mortgage loan application volume, was 541.9, a decrease of 1.9 percent on a seasonally adjusted basis from 552.6 one week earlier. On an unadjusted basis, the Index decreased 2.6 percent compared with the previous week and was down 22.4 percent compared with the same week one year earlier.Mortgage rates increased slightly:
The seasonally-adjusted Purchase Index decreased by 0.2 percent to 395.5 from 396.4 the previous week whereas the Refinance Index decreased by 4.8 percent to 1409.0 from 1480.5 one week earlier....
The average contract interest rate for 30-year fixed-rate mortgages increased to 6.66 percent from 6.61 percent ...Change in mortgage applications from one year ago (from Dow Jones):
The average contract interest rate for one-year ARMs increased to 6.09 percent from 6.02 percent ...
| Total | -22.4% |
| Purchase | -14.2% |
| Refi | -34.2% |
| Fixed-Rate | -19.4% |
| ARM | -28.5% |
Using the MBA weekly data, it appears purchase activity in May '06 will be about 15% below May '05.
Tuesday, May 30, 2006
NAR: Rents Expected to Rise 5%
by Calculated Risk on 5/30/2006 06:08:00 PM
The USA Today reports: Apartment rents expected to rise 5%
Apartment rents are expected to increase 5.3% this year - about double last year's increase - the National Association of Realtors says. That's the highest jump since 2000 ...The article offers these reasons:
"This is going to be the highest rental increase year since 2000, and it's going to be a broad-based increase in rents, not just limited to a few markets," said Hessam Nadji, who manages research for Marcus & Millichap, a real estate firm in Northern California.
• Job growth. U.S. businesses have generated 4 million new jobs in the past two years. New hires typically look for rental property.The first two reasons are weak. There is nothing special about 4 million new jobs over two years. This would only matter if the new supply of housing units didn't keep up with growth.
• Rising home prices. From 1980 to 2000, the median price of a home was 12 times higher than the annual average rent. By this spring, it was 21 times higher, Nadji said.
• Condo conversions. When the housing market was at its blazing peak, many investors who owned apartment buildings kicked out tenants and sold the units as condos. One out of three apartment buildings sold last year were converted into condos for sale. That took 191,400 apartments off the market, according to the NAR. In addition, the number of new apartment buildings under construction is down this year.
• Hurricane Katrina. About half the 100,000 displaced families in the New Orleans area haven't returned. Most of them were renters, says Lawrence Yun, an NAR economist, and "that's putting additional pressure on rental units throughout the country."
And the ratio of Price to Rent could fall without rents increasing; house prices could fall instead. For some reason the Realtors didn't mention this alternative!
The last two reasons make sense: there is less supply due to condo conversions and the destruction caused by Hurricane Katrina.
Fannie Mae's Berson on Housing
by Calculated Risk on 5/30/2006 09:44:00 AM
Fannie Mae Economist David Berson writes: Housing continues to weaken, although it's not collapsing.
Most of the latest data on housing activity show that this sector continues to weaken ... With mortgage rates edging upward, economic growth moderating, and home price appreciation slowing (and in some areas falling, thus reducing investor demand), the prospects of a bounce-back for the housing market this year appear to be dim.Here is a chart of New Home Sales through April:
...
Even with these declines in housing activity ... we continue to project the third strongest year ever for 2006 -- even with sales down by 7-10 percent. In fact, total home sales would have to decline by more than 20 percent in 2006 for sales this year to fall out of the top-three years -- highly unlikely in a non-recession year.

Click on graph for larger image.
As Berson noted, 2006 is on track to be the third strongest year ever behind 2005 and 2004. New Home Sales are off 11.2% YTD compared to 2005.
Berson's numbers are slightly different because he includes Existing Home Sales.
Monday, May 29, 2006
Barron's: The Big Glut
by Calculated Risk on 5/29/2006 12:24:00 PM
Barron's cover story is about the second home glut: The Big Glut
A couple of quotes:
"If you want to sell, you've got to go back to '04 prices," says Chip Harris of Coldwell Banker Previews International
"People don't believe in the laws of supply and demand anymore," says Alan Skrainka, chief market strategist at Edward Jones. "We're not saying it's a bubble, but we're saying prices are overstated and will likely correct 20% to 25% over four or five years."
Sunday, May 28, 2006
OFHEO: House Price Index
by Calculated Risk on 5/28/2006 04:49:00 PM
The Q1 OFHEO House Price Index will be released on Thursday, 10 A.M. EST. The headline number is the year over year price increase - and that will still be positive.
However, I expect the US and many Metropolitan Statistical Area's (MSA) might see negative Q1 appreciation declining prices. Those will be the interesting numbers.
Here are the last 3 quarters:
2005 Q2 3.65%So even if Q1 2006 shows
2005 Q3 3.14%
2005 Q4 2.86%

Click on graph for larger image.
"We've never had a decline in housing prices on a nationwide basis."
Ben Bernanke, July 29, 2005
The US hasn't seen
Housing: More Inventory
by Calculated Risk on 5/28/2006 01:00:00 AM
The Virginia MLS provides several charts of existing home inventory. The following chart is for Fairfax County:
Click on graph for larger image.
For other markets, see: Bubble Markets Inventory Tracking. Here are the number of listings for San Diego:

2/05: 8,500 (SD Union Tribune)
7/05: 14,176___7/05 sold: 4,765___7/04 sold: 5,658
8/05: 15,240___8/05 sold: 5,379___8/04 sold: 5,580
9/05: 16,081___9/05 sold: 4,935___9/04 sold: 5,177
10/05: 16,490__10/05 sold: 4,155___10/04 sold: 4,758
11/05: 16,072__11/05 sold: 3,937___11/04 sold: 4,350
12/05: 14,591__12/05 sold: 4,262___12/04 sold: 4,807
2006
1/1: 13,916
1/10: 14,840
1/20: 15,643
1/30: 16,161___1/06 sold: 2,763___1/05 sold: 3,324
2/10: 16,601
2/20: 16,981
2/28: 17,262___2/06 sold: 2,865__2/05 sold: 3,442
3/10: 17,648
3/20: 18,003
3/31: 18,261___3/06 sold: 4,146__3/05 sold: 5,018
4/10: 18,531
4/20: 19,069
4/22: 19,260
4/30: 19,480___4/06 sold: 3,705__4/05 sold: 5,345
5/10: 20,009
5/20: 20,617
5/23: 20,788
5/24: 20,836
5/25: 20,901
5/27: 21,106