 RSS Feed
 by Calculated Risk on 2/09/2006 03:24:00 PM
Thursday, February 09, 2006
The 30 Year Bond and the Flat Yield Curve
The Treasury Department today issued 30-year bonds for the first time since 2001. From the AP: 30-Year Bond Sold for 1st Time in 5 Years
The Treasury Department sold $14 billion of the bonds with a yield of 4.53 percent.Here are some recent quotes:
FED Funds Rate: 4.5%
Five Year Note: 4.54%
Ten Year Note: 4.54%
30 Year Bond: 4.53%
I don't think we need a graph to visualize a flat line!
Wednesday, February 08, 2006
Bush Budget: Confusing Reporting
by Calculated Risk on 2/08/2006 07:57:00 PM
Yesterday, the Wisconsin State Journal presented this graphic on their front page (pdf). 
Click on graphic for larger image.
The first mistake is to include off-budget items (mostly SSI) in the Bush budget. Obviously the Journal is just following the confusing Bush budget document, but this distorts the proposed percentages for revenues and expenditures.
Look at interest payments. The graphic indicates interest payments will be 9% of the budget. This is completely bogus as interest payments are accelerating rapidly.
The International Herald Tribune quotes our friend Dr. Brad Setser: Effect of rising debt soon to be felt in U.S.
"Up until now, rising debt has been offset by a falling interest rate," said Brad Setser, an economist at Roubini Global Economics in New York. "Now, debt is still rising and the interest rate is no longer falling. The consequence of rising debt will no longer be masked."In fact, the budget estimates interest payments will be $441 Billion in ficsal 2007. So if we take the Bush budget estimate (including SSI), then $441 Billion divided by $2.77 Trillion is 16% of the budget.
So how did the Journal get 9%? Easy. They include SSI in the budget expenditures and exclude interest payments from the General Fund to SSI Trust Fund. So they use $247 billion in interest payment on debt held by the public and a budget of $2.77 Trillion = 9%. Two compounding errors.
Here is the real percentage: The Bush on-budget expenditures are $2.1 Trillion. Interest payments are $441 Billion. So interest payments are 21% of on-budget expenditures (see Table 1.4 pdf)
Mortgage Application Volume Declines, Rates Rise
by Calculated Risk on 2/08/2006 09:50:00 AM
The Mortgage Bankers Association (MBA) reports that mortgage applications declined for the week ending Feb 3rd. 
Click on graph for larger image.
The Market Composite Index — a measure of mortgage loan application volume was 619.3 – a decrease of 1.2 percent on a seasonally adjusted basis from 626.8 one week earlier. On an unadjusted basis, the Index increased 2.2 percent compared with the previous week but was down 16.4 percent compared with the same week one year earlier.
The seasonally-adjusted Purchase Index decreased by 2.4 percent to 425.1 from 435.7 the previous week whereas the Refinance Index increased by 0.2 percent to 1751.0 from 1747.2 one week earlier.
Rates on mortgages increased: The average contract interest rate for 30-year fixed-rate mortgages increased to 6.25 percent from 6.20 percent one week earlier ...
The average contract interest rate for one-year ARMs was steady at 5.48 percent ...
Activity is still high, but falling again as mortgage rates are once again rising.
Tuesday, February 07, 2006
WSJ Econoblog: Stitching a New Safety Net
by Calculated Risk on 2/07/2006 07:46:00 PM
Economics Professors Andrew Samwick and Mark Thoma discuss retirement and health insurance in today's WSJ econoblog: Stitching a New Safety Net.
Dr. Polley's take on the debate:
I really enjoyed reading this Econoblog, and I'll tell you why. Mark Thoma and Andrew Samwick do an outstanding job of showing the Wall Street Journal readers how economists can have a debate on a controversial subject like this. The reader can clearly identify the points of agreement and disagreement. Mark nails the question: How much social insurance should be provided by the government and how much should be provided by markets. They both note the market failures in health insurance. Samwick calls attention to the way the tax code distorts the private insurance market. By identifying the questions and highlighting specific economic issues of incentives, efficiency, and equity, they generate a lot of light and surprisingly little heat.I believe the two most pressing financial problems facing America are the structural General Fund deficit and health care. This discussion provides an excellent starting point for any debate on reforming health care.
Housing: PLEASE Buy this house
by Calculated Risk on 2/07/2006 12:16:00 PM
The Pioneer Press offers a few cautionary tales: Sellers juggle mortgages in tough market
[Bonnie] Cordy and her husband moved to Tennessee last year for his job. They rented an apartment until their new $325,000 house was ready in June. All the while they were making a mortgage payment in Minnesota.
The Apple Valley town home they'd originally listed at $329,900 in December 2004 wasn't selling, even after they dropped the price more than $20,000.
"I felt nervous as we were finishing up the house down here," she said. "There was no way to swing it all."
They dipped into retirement savings for the month or two they had double mortgage payments and taxes.
Then they switched to another agent, who slashed the price another $30,000. It finally sold at the end of August for $291,900, which was about $35,000 less than what they paid in 2003. She figures they lost another $5,000 in retirement savings.
"It's money we'll never get back again," said Cordy, 48.
Monday, February 06, 2006
National Debt: $10 Trillion When Bush Leaves Office
by Calculated Risk on 2/06/2006 03:39:00 PM
Today Bush submitted a budget for fiscal 2007 projecting a budget deficit of over $600 Billion. From AP:
The administration in its budget documents said the deficit for this year will soar to an all-time high of $423 billion, reflecting increased outlays for the Iraq war and hurricane relief.The article is referring to the Enron style unified budget deficit. The on-budget or General Fund deficit will be approximately $200 Billion more reflecting the surplus from Social Security Insurance. This means the projected General Fund deficit for 2007 will be over $600 Billion.
National Debt
The current National Debt is $8.195 Trillion. At $600 Billion per year, the Bush Administration will add $1.8 Trillion to the National Debt over the next 3 years. That will put the National Debt at approximately $10 Trillion when Bush leaves office - a stunning legacy.
Friday, February 03, 2006
Housing: Sales, Employment and Recessions
by Calculated Risk on 2/03/2006 09:06:00 PM
Today's BLS employment report once again showed strong gains for construction employment. Dr. Kash noted this in his post: Job Growth by Industry
"Interestingly, construction employment still seems to be growing robustly, despite some concerns that the real estate market is cooling off; 46,000 of the new jobs created last month were in construction."Here is a look back at the last consumer recession (1990-1991):

Click on graph for larger image.
NOTE: New Home Sales and Construction employment were normalized to 100 for each peak (see arrows). The '90/'91 recession is in gray according to the NBER dates.
New Home Sales peaked in July of 1989 and construction employment peaked six months later in January of 1990. The recession started in July of 1990.
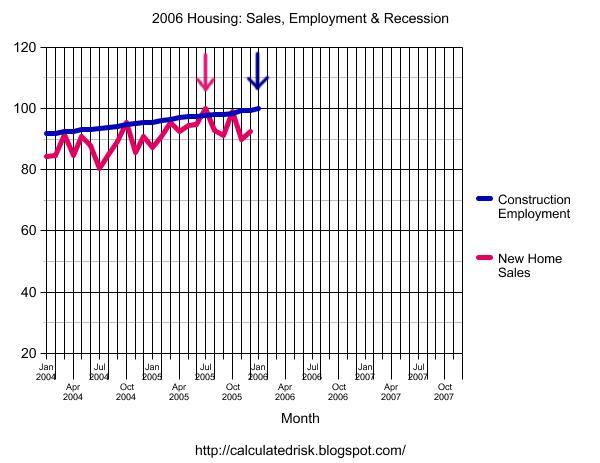
The 2nd graph is looking at the current situation. It appears New Home Sales peaked in July 2005, although October 2005 was very close. It might take a few more months and a few revisions to determine the actual peak.
If the peak did occur in July 2005, then January 2006 would be six months later - a similar lag in employment just like the early '90s. Of course, no two slowdowns are exactly alike.
So far the housing market is following a predictable pattern: rising inventories followed by a decrease in transactions and finally falling prices (like the early '90s in California, Massachusetts and other bubble areas). Housing related employment lags the peak in housing sales.
There are other factors that make the current situation more dangerous: a larger area of "frothy" prices, more leverage and use of exotic loans, and far more equity withdrawal (that supported consumer spending). On the other hand, in the early '90s, there was a huge shift away from defense work (the "peace dividend") and that impacted both California and Massachusetts.
I'll be watching construction employment over the next few months, and I expect to see a reduction in housing related employment.
ISM Report
by Calculated Risk on 2/03/2006 02:50:00 PM
Institute for Supply Management reports: Business Activity at 56.8%.
"Non-manufacturing business activity increased for the 34th consecutive month in January," Kauffman said. He added, "Business Activity and New Orders increased at slower rates in January than in December. Imports, Employment and New Export Orders also increased at slower rates while Prices increased at the same rate as in December. Eight of 16 non-manufacturing industry sectors report increased activity in January compared to 11 that reported increased activity in December. While in almost all indexes growth declined in January, they are still above the value of "50" indicating that growth continues, but at slower rates of growth. Members' comments in January continue to be generally positive concerning current business conditions. Several members mention concerns about the continued high level of energy prices and rising interest rates. The Prices Index held steady this month, but remains in a historically high range for the ISM Non-Manufacturing Business Survey. The overall indication in January is continued economic growth in the non-manufacturing sector, but at slower rates of increase."The weakest industries were: Agriculture; Wholesale Trade; Real Estate; Retail Trade; and Construction. This might be a hint of the housing slowdown, although the BLS numbers showed construction employment was solid in January.
Some of the details are interesting:
| Index | Jan. | Dec. | Change | Direction | Rate |
| Business Activity / Production | 56.8 | 61.0 | -4.2 | Increasing | slower |
| New Orders | 56.0 | 62.2 | -6.2 | Increasing | Slower |
| Employment | 51.1 | 56.9 | -5.8 | Increasing | Slower |
| Supplier Deliveries | 54.5 | 56.5 | -2.0 | Slowing | Slower |
| Inventories | 55.0 | 56.0 | -1.0 | Increasing | Slower |
| Prices | 67.2 | 67.2 | 0 | Increasing | At same rate |
| Backlog of Orders | 52.5 | 54.0 | -1.5 | Increasing | Slower |
| New Export Orders | 58.0 | 61.5 | -3.5 | Increasing | Slower |
| Imports | 49.5 | 56.5 | -7.0 | Decreasing | From Increasing |
| Inventory Sentiment | 63.0 | 59.0 | +4.0 | "Too High" | Greater |
Many activities are still increasing, but at a slower rate than in December. Employment is barely increasing (51.1) and prices are perceived to be a problem. Inventory sentiment is to too high and increasing at a greater rate. And imports are now decreasing (slightly). All signs that the expansion may be past its peak.
Employment Report
by Calculated Risk on 2/03/2006 01:32:00 PM
The employment report was mostly ho hum. The exception was the drop in the unemployment rate to 4.7%. 
Click on graph for larger image.
This graph shows employment growth for Bush's second term. So far job growth has been about as expected. So why has the unemployment rate decreased?
The answer has to do with the employment participation rate. Over the last 5 years, the civilian noninstitutional population has added about 2.7 million people per year (those 16 years and over). Over the last 12 months the population has added 2.716 million - in line with previous years.
However, over the last 5 years, only about 1.2 million people per year have joined the civilian labor force. This is very puzzling, especially since it is unlikely that the baby boomers are retiring in significant numbers yet. More likely there is a fairly large group of people that would choose to join the labor force with higher incentives. Therefore I think, even with a 4.7% unemployment rate, there is still substantial slack in the labor market and the US will not see wage inflation pressures in the short term.
Once again, construction played a significant role in employment gains. For more, see Kash's Job Growth by Industry.
Thursday, February 02, 2006
US housing bubbles: Half froth?
by Calculated Risk on 2/02/2006 03:06:00 PM
The New Economist reviews the HSBC report: A Froth-Finding Mission: detecting US housing bubbles
The report itself concludes that the "glass is half froth":The New Economist is not overly concerned:
We suggest that about half of the US housing market is frothy and that this ‘bubble zone’ may be overvalued by as much as 35-40%, after taking into account low interest rates and tax advantages. Current valuations imply a large permanent reduction in the risk premium and/or a sizable step up in future capital gains, not all of which, we think, is justified. ... Therefore, when these housing bubbles begin to deflate, it is likely to have substantial macroeconomic consequences.
I do not consider this to be the greatest threat facing the US or global economy. As I have argued before, the experience of both the Reserve Bank of Australian and Bank of England is that housing bubbles can successfully be deflated over a 2-3 year period by steady rate hikes and clear, consistent messages to investors. If the Federal Reserve is able to follow their example - and there's no obvious reason why they can't - that would detract around 1.0 to 1.5 percentage points a year from GDP growth. Enough to drag annual US growth below trend, but nowhere near recession territory.I'm not quite as sanguine.


