 RSS Feed
 by Calculated Risk on 11/17/2005 03:16:00 PM
Thursday, November 17, 2005
DataQuick on Bay Area: Lower Sales, Flat Prices
DataQuick reports: Continued sales slowdown in Bay Area, appreciation flat
The number of homes sold in the nine-county Bay Area declined on a year-over-year basis for the seventh month in a row in October, the result of rising mortgage interest rates and reduced demand, a real estate information service reported.
A total of 10,508 new and resale houses and condos were sold in the region last month. That was down 6.2 percent from 11,205 for September, and down 6.0 percent from 11,180 for October last year, according to DataQuick Information Systems.
Sales have been lower compared to 2004 every month since April. So far this year 107,099 Bay Area homes have been sold, 5.1 percent fewer than 112,873 for the same ten-month period last year.
"We look at today's market as normalizing. Everybody seems to have gotten used to the records set last year and the year before. The fact is that last month was the third-strongest October since we started keeping records in 1988. It was about twenty percent above average," said Marshall Prentice, DataQuick president.
The median price paid for a Bay Area home was $614,000 last month. That was down 0.3 percent from $616,000 in September, and up 17.2 percent from $524,000 for October a year ago. Annual price increases so far this year have ranged from 17.2 percent to 20.5 percent.
West Coast Ports: October Imports Mixed, Exports Up
by Calculated Risk on 11/17/2005 10:32:00 AM
The Ports of Long Beach and Los Angeles reported mixed import traffic for October.
Import traffic at the Port of Long Beach decreased 4.5% compared to September. A total of 299 thousand loaded cargo containers came into the Port of Long Beach, compared to 313.5 thousand in September.
The Port of Los Angeles import traffic increased 5% in October. Imports were 368.8 thousand containers, setting a new all time record for the Port of Los Angeles.
For both ports, outbound traffic recovered from the September slump. For Long Beach, outbound traffic was up 6.6% to 103 thousand containers. At Los Angeles, outbound traffic was up 5.5% to 98 thousand containers.
The quantity of containers says nothing about the content value, but provides a rough guide on imports from China and the rest of Asia. Given these numbers, I expect imports from Asia to be about the same in October as in September.
Wednesday, November 16, 2005
NAHB: Builder Confidence Falls
by Calculated Risk on 11/16/2005 02:11:00 PM
The National Association of Home Builders reports: Builder Confidence Declines In November
Responding to sharply lower measures of consumer confidence as well as rising mortgage rates and other factors in recent months, single-family home builders are adjusting their market expectations downward to a still favorable perspective, according to the National Association of Home Builders/Wells Fargo Housing Market Index (HMI) for November, released today.Here is the table of the HMI components.
The index declined eight points to rest at 60, a level well above the midpoint that indicates the majority of builders still see conditions as positive in their markets.
“It’s important to keep today’s report in perspective,” said NAHB President Dave Wilson, a custom home builder from Ketchum, Idaho. “Many builders still have substantial backlogs of unfilled orders and will remain quite busy in coming months. But we’re well aware that some slowing of demand is inevitable following the record-breaking sales activity that has prevailed for some time.”
“No huge drop is in the cards – the sharp decline in the HMI probably overstates the actual degree of deterioration in the single-family market, and it’s most likely that we’re engaged in an orderly cooling process that will lead to somewhat lower home sales and production in the future,” added NAHB Chief Economist David Seiders. “We’re looking for a 5 or 6 percent decline in home sales next year, compared to 2005.”
Derived from a monthly survey that NAHB has been conducting for approximately 20 years, the NAHB/Wells Fargo HMI gauges builder perceptions of current single-family home sales and sales expectations for the next six months as either “good,” “fair” or “poor.” The survey also asks builders to rate traffic of prospective buyers as either “high to very high,” “average” or “low to very low.” Scores for each component are then used to calculate a seasonally adjusted index where any number over 50 indicates that more builders view sales conditions as good than poor.
Each of the HMI’s component indexes registered declines this time around. The index gauging current sales activity fell eight points to 66, while the index gauging sales expectations for the next six months dropped nine points to 64 and the index gauging traffic of prospective buyers fell five points to 46.
Seiders cited deterioration in consumer attitudes in recent months, spurred by the recent hurricanes and resulting higher energy prices, as a significant factor in November’s builder confidence gauge. He also cited rising interest rates on both fixed- and adjustable-rate mortgages. Fixed rates averaged 6.35 percent in the survey period compared to 6 percent in the prior month and 5.7 percent in the month before that.
“In addition, affordability problems have arisen as house price gains have accumulated in many parts of the country,” he said. “So while the balance of builder attitudes is still positive, most are less exuberant than at the HMI’s last peak in the middle of this year” (the index hit 72 in June). The last time the HMI hit 60 was in May of 2003.
Though builder confidence was down across all regions of the country, ongoing trends prevailed to keep those in the West at the highest end of the confidence scale and those in the Midwest at the lower end. In the West, the HMI fell from a very high level of 91 in October to a still-impressive 78 in November, while in the South, it declined from 76 to 68. In the Northeast, the gauge slipped six points to 61, while continued job-market weakness in the Midwest brought that region’s HMI down from 45 to 38.
MBA: Mortgage Activity Steady
by Calculated Risk on 11/16/2005 11:30:00 AM
The Mortgage Bankers Association (MBA) released its weekly survey today:
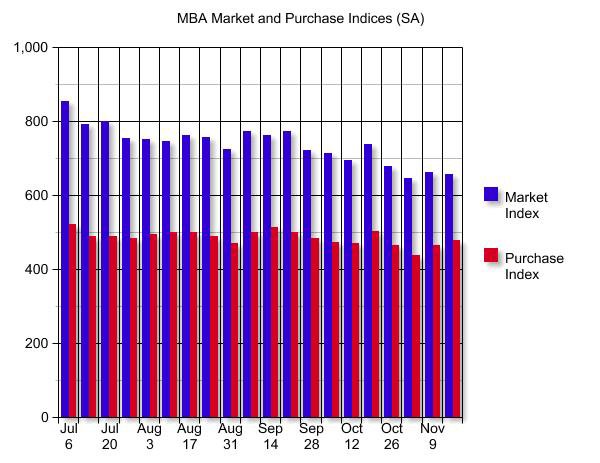
The Market Composite Index — a measure of mortgage loan application volume – was 657.6 a decrease of 0.6 percent on a seasonally adjusted basis from 661.3, one week earlier. On an unadjusted basis, the Index decreased 12.1 percent compared with the previous week and was down 13.7 percent compared with the same week one year earlier.
Click on graph for larger image.
This graph show the seasonally adjusted MBA Market and Purchase indices since the beginning of July. The market index had been steadily declining for several months, mostly reflecting a slowing in refinance activity, but has been flat over the last couple of weeks.
The purchase index had stayed steady, reflecting the continued strength in new and existing homes sales. The Purchase index started to fall early this month, probably indicating slowing home sales, but has risen slightly over the last couple of weeks (these numbers are seasonally adjusted).
Mortgage interest rates continued to rise:
The average contract interest rate for 30-year fixed-rate mortgages increased to 6.33 percent from 6.31 percent on week earlier...This is up from 6.06 percent three weeks ago.
The average contract interest rate for 15-year fixed-rate mortgages increased to 5.87 percent from 5.85 percent...This is up from 5.37 percent three weeks ago.
Tuesday, November 15, 2005
DataQuick: Southland home sales, prices still near peak
by Calculated Risk on 11/15/2005 06:32:00 PM
DataQuick reports on Southern California: Southland home sales, prices still near peak
Southland home sales were up slightly for the third month in a row, led by strong sales in the Inland Empire and increased inventory levels regionwide. Appreciation rates remain in the mid-teens, a real estate information service reported.DataQuick President Marshall Prentice remains optimistic:
A total of 28,489 new and resale homes were sold in Los Angeles, Riverside, San Diego, Ventura, San Bernardino and Orange counties last month. That was down 10.2 percent from 31,470 in September, and up 1.1 percent from 28,189 for October last year.
"The big question is still whether or not the real estate market will end this cycle with a crash, or with a soft landing. Right now the latter scenario is still the most likely. Home values have doubled in the past four years and almost all, if not all, of those gains are here to stay."
Orange County: Home Prices Decline for 2nd Month
by Calculated Risk on 11/15/2005 12:32:00 PM
The OC Register reports: Sales price for O.C. housing drops for second month
Orange County's housing market continues to cool as overall sales prices fell for the second straight month.These numbers are not seasonally adjusted:
DataQuick reported today that the median sales price for all types of O.C. residences in October was $606,000 -- that's down $4,000 from September and down $11,000 from the record high set in August, $617,000.
Still, October's price was up 14 percent from the median a year before.
Sales of 3,614 homes and condos -- resales and new construction -- closed last month. That's up 3 percent from October of last year.
October's overall 0.7 percent price drop is no big surprise. Since 1988, Orange County home prices have fallen on average by 0.4 percent in the month of October. Prices have dropped in October in 11 out of the past 18 years.
October is one of four months where home prices typically drop, according to DataQuick figures. July, September and October –- three months with historically falling prices -- reflect a typical sales slowdown after the spring's peak selling season. From 1988 to 2004, home prices appreciated a combined 6.7 percent in February through June –- but just 0.4 percent the rest of the year.
Housing: Hot Prices and Anti-Bubble Reports
by Calculated Risk on 11/15/2005 11:37:00 AM
The AP reports: Home prices show sharp increases
The nation's booming housing market continued to push prices higher in the summer and early fall with 69 metropolitan areas reporting double-digit increases compared with a year ago, a real estate trade group reported Tuesday.The National Association of Realtors presents "anti-bubble reports" for 130 markets with the lead:
The National Association of Realtors said that the median price of an existing home rose by 14.7 percent in the July-September quarter to $215,900, compared with a median price of $188,200 a year ago. The median is the midpoint where half the homes sold for more and half for less.
Led by Phoenix, Ariz., and Orlando, Fla., the nation's hottest markets far outperformed the nationwide figure. The price of existing homes sold during the third quarter in the Phoenix-Mesa-Scottsdale area jumped to $268,000, a whopping 55.2 percent higher than the same period a year ago. Orlando has the second biggest increase, a gain of 44.8 percent to $261,300, followed closely by Cape Coral-Fort Myers, Fla., where home prices were up 42.5 percent to $277,600.
Some economists have expressed concern that demand for housing in some parts of the country is being driven by a speculative frenzy that could burst the price bubble as mortgage rates continue to climb. Freddie Mac's nationwide survey showed that the 30-year mortgage hit 6.36 percent last week, the highest level in more than two years.
However, most analysts believe that rising mortgage rates will simply moderate the double-digit gains in home prices that home sellers have enjoyed in recent years, rather than cause sharp declines in home prices.
...
The Realtors' latest survey showed that 69 metropolitan areas - nearly half of the 147 areas surveyed - enjoyed double-digit price gains in the July-September quarter compared with a year earlier.
These downloadable 10-page reports show that the facts simply do not support the possibility of a housing bust -- not for these 130 markets and not for the nation.
Monday, November 14, 2005
Housing: The Big Chill
by Calculated Risk on 11/14/2005 08:55:00 PM
CBS reports: Chill Settles Over Housing Market
"There is evidence of a cooling going on nationwide," she tells The Early Show co-anchor Julie Chen. "Median prices are falling some, inventory is up, rents are up, mortgage applications are down and if you look around, you probably see more signs for open houses, something that wasn't necessary just a couple of months ago. And more of those 'price reduced' signs as well, particularly in the luxury market.And the most "chilling" advice for sellers:
"What's been happening, specifically, over the past couple of months is you have all these people putting their homes on the market. Investors and individuals alike are testing the market to some degree to see if they can cash out and get out while the going's good. That is pushing inventory up.
"But buyers aren't jumping in feet first, as they were just a couple of months ago. They are taking their sweet time and they can actually afford to take a little more time. There's more of a balance now between the buyers and the sellers that we haven't seen in quite awhile.
"You're probably not going to get the price you wanted for a comparable home six months ago."
Home Equity Extraction
by Calculated Risk on 11/14/2005 12:21:00 AM
My most recent post is up on Angry Bear, Housing: "With a pfffffffft or a fizzle"
On equity extraction, Freddie Mac reported on Nov 1st: CASH-OUT REFINANCE ACTIVITY STRONG IN THIRD QUARTER 2005
"Refinancing activity was strong in the third quarter, even with higher interest rates with 44 percent of new mortgage applications being submitted for refis," said Amy Crews Cutts, Freddie Mac deputy chief economist. "The large share of borrowers who took cash out when refinancing their mortgages combined with the strong overall refinance volume led to an extraction of home equity through prime first-lien refinances of $60.4 billion, almost equal to the revised estimate of $60.7 billion extracted in the second quarter. With the expectation that mortgage rates will rise further in the fourth quarter, refinance volumes overall should slow but cash-out refis will continue to be in demand, and equity extraction through refinance should hit over $200 billion this year, falling to about $114 billion in 2006."So far equity extraction remains strong.
Sunday, November 13, 2005
San Diego: Home Prices and Inventory
by Calculated Risk on 11/13/2005 08:32:00 PM
The San Diego Union Tribune reports: 'Median home price tops $500,000, a first'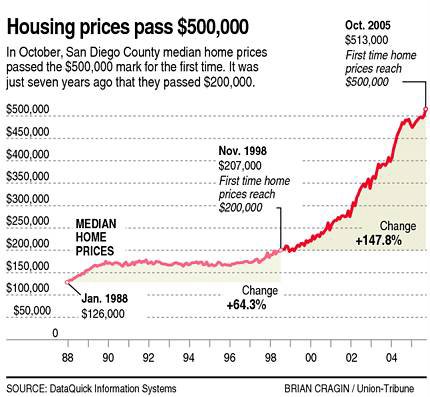 Click on graph for larger image.
The year-over-year increase to $513,000 was 4.9 percent above October 2004's $489,000, the sixth month in a row that appreciation has been below 10 percent.And on inventories and foreclosures:
October was the 16th month in a row that sales volume has declined on a year-over-year basis. The total last month was 4,155, down from 4,758 a year ago.
In a separate report from the San Diego Association of Realtors, the inventory of active, unsold listings crossed the 15,000 mark for the first time since the present boom began in 1997. By contrast, at the peak in March last year, there were only 3,113 listings.Foreclosures are still very low, but rising. The story doesn't provide the exact inventory number, but the inventory to sales ratio is about 3.6 months - still within the normal range.
Coupled with rising interest rates – which rose to a two-year high of 6.31 percent this week – and a suddenly soaring foreclosure notice rate – up nearly 40 percent for the third quarter compared with a year ago – industry analysts said San Diego's housing boom seems to be coming to a quiet end.
...
... there are early signs of distress. DataQuick's Karevoll said the notice of default rate – the first sign of foreclosure – soared nearly 40 percent to 906 notices in the third quarter. But he said it was far below the peak of 5,139 in the first quarterly of 1996. Only 47 actual foreclosures occurred in the third quarter, compared with 33 a year ago.


