 RSS Feed
 by Calculated Risk on 11/14/2005 12:21:00 AM
Monday, November 14, 2005
Home Equity Extraction
My most recent post is up on Angry Bear, Housing: "With a pfffffffft or a fizzle"
On equity extraction, Freddie Mac reported on Nov 1st: CASH-OUT REFINANCE ACTIVITY STRONG IN THIRD QUARTER 2005
"Refinancing activity was strong in the third quarter, even with higher interest rates with 44 percent of new mortgage applications being submitted for refis," said Amy Crews Cutts, Freddie Mac deputy chief economist. "The large share of borrowers who took cash out when refinancing their mortgages combined with the strong overall refinance volume led to an extraction of home equity through prime first-lien refinances of $60.4 billion, almost equal to the revised estimate of $60.7 billion extracted in the second quarter. With the expectation that mortgage rates will rise further in the fourth quarter, refinance volumes overall should slow but cash-out refis will continue to be in demand, and equity extraction through refinance should hit over $200 billion this year, falling to about $114 billion in 2006."So far equity extraction remains strong.
Sunday, November 13, 2005
San Diego: Home Prices and Inventory
by Calculated Risk on 11/13/2005 08:32:00 PM
The San Diego Union Tribune reports: 'Median home price tops $500,000, a first'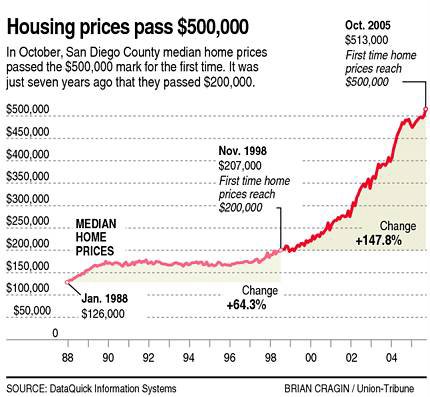 Click on graph for larger image.
The year-over-year increase to $513,000 was 4.9 percent above October 2004's $489,000, the sixth month in a row that appreciation has been below 10 percent.And on inventories and foreclosures:
October was the 16th month in a row that sales volume has declined on a year-over-year basis. The total last month was 4,155, down from 4,758 a year ago.
In a separate report from the San Diego Association of Realtors, the inventory of active, unsold listings crossed the 15,000 mark for the first time since the present boom began in 1997. By contrast, at the peak in March last year, there were only 3,113 listings.Foreclosures are still very low, but rising. The story doesn't provide the exact inventory number, but the inventory to sales ratio is about 3.6 months - still within the normal range.
Coupled with rising interest rates – which rose to a two-year high of 6.31 percent this week – and a suddenly soaring foreclosure notice rate – up nearly 40 percent for the third quarter compared with a year ago – industry analysts said San Diego's housing boom seems to be coming to a quiet end.
...
... there are early signs of distress. DataQuick's Karevoll said the notice of default rate – the first sign of foreclosure – soared nearly 40 percent to 906 notices in the third quarter. But he said it was far below the peak of 5,139 in the first quarterly of 1996. Only 47 actual foreclosures occurred in the third quarter, compared with 33 a year ago.
Friday, November 11, 2005
Drucker on Bubbles
by Calculated Risk on 11/11/2005 08:05:00 PM
Management Guru Peter Drucker, 95, Dies
Innovation, listening to your customers, taking care of your employees - it all seems so obvious today. It wasn't so obvious 60 years ago. Here are a few quotes from Drucker:
On bubbles:
"Pigs gorging themselves at the trough are always a disgusting spectacle, and you know it won't last long."
"The average duration of a soap bubble is known. It's about 26 seconds," Drucker said. "Then the surface tension becomes too great and it begins to burst.On metrics:
"For speculative crazes, it's about 18 months."
"Checking the results of a decision against its expectations shows executives what their strengths are, where they need to improve, and where they lack knowledge or information."On Leadership:
"Effective leadership is not about making speeches or being liked; leadership is defined by results not attributes."
"Executives owe it to the organization and to their fellow workers not to tolerate nonperforming individuals in important jobs."
Housing: Foreclosures and Unemployment
by Calculated Risk on 11/11/2005 04:36:00 PM
First comes rising housing inventories, then slowing activity and less mortgage extraction, followed by a drop in retail sales, rising foreclosures, falling house prices and less housing related employment. At least that is the general sequence I expect.
In Massachusetts, inventories to sales is already over 8 months, prices have started to fall and foreclosures are rising: A rise in foreclosures
Don't look now, but that whistling sound you're hearing is the air leaking out of the housing bubble.And from Australia, a country that has already seen falling housing prices: Unemployment rate rises further
...
More disturbing yet is a sharp rise in foreclosures. Over the first nine months of this year, foreclosures in Massachusetts are up 33 percent over the same period in 2004.
"We are seeing a big increase, we've seen a steady increase, and there's going to be more going forward," Jeremy Shapiro, president and co-founder of Framingham-based ForeclosuresMass.com said.
Behind the figures lie several factors. Zero-interest mortgages allowed buyers to borrow more than they could afford. Interest rates are going up, pushing up payments for those holding adjustable-rate mortgages. Families mortgaged to the hilt can't handle it when one earner loses a job or some unexpected expense comes up.
Job-shedding in Australia has extended into a second month.Most of the United States is in the 'rising inventories' phase, but these stories depict the probable future for much of the US.
A plunge in full-time job numbers has more than offset a solid rise in part-time positions.
Official figures show full-time places slumped in October by 60,800 - the worst outcome since the 1991 recession.
The number of people looking for work has declined, and that has kept a lid on the rise in the jobless rate.
It now stands at 5.2 per cent.
FRBSF Economic Letter: Spendthrift Nation
by Calculated Risk on 11/11/2005 01:08:00 PM
Senior economist Kevin J. Lansing of the San Francisco Federal Reserve Bank writes: Spendthrift Nation
In September 2005, the personal saving rate out of disposable income was negative for the fourth consecutive month. A negative saving rate means that U.S. consumers are spending more than 100% of their monthly after-tax income. The recent data are part of a trend of declining personal saving rates observed for two decades. During the 1980s, the personal saving rate averaged 9.0%. During the 1990s, the personal saving rate averaged 5.2%. Since 2000, the personal saving rate has averaged only 1.9%.Dr. Lansing presents a model of wealth effects on savings and compares the model to actual data:
This Economic Letter discusses some of the factors that appear to be driving the secular decline in the personal saving rate. These factors include rapid increases in stock market and residential property wealth, which households apparently view as a substitute for the quaint practice of putting aside money each month from their paychecks. Rapidly rising stock and house prices, fueled by an accommodative environment of low interest rates and a proliferation of "exotic" mortgage products (loans with little or no down payment, minimal documentation of income, and payments for interest-only or less) have sustained a boom in household spending and provided collateral for record-setting levels of household debt relative to income.
Going forward, the possibility of cooling asset markets and rising borrowing costs may cause the personal saving rate to revert to levels which are more in line with historical averages. While such a development would act as near-term drag on household spending and GDP growth, an increase in domestic saving would help correct the large imbalance that now exists in the U.S. current account (the combined balances of the international trade account, net foreign income, and unilateral transfers).

Figure 4 plots the U.S. personal saving rate together with the fitted saving rate from the model. The simple behavioral model can account for 89% of the variance in the U.S. personal saving rate from 1960:Q1 to 2005:Q1. A slightly improved fit can be obtained by adding a time trend to the regression equation. A time trend is a proxy for ongoing credit industry innovations (growth of subprime lending, home equity loans, exotic mortgages, etc.) which have expanded consumer access to borrowed money and reduced the need for precautionary saving.Hat tip to Joshua for sending me the article!
Figure 4 suggests that the decades-long decline in the U.S. personal saving rate is largely a behavioral response to long-lived bull markets in stocks and housing together with falling nominal interest rates over the same period. Since 2000, the rate of residential property appreciation has been more than double the growth rate of personal disposable income. In many areas of the country, the ratio of house prices to rents (a valuation measure analogous to the price-earnings ratio for stocks) is at an all-time high, raising concerns about a housing bubble. Reminiscent of the widespread margin purchases by unsophisticated investors during the stock market mania of the late-1990s, today's housing market is characterized by an influx of new buyers, record transaction volume, and a growing number of property acquisitions financed almost entirely with borrowed money.
According to the model, the personal saving rate would be expected to halt its decline and start moving up if stock or housing markets sagged, or if long-term interest rates jumped, say, due to inflation fears. An increase in the personal saving rate would slow the growth of household spending which, in turn, would have negative implications for the derived demands of business investment, inventory accumulation, and business hiring. But, on a positive note, a pickup in saving activity in the household sector would help offset the ongoing deficit spending in the government sector. A rise in net domestic saving would reduce the U.S. economy's reliance on foreign capital inflows as a source of saving. At present, the U.S. current account deficit stands at more than 6% of GDP, implying that the U.S. economy must draw in around $3 billion per day from foreign investors to finance domestic spending.
Housing Affordability and More
by Calculated Risk on 11/11/2005 11:50:00 AM
First, two articles on DC and Phoenix:
Housing Market Cooling, Data Say
In Washington, Sales Are Down, Inventory Is Up
The trend is most striking in Northern Virginia, where most of the region's growth has occurred, but it is evident almost everywhere. Statistics on home sales released by Metropolitan Regional Information Systems Inc., the regional multiple-listing service, show that:Phoenix: Housing market cools ... along with weather
In the two counties and three cities that make up the Northern Virginia market, more than twice as many homes were available for sale in October as in the same month one year ago -- 7,122 homes, compared with 3,254 -- and sales are off 28 percent.
In the District, listings are up 62 percent and sales are down 28 percent.
In Montgomery County, listings are up 49 percent and sales are down 8 percent.
In Prince George's County, the listings are up 45 percent. But home sales have remained fairly stable, dropping only 2.6 percent.
The last time the region had this many houses for sale was the late 1990s, the MRIS figures show.
Phoenix real estate executive Rich Rector has been seeing something unusual lately as he makes his rounds: "Open House" signs.And on affordability: C.A.R. reports California's Housing Affordability Index fell four points to 15 percent in September
...
Whatever the reasons, there are signs the frenzy is coming to an end. There are now 17,000 residential properties listed for sale, up from just 5,000 a few months ago, and would-be buyers have regained some of their bargaining power.
The percentage of households in California able to afford a median-priced home stood at 15 percent in September, a 4 percentage-point decrease compared with the same period a year ago when the Index was at 19 percent, according to a report released today by the California Association of REALTORS® (C.A.R.). The September Housing Affordability Index (HAI) increased 1 percentage point compared with August, when it stood at 14 percent.
Thursday, November 10, 2005
Housing Inventory: DC and Tucson
by Calculated Risk on 11/10/2005 01:28:00 PM
Inventories continue to rise. The following graph (thanks to DC Broker DC1000) shows sales and active listing over the last year:
Click on graph for larger image.
Although inventories have surged since August, the ratio of inventory to sales is only 3.44 - still low by historical standards.
Also, prices have been mostly flat over the last 7 or 8 months. And days on market hasn't risen substantially yet.
In Tucson, The Daily Star reports: Tucson-area home-price rise resumes. The lead is the small increase in area prices, but inventories reached a ten year high:
Tucson-area home values broke out of a four-month malaise in October, with the median sale price increasing by $5,000 to $224,000.Tucson's inventory to sales ratio is now 3.9 months.
But the number of homes available for sale in the metropolitan area has reached a 10-year-high, suggesting that Tucson's housing market is becoming more favorable to buyers.
...
Although active listings climbed to 5,330, the market appears healthy, said Judy Lowe, president of the Tucson Association of Realtors Multiple Listing Service. With more homes for sale, Vest said, the market pendulum is swinging back toward buyers, but it "still has a long way to go."
...
The number of houses sold was down 2.6 percent, from 1,404 in September to 1,368 in October. October's sales were still up by 5.6 percent compared with the 1,295 homes sold in October 2004.
September Record Trade Deficit: $66.1 Billion
by Calculated Risk on 11/10/2005 08:30:00 AM
The U.S. Census Bureau and the U.S. Bureau of Economic Analysis released the monthly trade balance report today for September:
"... total September exports of $105.2 billion and imports of $171.3 billion resulted in a goods and services deficit of $66.1 billion, $6.8 billion more than the $59.3 billion in August, revised.Note: all numbers are seasonally adjusted.
September exports were $2.8 billion less than August exports of $108.0 billion. September imports were $4.0 billion more than August imports of $167.3 billion."

Click on graph for larger image.
The September record was the result of both a sharp drop in exports and a significant increase in imports.
Imports from China set another record of $23.307 Billion, while exports to China were off from August ($3.2 Billion vs. $3.9 Billion). Imports from Japan were off slightly to $10.9 Billion.

The average contract price for oil set a new record of $57.32 per barrel breaking the old record of $52.65 in July. Crude oil imports dropped significantly, but the quantity of refined products increased. On a NSA basis, the value for September imports was the same as August petroleum imports.
The SA petroleum trade deficit set another record of $22.2 Billion.
This was a difficult month to forecast due to the hurricanes.
Wednesday, November 09, 2005
Remarks by John C. Dugan, Comptroller of the Currency
by Calculated Risk on 11/09/2005 09:47:00 PM
Here is the text of John Dugan's recent remarks at the OCC Credit Risk Conference. It is an easy read and well worth the few minutes. Dugan makes several key points:
1) This is the top of the credit cycle and standards are slipping.
2) Risk is overly concentrated in commercial real estate and residential mortgages.
3) Certain loans are especially risky.
4) The goal for the new interagency guidance is the end of 2005.
This is the "top of the credit cycle":
"... it’s at the top of the credit cycle where stresses and weaknesses typically appear, so what we are seeing today should not surprise anyone. With liquidity pouring into the market, we would expect to see increased competition for loan customers – and we are. With competition intensifying, we would expect to see underwriting standards easing – and we are. And we would expect to find emerging concentrations in some loan categories, such as commercial and residential real estate. We are most definitely seeing that."And there is concern about mortgage risk:
"Today’s non-traditional mortgage products – interest-only, payment option ARMs, no doc and low-doc, and piggyback mortgages, to name the most prominent examples – are a different species of product, with novel and potentially risky features.And more on Option ARMs:
...
This dominance is increasingly reflected in the numbers. By some estimates, interest-only products constituted approximately 50 percent of all mortgage originations last year. In the first half of 2005, IOs started to decline in favor of payment-option ARMs, which, according to one source, comprised half of new mortgage originations. And roughly every other mortgage these days is also a “piggyback” or reduced documentation mortgage, which points to another development that concerns us: the trend toward "layering" of multiple risks. There is no doubt that when several risky features are combined in a single loan, the total risk is greater than the sum of the parts.
We can readily understand why these new products have become fixtures in the marketplace in such a short time. One reason is that they have helped sustain loan volume that would otherwise almost certainly be falling, because rising interest rates have brought an end to the refinance boom. More important, lenders have scrambled to find ways to make expensive houses more affordable – although there’s now a concern that the very availability of this new type of financing has done its share to help drive up house prices, which in turn stimulates demand for even more non-traditional financing."
"And then there are payment-option ARMs, which take us to another level of risk. ... borrowers can easily treat payment-option ARMs in the same manner as a traditional mortgage, simply by selecting the fully amortizing option rather than the minimum payment option each month.And on the new interagency mortgage guidance project:
In practice, however, few borrowers treat them that way. Recent studies show that a significant number of borrowers are frequently choosing to pay the minimum amount possible, a payment amount that typically falls short of the interest accruing on the loan. Even more disturbing, this choice does not seem limited to high quality, affluent borrowers who may be using the product as a payment flexibility tool. The research indicates that borrowers at both ends of the FICO spectrum make this choice, with riskier borrowers resorting to it most frequently. Because such minimum payments fall considerably short of the total interest accruing each month, the unpaid interest is added to the loan principal, and negative amortization occurs. Thus, it should come as no surprise that, of the least creditworthy holders of payment-option ARMs, nearly 50 percent have current balances above their original loan amount."
"This guidance will focus on underwriting standards, appropriate disclosure, and portfolio management concerns. Our current goal is to ready the guidance for release by year’s end, although serious interagency discussions about the initial draft have only just begun."Well worth reading.
Bernanke and the Housing Bubble
by Calculated Risk on 11/09/2005 08:51:00 PM
The Center for Economic and Policy Research released a new report today: "Will a Bursting Bubble Trouble Bernanke? The Evidence for a Housing Bubble". Dean Baker and David Rosnick conclude:
This paper has briefly examined three trends that strongly support the view that the recent run-up in house prices is driven by a speculative bubble, rather than fundamentals. First, it notes the unusual gap between the run-up in home sale prices and rents at both the national level and in many of the most inflated metropolitan markets. .... When such gaps have developed in the past, they usually have been followed by sharp declines in house sale prices.
The second factor suggesting that the current run-up reflects a bubble is the extraordinary pace of home construction in recent years. ... This pace of construction substantially exceeds that rate of new household formation. It is also worth noting that virtually no economists projected a sharp price in home construction in the mid-nineties, so most of the economists who expect the current pace of housing construction to persist, badly erred in their projections for housing construction in the past.
Finally, the wealth effect resulting from the recent run-up in house prices has led to a sharp decline in the savings rate. In recent months, the savings rate has turned negative. If construction continues at its recent pace and real house prices stay at current levels, then the savings rate will become even more sharply negative over the next decade.
...
It is not plausible that an economy will sustain a negative savings rate for any substantial period of time. This would imply that households’ non-housing wealth is continually declining. The more likely scenario is that housing prices will fall back in line with their historic values.
...
The costs of a collapse of the housing bubble will be even greater than the costs of the collapse of the stock bubble, because housing wealth is much more evenly held. The failure of the economics profession to adequately warn of the stock bubble was an act of extraordinary negligence. Missing the housing bubble is an even bigger mistake.


