 RSS Feed
 by Calculated Risk on 8/18/2005 08:16:00 PM
Thursday, August 18, 2005
Oil's Impact on the Economy
Several blogs are commenting on oil's potential impact on the economy. First a quote:
"People are able to pull money out of their homes and put it into their gas tanks," said Mark Zandi, chief economist at Economy.com. "So the overall effects on consumer spending have been small."Mortgage extraction to purchase consumables is probably not a viable long term strategy. Dr. Roubini comments:
Until now consumers have reacted to the oil shock as if it was a temporary shock: when a shock to real income is temporary it is optimal to maintain the consumption level and reduce savings in face of reduced real income. But if the shock is persistent or permanent the rational response to the reduced income should a reduction in consumption equivalent to the permanent reduction of income with little effect on savings. U.S. consumers have reacted so far to the oil shock as if it was temporary and they have further reduced their savings rate down to zero; but two years of large and protracted increases in oil prices suggest that part of the shock is permanent. With already stretched and slow-growing incomes, U.S. consumer have dipped into their rising housing wealth and borrowed more and more against it, in part to finance the real income shock from higher oil prices.Professor Hamilton expresses concern that consumer psychology might be changing:
In my opinion, the reason that the oil price increases of the last two years have not caused a recession yet is that they have built up gradually, and resulted not from a drop in supply but instead from strong global demand. Faced with a gradual price increase and rising incomes, most people have been able to adapt to the higher prices and make adjustments in an orderly way that does not cause serious economic dislocations.Barry Ritholtz, who is already predicting a recession in 2006, also comments on consumer psychology:
On the other hand, just within the last couple of weeks, I've been hearing a lot more expressions of anxiety and concern-- the sort of psychological factors that produce abrupt spending changes.
While Oil may be a much smaller percentage of GDP today than it was in the 1970s, the relative financial conditions of indebted consumers may also be that much less able to absorb an extended shock than it was then.And as usual, I provide a few graphs over on Angry Bear. Dr. Roubini concludes:
...
Record high gasoline prices, that fall back a little but stay inflated; Add a housing boom that doesn't crash, but merely fizzles. The ongoing refinacing machine which drove so much consumer spending decellerates rapidly. Add to it a War which the majority of the country now believes turns out to be "Not worth it" and a significant percent (though not quite a majority) beleives we were led into under "false premises." Lastly, the myriad stimulus from the government -- tax cuts, ultra low interest rates, deficit spending, increased money supply, military expenditures -- all begin to fade.
What might all this a recipe for?
Is there a risk of an outright recession? Probably not as consumption is still firm and labor market conditions are modestly improving. But a significant U.S. growth slowdown by year end to a level below the 3.5% U.S. potential growth rate cannot be excluded: growth slumping towards the 2.0-2.5% range by early 2006 cannot be ruled out if oil prices remain at current level. And the expectation that the Fed may ease in face of such economic slowdown may prove incorrect: with a housing bubble and a large current account deficit and a core inflation rate that may be creeping soon above 2% the Fed may not be able to afford to ease if the economy slows down. In 2003 when the concerns were about deflation, the Fed reacted to the pre-Iraqi war oil spike and economic slowdown by reducing the Fed Fund rate to 1%. Today, with inflationary pressures modestly creeping up the Fed would face a much tougher dilemma if the latest oil shock turns to be, as likely, stagflationary.I have a similar view (from my AB post): My view (not Angry Bear) is a combination of a housing slowdown and high energy prices will probably lead to an economic slowdown next year, and possibly a recession.
So, if oil prices remain at the current levels or increase further there is not yet the risk of an outright recession but certainly a high probability of a significant economic slowdown by year end and into 2006.
EDAB/UCLA July Report
by Calculated Risk on 8/18/2005 02:11:00 PM
Economic Development Alliance for Business (EDAB) presents a monthly economic report for the East Bay (Northern California). Christopher Thornberg, Senior Economist for UCLA Anderson Forecast is the author. A few excerpts:
(Hat tip to Brian Smits who sent me this report)
"... unfortunately there is a big problem brewing out there that is unlikely to go away quietly: the massive run-up in real estate prices across the state. Housing prices have continued to grow at a truly spectacular rate across the state and again in the Bay Area. Rampant speculation continues to fuel the fire as investors have seemingly already forgotten the lessons learned so hard in the last major asset bubble that ended not even five years ago. While there are those who try and rationalize the rapid increase in prices, we see no justification for these increases—the fundamentals that drive the price of a housing asset have been pointing to a cool market, not a hot one. Rental growth remains weak, mortgage rates have been rising slowly, and contrary to common belief the pace of home building in the area is completely in line with the growth of the workforce—the so-called housing shortage does not exist. Yes, inventory levels are low but this is due to frantic behavior of buyers."But Thornberg believes the economic problems are a year away:
"There are some preliminary data that show what may be the beginning of the cooling of the market. But a major slowdown is at least a year away, if not more. Expect the recovery to continue well into 2006 and job growth in the East Bay to pick up speed during these 12 months. The end of 2006 or early 2007 will be the beginning of trouble, however."Thornberg presents the following graph showing that housing slowdowns have preceded eight of the 10 recessions since WWII.
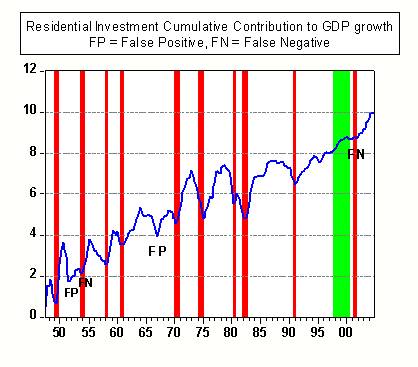
Click on graph for larger image.
New Home Sales is one of my favorite leading indicators. Here are a couple of posts: New Home Sales as Leading Indicator and Update: New Home Sales as Leading Indicator.
I'm looking for a drop in housing transaction as an indicator of an economic slowdown and possible recession in '06. Thornberg also thinks its too early to predict a recession and compares the late '80s slump (leading to the early '90s recession) to today.

"The ... chart shows unit sales and median prices at the end of the late eighties run-up in prices. Market activity peaked in the end of 1988, and price appreciation began to slow within 6 months, and stopped within 18. So keep an eye on market activity, since this will be the first sign of impending problems. More recently unit sales have begun to fall, and you can see some slowdown in price appreciation. This may not be completely convincing evidence since you can see a similar slowdown in 2002 that quickly reversed itself. Of course this time prices are higher and more out of whack relative to income, and interest rates are rising rather than falling. This makes it considerably more likely to be the beginning of the end."
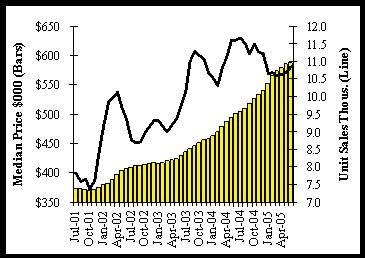
"... as of now the bubble continues to expand. And while there are certainly signs that we are past the peak in this state, activity remains at a historically high pace. There is almost no chance of a major economic slowdown in the next 12 months for the nation ..."There is much more in the report.
Homeowners Debt: "45% of Income not Uncommon"
by Calculated Risk on 8/18/2005 11:24:00 AM
The Mercury News reports: Home buyers get comfy with debt.
One out of five recent buyers have committed more than half their total earnings to homeownership, according to a new study. Slightly over half of home buyers in the past two years spend more than 30 percent of their total income on housing, exceeding a level recommended by the U.S. Department of Housing and Urban Development.If I remember correctly, the limits for borrowers with perfect credit were approximately 33% of income for housing and 40% of income for total debt not long ago. Now one in five of recent buyers are over 50% just for housing. That seems like extremely loose lending practices.
Because the study was based on data from 2003 and 2004, the situation now can only be worse because home prices have continued to rise dramatically since then.
The Public Policy Institute of California, in a study released today, reports that Californians are strategizing and willing to be house poor as never before.Here is the PPIC report: California's Newest Homeowners: Affording the Unaffordable
...
They've been helped by low interest rates and lenient lenders. But more than anything, their success in buying homes results from being inventive and ready to spend an awful lot of their earnings on owning a home.
Port of Los Angeles: Imports Up 5% over June
by Calculated Risk on 8/18/2005 12:46:00 AM
The Port of Los Angeles released their July statistics today. Inbound (loaded containers) was 352 thousand compared to 334 thousand in June - an increase of 5%.
Outbound volume was 97.5 thousand loaded containers vs. 96.6 thousand for June. This is an 1% increase from June.
Port of Long Beach traffic indicated a slight decline in imports for July. Looking at both numbers, I expect imports from China to be flat or off slightly from June to July.
NOTE: The OffPeak initiative (adds late night hours to port operations) started on July 23rd to handle the expected heavier late summer / fall imports.
Wednesday, August 17, 2005
Freddie Mac: Cash-Out Volume Prime Conventional Loans
by Calculated Risk on 8/17/2005 11:26:00 PM
Here is a table of the cash out volumes (according to Freddie Mac) since 1993 (note numbers don't exactly match earlier post - these are the revised numbers):
| YEAR | Equity Extraction | Equity Extraction |
| Billions ($) | Plus 2nd/Heloc $B | |
| 1993 | $19.9 | $39.3 |
| 1994 | $13.8 | $29.2 |
| 1995 | $11.2 | $21.7 |
| 1996 | $17.4 | $34.5 |
| 1997 | $21.4 | $39.1 |
| 1998 | $39.9 | $72.4 |
| 1999 | $37.0 | $71.1 |
| 2000 | $26.2 | $60.4 |
| 2001 | $82.9 | $135.5 |
| 2002 | $111.1 | $170.5 |
| 2003 | $146.9 | $224.4 |
| 2004 | $139.6 | $182.0 |
| 2005(est) | $161.7 | $200.0 |
| 2006(forecast) | $68.7 | $93.6 |
Freddie Mac reports that equity extraction was $102 Billion for the first 6 months of 2005 (they estimate $161.7B for the year).
Some of the surge in the late '90s was attributed at the time to borrowing to invest in the NASDAQ stock bubble. People were concerned by the large jump in equity extraction, especially in '98 and '99. Seems inconsequential now.
The projected drop off next year (of $100 Billion) is approximately 0.8% of GDP (GDP will be over $12 Trillion in '06).
DiMartino:Housing froth still bubbling
by Calculated Risk on 8/17/2005 09:47:00 PM
Danielle DiMartino surveys this week's housing stories for the Dallas Morning News: First the National Association of Home Builders survey:
The housing market index of the National Association of Home Builders declined three points to 67 in August.On the FED and lending standards:
...
"This relationship suggests to us that the purchases of new homes could turn soft in the near term," Northern Trust economist Asha Bangalore wrote recently.
... the Federal Reserve's latest Senior Loan Officer Opinion Survey, it was apparent that, as the Bank Credit Analyst put it, "The Fed speaks but banks don't hear it."And on the Housing ATM:
A quick history lesson: In the past, bankers tightened up lending standards to match the degree of Fed tightening.
"This makes sense, because rising rates boost the odds of loan defaults," the BCA noted. "This time, banks are ignoring the Fed. The new survey shows an increasing willingness to make consumer loans."
...fresh news out of mortgage giant Freddie Mac on Americans' insatiable appetite for cash to fuel their runaway spending habits.... Thanks more to increasing home values than interest rates, in the first half of this year, cash-out refinancings have totaled a record $102 billion.And from Freddie Mac:
Total equity cashed out in the second quarter is estimated at $59 billion, up from the revised cash-out estimate for the first quarter of 2005 of $43 billion.Home Equity Extraction:
... homeowners extracted $140 billion in home equity through first lien refinances in 2004."
2001: $83 Billion
2002: $96 Billion
2003: $139 Billion
2004: $140 Billion
2005: $102 Billion (first 6 months)
From former Fed chief Paul Volcker (quotes and video link - worth a repeat):
"Altogether, the circumstances seem as dangerous and intractable as I can remember."
"Boomers are spending like there is no tomorrow."
"Homeownership has become a vehicle for borrowing and leveraging as much as a source of financial security."
More on Labor Slack
by Calculated Risk on 8/17/2005 03:07:00 PM
Responding to an earlier post, Ken Melvin directs us to some comments in an article in the SF Gate: Want a Wal-Mart job? Join the crowd 11,000 apply for 400 openings at retailer's new Oakland store.
"It's not about Wal-Mart -- it's about the rest of the labor market," [Stephen Levy, an economist for the Center for Continuing Study of the California Economy] said. "If the rest of the labor market was strong, you wouldn't have 11, 000 people applying for 400 jobs."That sure sounds like slack in the labor market.
During the dot-com boom, Levy said, businesses like Starbucks bumped up wages to recruit employees in the middle of a hot job market. But now the situation has reversed, and more people are willing to take whatever they can get.
On the same topic, MaxSpeak has another post today: Measured for Slack. This was a follow-up to the WSJ Econoblog yesterday with Dr. Altig of Macroblog discussing the labor market with MaxSpeak's Max Sawicky and Tom Walker. If you haven't already, check out the WSJ Econoblog: Debating Job-Market 'Slack'.
WSJ: Three on Housing
by Calculated Risk on 8/17/2005 11:32:00 AM
The WSJ covers housing today:
How Will Home Boom End? Even If Prices Don't Collapse, Some Owners Will Feel Pain; Big Mortgages, Little Equity
Near nation's capital, a hot market cools
The Energy in Real Estate, By John Makin, Wall Street Journal Editorial Excerpts can be found at EconomistView. (Thanks to Dr. Thoma)
Dr. Leamer: "Smells" like Housing Turning Point
by Calculated Risk on 8/17/2005 12:00:00 AM
Dr. Leamer, economist and UCLA Anderson Forecast Director, said today:
"It's going to take several more months of information before we know whether this month was the turning point, but it sure smells like it,"I agree. I'd like to see an increase in inventories, a drop in sales and the flattening of prices over several months before I call the top - but it sure "smells like it" right now.
Leamer said he suspects the affordability crunch is putting the brakes on San Diego's market, where the annual price appreciation has tumbled from the 30 percent range last year to 5 percent this year.Columnist Bonnie Erge expressed my view succinctly in Waiting for the Bubble to Burst:
"Rising interest rates are making it just a little less affordable for certain home buyers, and when you pull out that fraction of buyers in a fragile market, that might be enough to turn the thing around," Leamer said
It's bubble-bursting time, if you ask me.
Tuesday, August 16, 2005
Job Growth: Bush's 2nd Term
by Calculated Risk on 8/16/2005 10:25:00 PM
The online world receives another treat today as Dr. Altig of Macroblog discusses the labor market with MaxSpeak's Max Sawicky and Tom Walker. Check out the WSJ Econoblog: Debating Job-Market 'Slack'.
I'd like to make my own small mundane contribution. In January I cut Mr. Bush some slack with regards to job creation during his first term. Bush's first term, with a net loss of 759K private sector jobs (a gain of 119K total jobs), has to be considered disappointing. However there were some reasons for the poor net job creation, the most compelling being that the economy was clearly overheated when Bush took office.
Looking forward there are no clear reasons why the US economy shouldn't see more normal job growth during Bush's 2nd term. With the economy adding 1.7 million working age people per year (according to the Census Bureau), the US economy should expect a minimum of 6.8 million net jobs created during Bush's 2nd term.
On the upside, the participation rate could increase and the economy could add close to 10 million net jobs. This is a realistic upside; the economy added 10.8 million jobs in Reagan's 2nd term and over 10 million jobs during each of Clinton's terms in office. The economy is larger today, so as a percentage gain, 10 million jobs would be less than for the Reagan or Clinton presidencies.
So for Bush's 2nd term, anything less than 6.8 Million net jobs will have to be considered poor. And anything above 10 million net jobs as excellent. Of course, in additional to the number of jobs, the quality of the jobs and real wage increases are also important measures.
For the quantity of jobs, the following graph provides a measurement tool for job growth during Bush's 2nd term.
Click on graph for larger image.
The blue line is for 10 million jobs created during Bush's 2nd term; the purple line for 6.8 million jobs. The insert shows net job creation for the first 6 months of the 2nd term - currently just below the blue line.
I will update the graph each month.


