 RSS Feed
 by Calculated Risk on 7/29/2005 03:11:00 PM
Friday, July 29, 2005
GDP: Three Takes
Dr. Duy considers how the FED will review the GDP data: Fed Watch: A Week of Data That Point to More Tightening ...
And Dr. Hamilton presents: New GDP data and recession probabilities
And pgl is reasonably positive on GDP: Strong Fixed Investment Demand Growth.
Three interesting views.
For those with positive views on the economy, there is nothing in this report that will change their opinion. For those that are negative on the economy (because of the housing bubble, current account and fiscal deficits, etc.), there is nothing in this report that will sway them either.
Dr. Aigner: Trouble in housing market no game
by Calculated Risk on 7/29/2005 11:06:00 AM
Economics Professor and former Dean of the UCI Graduate School of Management Dennis Aigner writes in the OC Register: Trouble in housing market no game, Region's house of cards ready to topple as prices reach unsustainable levels.
Are you familiar with the game Jenga, where players successively remove small wooden blocks from the bottom of a tower and place them on top, creating a progressively more unstable situation until one player causes the whole structure to tumble? (Our family record is 31 courses, by the way, if you want to compare notes.) The remaining players yell, Jenga!, we all clean up the mess, restack the blocks and begin again.See Dr. Aigner's commentary for some comparisons to foreign markets.
That's basically what's about to happen very soon in parts of California and several other "hot" housing markets around the country. Merrill Lynch recently issued a "bubble" warning for six California housing markets - San Diego, the Inland Empire, Los Angeles, San Francisco, San Jose and Sacramento, where "affordability" indexes are at historic lows. In other words, household incomes are way out-of-sync with home prices.
... it won't take a big uptick in mortgage interest rates to trigger a slow-down or retrenchment in prices, and the argument that such high prices are justified by insufficient supply coupled with strong demand just doesn't hold water now that we have gone beyond all rationality with respect to affordability across the board.
We're in the midst of a classic speculative bubble, and even the venerable Alan Greenspan referred to a bit of "froth" in certain housing markets in a recent speech. The UCLA Anderson Forecast, which has been warning of a break in the bubble for the past couple of years, echoed that warning again in its latest quarterly update and predicted a recession to follow even if it's a "soft landing."
A hard landing is more likely (where nominal prices actually fall) because houses are more overvalued than in past booms, inflation is lower and many people have been buying houses as investments.
But the most compelling evidence of a bursting bubble to come is the divergence of home prices and rents. In the United States over the past decade the ratio of home prices to rents has increased by almost 40 percent.
The increase is much higher in hot housing markets like Orange County (99 percent), where the ratio of median home price to average monthly rent now stands at 433:1.
To re-calibrate to more reasonable historical levels will require rents to rise sharply, which is constrained by household income growth, or home prices will have to fall, the only other possibility.
...
Over the past four years, 90 percent of the growth in U.S. GDP was accounted for by consumer spending and residential construction. Declines in the nation's biggest housing markets are likely to trigger a major economic slowdown.
It is not a question of whether this will happen but when, how dire will be the consequences on economic growth, and how long it will take to restack the blocks and begin again.
WSJ: What Housing Bubble?
by Calculated Risk on 7/29/2005 02:32:00 AM
Neil Barsky writes in the WSJ "What Housing Bubble?"
If you want to be scared out of your wits these days, you basically have two choices: go watch Steven Spielberg's latest, or listen to the hysterical warnings of economists and journalists about the imminent popping of our so-called housing bubble.I think I missed out on those "parental contributions"! Barsky lists 3 myths:
...
The reality is this: There is no housing bubble in this country. Our strong housing market is a function of myriad factors with real economic underpinnings: low interest rates, local job growth, the emotional attachment one has for one's home, one's view of one's future earning- power, and parental contributions, all have done their part to contribute to rising home prices.
• Myth #1. There is too much capacity: According to Census data, over the past 10 years, housing permits have averaged about 1.63 million units per year -- including multifamily units. Household formation has averaged 1.49 million families per year. So far, so good. But ... Roughly 6% of the new home sales were for second homes ... approximately 360,000 units every year were torn down either because they were nonfunctional, or because they were "tear-downs." When the latter two numbers are taken into account, the real number of new homes is closer to 1.2 million, or 19% fewer than the average number of new households formed each year.
• Myth #2. Risky mortgage products are fueling house appreciation: Sages from Warren Buffett to Alan Greenspan have warned of the increased risk from the use of new mortgage products, particularly adjustable-rate mortgages and interest-only mortgages. The theory here is that buyers are extending themselves to make payments, and when their mortgages reset they will be in trouble. ... As virtually every mortgagee in the country knows, most ARMs are fixed rate for the first two to seven years. Virtually all have 2% interest-rate caps. The average American owns his home for seven years. Why pay several hundred basis points to lock in rates he is highly unlikely to take advantage of?
• Myth #3. Speculators are Driving Home Prices: The media today is chock-full of stories of day-trading dot-com refugees who have found their calling buying homes and condos "on spec," with the hope of flipping the property for a higher price. Earlier this month, one Wall Street analyst published an article with the catchy headline: "Investors Gone Wild: An Analysis of Real Estate Speculation." Scary ... again, some common-sense thinking is in order. In Manhattan, where I live, friends buy apartments kicking and screaming, convinced they top-ticked the housing market. Is Manhattan special? Are speculators flipping Palm Beach mansions? I don't think so. Yet these markets are experiencing the same price appreciation as Las Vegas, Phoenix and Florida, where real estate investors are supposedly driving prices higher.
Thursday, July 28, 2005
Housing Mortgage Trends
by Calculated Risk on 7/28/2005 06:09:00 PM
UPDATE: Also see Asha Bangalore's (pdf) Signs of Distress in the Effervescent Housing Market?
Fitch Ratings released a newsletter "RMBS Mortgage Principles and Interest" this week. (RMBS: Residential Mortgage Backed Securities)
There were several interesting trends.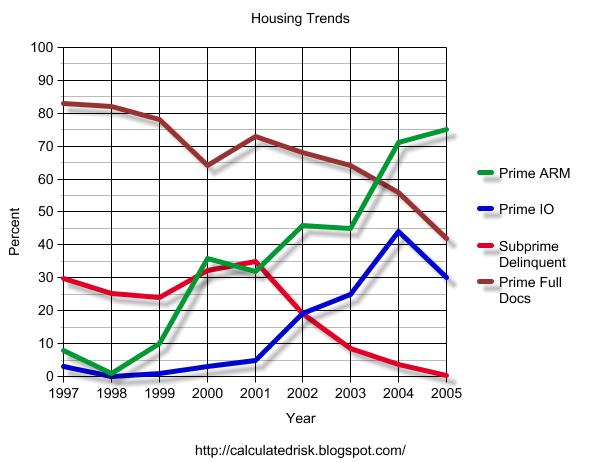 Click on graph for larger image.
The percentage of prime loans using ARMs and IOs has been increasing (IOs have dipped slightly so far in '05). The same pattern can be seen for subprime loans (not graphed).
At the same time, the percentage of loans requiring full documentation has dropped significantly.
UPDATE: tanta points out that these are old pools with "junk that can't prepay". Ignore this section on subprime delinquencies ... nothing of value here! Also of interest is the percent of subprime loans (the fastest growing segment) that are in delinquency. Although delinquency rates were around 30% (over 60 days late) for a number of years, recently the rate has fallen to almost zero. Also, I believe the extensive use of ARMs and IOs indicates excessive leverage, even in the prime market.
Lower delinquencies would usually be good, but I am concerned if the housing market slows that delinquency rates will return to the 30% range on subprimes.
Wednesday, July 27, 2005
Dr. Baker: Housing Bubble Fact Sheet
by Calculated Risk on 7/27/2005 10:51:00 PM
Dr. Dean Baker of Center for Economic Policy Research (CEPR) has put out "The Housing Bubble Fact Sheet". (thanks to Ficus for the tip).
1. The unprecedented rise in house prices has dangerous implications for the economy.Read Dr. Baker's fact sheet for the details. I agree with most of his points, but Baker is more pessimistic than me.
2. The housing bubble has created more than $5 trillion in bubble wealth, the equivalent of $70,000 per average family of four.
3. The increase in house prices is not being driven by fundamental factors in the housing market, such as income and population growth.
4. The housing bubble regions are large enough to have a major impact on the national economy.
5. The collapse of the housing bubble will throw the economy into a recession, and quite likely a severe recession.
6. The collapse of the housing bubble is likely to put major strains on the financial system and require a federal bailout of the mortgage market.
7. The sooner house prices drop, the less economic damage there will be.
8. The housing bubble could pop from higher interest rates, but it could also deflate even if interest rates stay low.
Bernanke's Bunkum
by Calculated Risk on 7/27/2005 06:02:00 PM
Dr. Thoma excerpts from Bernanke's commentary in the WSJ. Clearly Bernanke has been drinking the Bush Administration Kool-Aid.
How can anyone claim the Bush Administration has been pursuing "good economic policies" with respect to the budget deficit? That is outlandish.
And on jobs, I've cut the Bush Administration slack. But there is a difference between "cutting them slack" and giving them credit - The Bush Administration deserves no credit on jobs! Since Bush has taken office there have been a total of 161 thousand non-farm private sector jobs created. That is the worst net job creation performance in over 70 years.
The entire commentary is bunkum. But instead of correcting each of Bernanke's false assertions, I've found the template for his talking points:
No Congress of the United States ever assembled, on surveying the state of the Union, has met with a more pleasing prospect than that which appears at the present time. In the domestic field there is tranquillity and contentment, harmonious relations between management and wage earner, freedom from industrial strife, and the highest record of years of prosperity.Calvin Coolidge, State of the Union Address, December 4, 1928
Bernanke is now channeling Coolidge's monument to economic shortsightedness.
Housing: More stories on Inventories
by Calculated Risk on 7/27/2005 01:12:00 PM
Here are three more stories that back up my prediction for July.
New Hampshire: Real Estate Listings In Area Skyrocketing
Along a 2-mile stretch of Route 302 - from Bethlehem Junction to the Memory Lane Apartments - the landscape is dotted with "for sale" signs.Florida: More Strand homes for sale
...
As a result, the number of real estate listings in the greater Littleton area - including Bethlehem - have doubled since this time last year.
...
"Right near me every place is for sale,"
Home listings in the second quarter jumped 9 percent, from 2,916 to 3,165. Condo listings increased 36 percent from 2,636 to 3,584, according to the Multiple Listing Service for Horry and Georgetown counties.California: Higher inventory takes some zing out of sellers' edge that dominated '04
Meanwhile, the latest level of unsold inventory [in Palm Springs], at about 3,296 homes - more than 80 percent higher than a year ago and more than twice the level of April 2004 - suggests that the market is reaching an equilibrium between the needs of buyers and sellers.
"This is not a buyer's market yet," said Greg Berkemer, executive vice president of the California Desert Association of Realtors. "It's just less of a seller's market than it was a year ago."
June: Record New Home Sales
by Calculated Risk on 7/27/2005 11:00:00 AM
According to a Census Bureau report, New Home Sales in June were at a seasonally adjusted annual rate of 1.374 million vs. market expectations of 1.3 million. May sales were revised up to 1.321 million from 1.271 million.
Click on Graph for larger image.
NOTE: The graph starts at 700 thousand units per month to better show monthly variation.
Sales of new one-family houses in June 2005 were at a seasonally adjusted annual rate of 1,374,000, according to estimates released jointly today by the U.S. Census Bureau and the Department of Housing and Urban Development.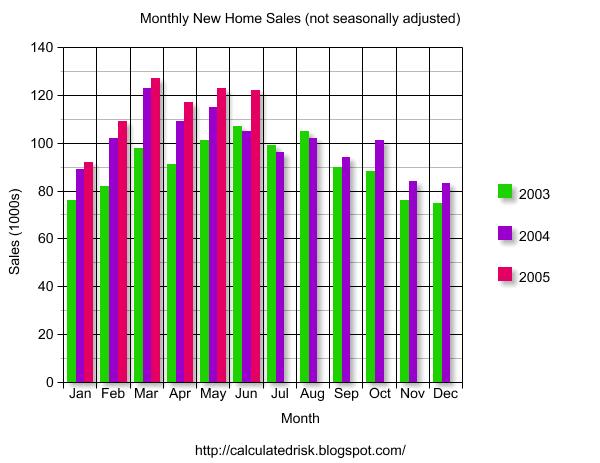
The Not Seasonally Adjusted monthly rate was 122,000 New Homes sold, down from a revised 123,000 in May.
The median sales price of new houses sold in June 2005 was $214,800; the average sales price was $267,400.
The average sales price is down and the median price is the lowest since September of 2004.
The seasonally adjusted estimate of new houses for sale at the end of June was 454,000. This represents a supply of 4.0 months at the current sales rate.
The seasonally adjusted supply of New Homes was 4.0 months, about normal for the last few years.
Tuesday, July 26, 2005
Housing Inventories
by Calculated Risk on 7/26/2005 02:22:00 AM
Existing home inventories rose to 2.653 million in June. Because sales were so strong (7.33 million annual rate), this represented a supply of 4.3 months.
I expect a further increase in inventories based on recent articles like this one: D.C. Area Housing Market Cools Off.
Home sales tend to slow in the summer, but the number of houses for sale in the Washington area has climbed by 50 percent in recent months. The available inventory has risen to about 35,300 homes, up from an average of about 23,000 in the past three years....Therefore I expect a further increase in July inventories to 2.9+ million (from 2.653 million in June). I also expect to see a small drop in July sales to maybe around 6.8 million (still very strong) annual rate.
If both of these predictions hold, this computes to a 5.1 month supply - the highest level in a number of years.
Monday, July 25, 2005
DiMartino: Bubble's Fallout?
by Calculated Risk on 7/25/2005 10:52:00 PM
DiMartino disagrees with Greenspan on the housing bubble:
There's a good chance the housing bubble carries severe macroeconomic implications, a point Alan Greenspan disputed in his congressional testimony last week.I tried to quantify the impact of the housing bust on the economy on Angry Bear. DiMartino does a better job:
If prices fall, he said, "they likely would be accompanied by some economic stress, though the macroeconomic implications need not be substantial."
Let's start with some factoids from Merrill Lynch:
•Real estate accounts for 70 percent of the rise in household net worth since 2001.
•Forty percent of private-sector jobs created since then are housing-related.
•Consumer spending and residential construction have accounted for 90 percent of U.S. economic growth.
The inevitable pullback in construction speaks directly to housing's risks. A similar 40 percent decline in construction to that of the 1981-82 recession implies a decline of 2 percentage points in GDP.
And then there's the wealth effect. The housing bubble has added $5 trillion to household net worth, equating to about $70,000 for a family of four.
"The large wealth effect associated with the housing bubble, which has spurred a consumption boom in the last few years, will go into reverse as housing prices plummet," Mr. Baker predicted.
This dent in consumption would whack an additional 1.6 to 2.5 percentage points off GDP growth. Totaled out, that GDP retreat about equals current GDP growth.
Maybe I'm being obtuse, but a recession is about as macro as you can get, economically speaking.
Maybe the best thing to do is respectfully agree to disagree with Mr. Greenspan and let time render its own decision.


