 RSS Feed
 by Calculated Risk on 5/29/2005 02:20:00 AM
Sunday, May 29, 2005
More Housing Articles
This weekend has seen a plethora of articles on housing. I posted some links earlier, and you can always check Patrick's site for housing related links.
UPDATE2: A Bane Amid The Housing Boom: Rising Foreclosures
"Philadelphia, its suburbs and indeed much of Pennsylvania have experienced a foreclosure epidemic as low-income homeowners take on mortgage debt they cannot afford. In 2000, the Philadelphia sheriff auctioned 300 to 400 foreclosed properties a month; now he handles more than 1,000 a month. Allegheny County, which includes Pittsburgh, had record auctions of foreclosed homes, and officials speak of a "Depression-era" problem."
UPDATE: See General Glut's comments on another NY Times housing article.
Here are four more:
University of Michigan: Back to the future
Home sales have again reached new peaks as consumers have seamlessly shifted from the irresistible enticement of record low mortgage rates to the equally irresistible temptation of purchasing in advance of rising mortgage rates and home prices. More consumers favored buying homes in advance of anticipated increases in mortgage rates and prices in the May survey than at any other time in the last decade. "Attitudes toward home buying conditions have recently displayed nearly all of the characteristics of earlier bouts of advance buying, a reaction that has typically generated an economic bust following an extended boom," Curtin said. The last time the survey recorded a comparable number of references to advance buying was in 1988-89, more than two years before home prices began to decline in some areas of the country.
LA Times: It's Not a Bubble Until It Bursts
The chief economist for the Mortgage Bankers Assn. is worried enough about the torrid housing market to get out of it.And more:
"I'm going to rent for a while," said Douglas Duncan, who expects "significant reversals" in regions that have enjoyed strong home price appreciation, including Washington, D.C., Florida and California. He plans to sell his suburban Washington home, which has tripled in value since he bought it a dozen years ago, and move into an apartment.
A widely followed University of Michigan consumer survey, released Friday, showed that 24% of respondents nationwide said it was a good time to buy a home because prices would rise. That was the highest percentage since 1988 — right before prices peaked in the previous real estate cycle.
"These are powerful engines creating a boom in home sales, and all booms end the same way," Richard Curtin, director of the survey, said in a statement.
WaPo: The Interest-Only Trap
There's another group of home buyers opting for interest-only loans -- people looking for the lowest mortgage payment possible who probably wouldn't qualify for the house they want with a loan payment that included the interest and principal.
It's that last group of people that worries me the most -- home buyers who are just barely squeezing into a house with an interest-only loan.
"I am not sure that any loan which enables someone to dig their financial grave is good, and I wish that underwriters would realize that," Armstrong said.
Boston Herald: Bank on a bust, not longer boom
The problem: The dynamic of "advance buying" - that rush to buy homes before spiking prices and interest rates make it too late.
It's a tell-tale sign of a coming collapse, Curtin (director of the University of Michigan's Survey of Consumers) says.
"Attitudes toward home-buying conditions have recently displayed nearly all the characteristics of earlier bouts of advance buying,'' Curtin said in a press release Friday, calling it a reaction that has ``typically generated an economic bust."
Saturday, May 28, 2005
NYTimes: Hear a Pop? Watch Out
by Calculated Risk on 5/28/2005 11:35:00 PM
Earlier, on Angry Bear, I tried to quantify the impacts of a housing slowdown on the general economy (See: After the Housing Boom: Impact on the Economy). This NYTimes article asks the same question:
"[W]ould a real estate crash really matter to the country as a whole?Then the article does an excellent job of discussing some of the impacts of declining prices: declining wealth effect, end of equity withdrawal, and much more ...
In a word, yes. To understand why, first look at how pervasive the effects of real estate are throughout the economy."
"But that's not all. The housing sector has even broader effects on the economy, by some estimates accounting for 25 percent of all activity. A decline in property values would most likely lead to declines in other industries, like construction, brokerage, banking and insurance. And these are important for future growth. Construction, for example, amounts to 4 percent to 5 percent of the economy, according to the Bureau of Economic Analysis.For these reasons I'm concerned about the impact of the coming housing bust on the general economy.
Then there's banking. Because of the leverage associated with real estate, a fall in values would affect banks and other lenders. It would probably lead to tightened credit standards, less lending and higher interest rates. If lenders begin to suffer steep losses, there is always the danger of financial contagion, in which problems at one institution ripple out to others it does business with.
And there's a new wild card for the economy. In 2004, adjustable-rate mortgages made up a third of new mortgage originations. No one knows what the effect of the widespread use of A.R.M.'s would be in a down market. A climb in interest rates, of course, would put downward pressure on real estate prices, but A.R.M. borrowers would feel the pinch rapidly. If those borrowers started to default, lenders would be hurt."
Friday, May 27, 2005
Fed's Ferguson: Housing Prices High
by Calculated Risk on 5/27/2005 07:03:00 PM
"In a scenario of collapse, the damage to balance sheets and private wealth could go as far as undermining the soundness of the financial system and threatening stability of the real economy." Federal Reserve Vice-Chairman Roger Ferguson, May 27, 2005
Federal Reserve Vice-Chairman Roger Ferguson made several comments on housing in prepared remarks to a conference sponsored by the Bundesbank in Berlin. A few excerpts:
"A particular phenomenon that touches on all these issues is the movement of asset prices, especially the prices of equities and residential real estate. Because these assets are the most widely held by the general public, price changes, even when not exceptional, can significantly affect the macroeconomy. Rising asset prices support household consumption, whereas falling asset prices damp consumption. In a scenario of collapse, the damage to balance sheets and private wealth could go as far as undermining the soundness of the financial system and threatening stability of the real economy." ...
"For housing, rent-to-price ratios and income-to-price ratios are commonly used measures to assess valuation. Over the past several years, both measures have decreased sharply in many countries, and they currently are well outside historical ranges in some countries. In 2004, U.S. home prices increased 11.2 percent, their fastest pace since 1979, and right now, housing prices in many markets in the United States are relatively high when judged by conventional valuation measures"See Speech for more.
And UPDATE: a few articles on the housing market:
Economists Wary of Interest-Only Loans
Is Your House Overvalued?
Is There a Bubble In Florida Waiting to Burst?
Is U.S. housing market a 'bubble' waiting to burst?
Thursday, May 26, 2005
WSJ: House of Cards?
by Calculated Risk on 5/26/2005 11:00:00 PM
UPDATE: Recommended reading: Running Out of Bubbles by Paul Krugman, NYTimes.
Original post:
The first paragraph is priceless:
Watching the housing market is sort of like a game of Clue before the murder. The victim is still alive and well, but we know he's going down. After the housing market is cold, it should be easy to finger the perpetrator. But for now, we're left to guess (Colonel Greenspan in the conservatory with the lead pipe?), and the perp might not be whom we expect.The last line is a reminder of the difficulty in calling a top:
The Wall Street Journal, March 6, 2000:
"... for now, the frothy buying conditions in some of the nation's biggest housing markets, especially for high-end-homes, worry economists, who remember how the housing market crashed in the late 1980s after some markets overheated."I wasn't concerned about housing in 2000; there was little or no speculation. I am concerned today.
Barclays: UK Bad Debt Soaring
by Calculated Risk on 5/26/2005 10:33:00 PM
The Telegraph reports that Barclays warned "of soaring bad debt on cards":
Barclays yesterday became the first major bank since the recession of the early 1990s to issue a warning that bad debts are growing sharply.Earlier I commented that the UK might be a leading indicator for the US. See also comments by Kash and General Glut.
As the biggest provider of credit cards in the country, with nine million Barclaycard customers, it told the City that provisions for bad debts "rose significantly" in the first quarter of the year.
The good news is that financial stress indicators are still low.
The number of people in serious financial difficulties is still low compared with the last recession. Personal insolvencies have jumped by a third in a year but that can be explained in part by a relaxation in the rules, allowing bankrupts to be discharged after one year instead of five.But it appears the writing is on the wall.
Analysts say that a better indicator of financial duress is the repossession of houses by mortgage lenders. Only 6,320 houses were repossessed last year, compared with 78,000 in 1991.
However, the number of people in arrears with their mortgages is rising for the first time since 1998. The latest figures show that nearly 54,000 households are three to six months in arrears, a rise of 5,000 on a year ago.
Wednesday, May 25, 2005
FED: "Some buyers, some builders, some lenders are going to get burned"
by Calculated Risk on 5/25/2005 09:53:00 PM
Atlanta Federal Reserve Bank President Jack Guynn hinted at more rate hikes in his speech today. In the Q&A he commented on housing:
"There are some local markets, especially in coastal Florida, where I've heard stories for more than a year about behavior that's got to be characterized as nothing other than speculation," Guynn said it response to questions after his speech.On rates, Guynn said:
"It makes me very uncomfortable," he added. "Some buyers, some builders, some lenders are going to get burned, could very likely get burned, in some of those local markets."
"Given the current outlook for the economy, my personal view is that we've not yet reached a neutral policy stance."UPDATE: Dr. Polley earlier posted the same excerpts with a link to Guynn's speech.
Social Security: Senate Democratic Policy Committee Hearing
by Calculated Risk on 5/25/2005 02:28:00 PM
On May 13, 2005 the Senate Democratic Policy Committee held a hearing on Social Security. "An Oversight Hearing on President Bush's Social Security Privatization Plan: Will You and Your Family Be Worse Off?"
There were statements from Senators and five witnesses:
Robert Shiller
Professor of Economics at Yale University
J. Bradford DeLong
Professor of Economics at the University of California-Berkeley
Derrick Max
Executive Director of the Alliance for Worker Retirement Security and the Coalition for the Modernization and Protection of America's Social Security
Peter Orszag
Senior Fellow in Economic Studies and Director of the Retirement Security Project at the Brookings Institution
Beth Kobliner
Personal Finance Columnist and Author of Get a Financial Life: Personal Finance in Your Twenties and Thirties
Many of us have read Dr. DeLong's testimony on his blog. Here is an excerpt from Dr. Shiller's testimony:
I conducted a study in March 2005 that simulates the long-term performance of personal accounts, and the paper, data and simulation program are available on my book website irrationalexuberance.com. The paper uses historical returns from 1871-2004 to assess the likely outcomes of the President’s proposal for various worker choices among the options. It does 91 different simulations for a worker born in 1990 assuming that he or she experiences the actual returns from 1871-1914, 1872-1915, 1873-1916, all the way through 1961-2004.
This sample has a U.S. historical average real stock market return of 6.8% annually, slightly above the 6.5% annual return assumed by the Social Security actuaries. My study also included “adjusted” stock market returns designed to match the median stock return in 15 countries from 1900-2000, 2.2 percentage points lower than the U.S. returns over the same time period. I believe that the international return figure is more realistic.
I found that using U.S. historical returns, a benchmark life-cycle portfolio loses money 32% of the time (i.e., 32% of the time the internal rate of return is less than the 3% real return required to break even in the proposal). The median rate of return is 3.4% annually. Using more realistic adjusted returns, the benchmark life-cycle portfolio loses money 71% of the time and has a median rate of return of 2.6%.
The conclusion is that the president’s personal accounts, even the life-cycle portfolio, would subject Americans to serious risks. The Ownership Society is a long-term and elusive goal, and we should not expose people to unnecessary risks in an overambitious attempt to attain that goal.
For those following the housing market, yes, the same Dr. Shiller.
Tuesday, May 24, 2005
April New Home Sales: 1.316 Million
by Calculated Risk on 5/24/2005 06:38:00 PM
According to a Census Bureau report, New Home Sales set a record in April to a seasonally adjusted annual rate of 1.316 million vs. market expectations of 1.35 million. March sales were revised down significantly to 1.313 Million.
Click on Graph for larger image.
NOTE: The graph starts at 700 thousand units per month to better show monthly variation.
Sales of new one-family houses in April 2005 were at a seasonally adjusted annual rate of 1,316,000, according to estimates released jointly today by the U.S. Census Bureau and the Department of Housing and Urban Development. This is 0.2 percent above the revised March rate of 1,313,000 and is 13.3 percent above the revised April 2004 estimate of 1,162,000.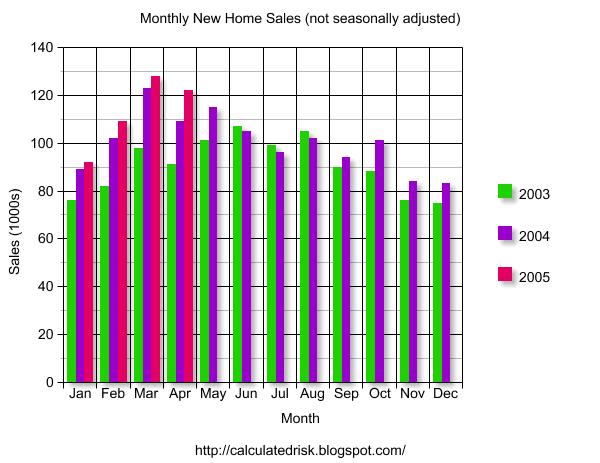
The Not Seasonally Adjusted monthly rate was 122,000 New Homes sold, down from a revised 128,000 in March.
The median sales price of new houses sold in April 2005 was $230,800; the average sales price was $283,500.
Both the median and average are in line with previous months.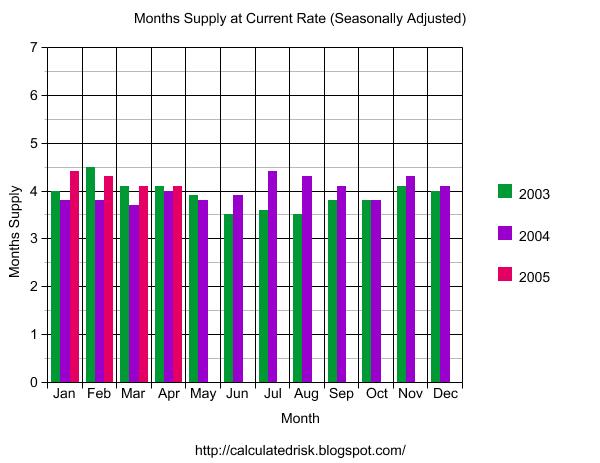
The seasonally adjusted estimate of new houses for sale at the end of April was 440,000. This represents a supply of 4.1 months at the current sales rate.
The seasonally adjusted supply of New Homes was 4.1 months, about normal for the last few years. The supply for March was also 4.1 months, revised from just 3.0 months.
The surprise was the significant downward revision in the March numbers.
Realtors' Economist: A Bubble
by Calculated Risk on 5/24/2005 03:28:00 PM
The head cheerleader for the housing market acknowledged the housing bubble today.
"Fifteen percent price appreciation is too much, even for me," David Lereah, chief economist at the National Association of Realtors, told CNBC's "Morning Call." "The real estate market is taking on a life of its own right now and we need to get a handle on it."Also, Equity loans alarm experts:
"If we return to prudent lending standards, that'll be the death of this housing market," says Keith Gumbinger of loan analysts HSH of Pompton Plains, N.J.I have nothing to add to those two statements!
Forecasting the Trade Deficit: Part II
by Calculated Risk on 5/24/2005 12:27:00 AM
The April trade balance will be reported on June 10th. I'm trying to develop a simple model to help predict the trade deficit. Last Thursday, I posted an oil import model (I need to add exports and Seasonal Adjustments). This post will address China. I'll post my methodology and hopefully others will offer suggestions and improvements.
My general approach is to divide the deficit into two components: petroleum energy related products and everything else. This is a mixed model, by "goods" for petroleum, by country or region for everything else.
CHINA
My approach to China is to assume trade follows the normal seasonal pattern and recent growth trends. The seasonal number will be adjusted according to container traffic at the Port of Long Beach. If anything unusual has happened (change in exchange rate, labor strike, new tariffs, etc.) I will try to factor that into the estimate. For April, the only "unusual" event was the soft patch in the US economy. This probably did not impact imports, so I will assume nothing unusual for April.
US IMPORTS
First, here are the monthly imports from China for the last 6 years.
Click on graph for larger image.
Imports from China have increased every year, except in 2001 when imports were relatively flat (during the US recession). A couple of features stand out: There is a consistent seasonal pattern to imports; low early in the year, building towards the Holiday season and then dropping off at the end of the year. 
The low for the year is usually in February, but it occasionally occurs in March like this year.
The second graph shows the last three years plotted against the best fit trend line. This clearly shows the seasonal pattern to imports.
Comment on Seasonal Adjustment: The seasonal adjustment is intended to remove the seasonal fluctuations from the data. This type of data is usually adjusted with a multiplicative approach: A = C x S x I where:
A = Observed Series (Not Seasonally Adjusted or NSA)
C = Trend Cycle
S = Seasonal Component
I = Irregular Component (weather, strikes, etc.)
Looking at the above graph, if the actual line is typical below the trend line for a given month, the observed numbers are adjusted upwards and if the line is usually above the trend, the oberved number is adjusted down. For April, the typical pattern shows about 4% below the trend line, so the observed number (NSA) will be adjusted upwards (SA). Errors occur if the trend changes. Also, the steeper the trend line, the more error prone the adjustment.
After reviewing the data, it appears that imports from China track inbound container shipments at the port of Long Beach. Of course this is comparing dollars to volume, so the mix of products has to remain relatively stable. The Port of Los Angeles also tracks imports relatively well, but there was a labor shortage last year and LB fit the data better.
This brings me to the first prediction for April: The trend for NSA imports for China is $17.8 Billion. Inbound container traffic was up 29% at both LB and LA ports (more than the usual March increase), so I'm going to adjust NSA upwards to $18.5 Billion.
US EXPORTS
The next step is to estimate the US exports to China. I'm going to use the same approach as for imports.
Exports to China do not show any seasonal pattern. There has been a steady increase with a slight jump in exports in 2003.
Since there is no seasonal pattern, the initial estimate is based on the trend line and the Port of Long Beach data. LB reported a 3% increase in loaded outbound containers, so the estimate will be the 3% higher than March or $3.4 Billion for April.
The final graph shows the relationship between containers and exports from LB. The bad news is the correlation is not as strong as for imports from China.
The good news is exports to China are relatively small compared to imports from China, so any error will have a minimal impact on the overall estimate.
The final step is to convert the NSA numbers to SA. Since there is little or no seasonal trend to US exports, $3.4 Billion is also the SA export number. For imports, the $18.5 Billion number is adjusted up by to $19.3 Billion.
The following table presents the actual for February and March (with estimate of the SA numbers) and the estimates for April.
CHINA TRADE BALANCE: Table numbers in Billions $
NOT SEASONALLY ADJUSTED
| MONTH | NSA Balance | NSA Exports | NSA Imports |
| February | -$13.9 | $3.08 | $16.95 |
| March | -$12.9 | $3.3 | $16.21 |
| April | -$15.1(est) | $3.4(est) | $18.5(est) |
SEASONALLY ADJUSTED (all estimates)
| MONTH | SA Balance | SA Exports | SA Imports |
| February | -$18.1 | $3.08 | $21.19 |
| March | -$15.1 | $3.3 | $18.42 |
| April | -$15.9(est) | $3.4(est) | $19.3(est) |
Note that February (usually a weak month for imports) was relatively strong and the SA number was probably over $21 Billion for imports from China, contributing to the record reported SA trade deficit.


