 RSS Feed
 by Calculated Risk on 5/12/2005 09:51:00 AM
Thursday, May 12, 2005
Retail Sales Strong, WalMart Warns
The Census Bureaus released the retail sales report for April.
The U.S. Census Bureau announced today that advance estimates of U.S. retail and food services sales for April, adjusted for seasonal variation and holiday and trading-day differences, but not for price changes, were $344.9 billion, an increase of 1.4 percent (±0.7%) from the previous month and up 8.6 percent (±0.8%) from April 2004. Total sales for the February through April 2005 period were up 7.5 percent (±0.5%) from the same period a year ago. The February to March 2005 percent change was revised from +0.3 percent (±0.7%)* to +0.4 percent (±0.3%).Meanwhile, WalMart warned:
Retail trade sales were up 1.4 percent (±0.7%) from March and were 8.7 percent (±1.0%) above last year. Gasoline station sales were up 19.8 percent (±3.1%) from April 2004 and sales of nonstore retailers were up 12.4 percent (±3.5%) from last year.
Wal-Mart Stores Inc. reported a 14 percent increase in first-quarter earnings Thursday, but the results missed Wall Street estimates. The world's largest retailer also warned that second-quarter results would likely be lower than expected as unseasonably cool weather and higher gasoline prices continue to hurt business.What is wrong with this picture?
France’s manufacturing output tumbles, Japan sluggish
by Calculated Risk on 5/12/2005 02:24:00 AM
The Financial Times is reporting that "France's manufacturing industry may be in recession after unexpectedly weak industrial production figures on Wednesday"
Manufacturing output tumbled by 0.3 per cent in the first three months of 2005, and by 0.9 per cent in March compared with February, according to Insee, the French statistics office. France has been one of the eurozone's best performing economies but the latest data point to a marked deterioration.Meanwhile, the International Herald Tribune is reporting "Japan's index of leading economic indicators was below 50 percent in March for a second month, suggesting that the country's economic growth may stall, the Cabinet Office said Wednesday."
Confidence indicators suggest French manufacturing has also remained weak in the current quarter. A second successive quarterly fall would mark a technical recession in manufacturing although the strength of the rest of the economy means France is still some way from overall recession.
"The slump of the Japanese economy will continue, though the risk that it will fall back into recession is fading," said Hiroaki Muto, a senior economist at Sumitomo Mitsui Asset Management in Tokyo. "We can't expect corporate profits to expand this year as they did last year."The global imbalance story continues ...
Industrial production fell 0.3 percent in March from February, the government said on April 28. Spending by households headed by a salaried worker slid 1.1 percent in the same month, the second month of decline, the government said on the same day.
The Japanese economy probably expanded at an annual 2.5 percent pace in the first quarter, according to a Bloomberg News survey.
Wednesday, May 11, 2005
Housing: "More and more Alarms Bells"
by Calculated Risk on 5/11/2005 09:57:00 PM
Danielle DiMartino continues her series on housing with "More than real estate in danger".
How widespread will the fallout be when housing's no longer driving the train?I tried to quantify these same impacts in "After the Housing Boom: Impact on the Economy" on Angry Bear.
Mark Zandi, chief economist at Economy.com, was one of the first to identify the broad economic implications of a potentially overheated housing market.
Mr. Zandi breaks the sector's impact into three areas:
•Direct effects – home building, home improvement and professions directly tied to home sales.
•Indirect effects – the cash the American home is generating via cash-out refinancings, home-equity borrowing and capital gained from home sales.
•Spillover effect – the impact housing is having on non-household balance sheets.
"More and more alarm bells are going off every day," Mr. Zandi said, "and speculation is infecting a growing number of communities across the country."I hope Zandi is wrong, but I'm afraid he is right.
US Trade Deficit: $55 Billion for March
by Calculated Risk on 5/11/2005 08:30:00 AM
The U.S. Census Bureau and the U.S. Bureau of Economic Analysis released the monthly trade balance report today for March:
"... total March exports of $102.2 billion and imports of $157.2 billion resulted in a goods and services deficit of $55.0 billion, $5.6 billion less than the $60.6 billion in February, revised.Note: all numbers are seasonally adjusted.
March exports were $1.5 billion more than February exports of $100.7 billion.
March imports were $4.1 billion less than February imports of $161.2 billion."
UPDATE: See also:
Kash, Angry Bear: US Imports: What and from Where?
Brad Setser: Good News. Trade deficit falls to $55 billion
Macroblog: The U.S. Current Account Deficit: How Big Is Sustainable?
UPDATE2: More from Kash: The US's Comparative Advantage
And pgl responds to the paper by Kouparitsas(recommended by macroblog): Pleasant Current Account Arithmetic (or was it fuzzy math)

Click on graph for larger image.
This graph shows the monthly trade balances for 2003, 2004 and 2005 and depicts the worsening year over year trade imbalance. The March trade deficit improved from February as exports increased $1.5 Billion and imports decreased $4.1 Billion.
The recent increase in oil prices had an impact on the March trade deficit. The average contract price for oil jumped from $36.85 in February to $41.14 in March. This is below the DOE estimate for the contract price and below the record for the import contract price of $41.79 in October.

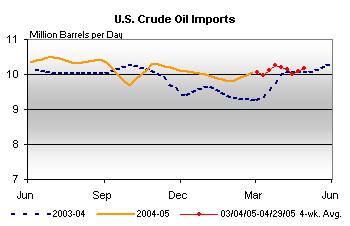
This graph shows total petroleum imports per month for 2003, 2004 and the first three months of 2005. Petroleum imports were about 30% of the trade deficit or about 1.5% of GDP. Even without petroleum imports, the trade deficit would be close to 4% of GDP - a serious problem.
This is an unexpected improvement in the trade deficit and reminds us that this number is difficult to predict.
"A Real Estate Concentric Economy"
by Calculated Risk on 5/11/2005 01:29:00 AM
Danielle DiMartino has been writing a series on the Real Estate bubble. In "A delicate question of policy" she writes:
If it really is dangerous to have all your eggs in one basket, we might be fried.DiMartino asks: "Just how widespread will the fallout be? More on that tomorrow."
The Bank Credit Analyst research firm published three statistics on the housing industry this week that show how heavily the economy is leaning on the housing market.
•Real estate lending represents a record 53 percent of bank loans.
•Housing accounts for a record 29 percent of household assets.
•Residential real estate has captured 35 percent of private investment – the highest in 35 years.
"Housing has assumed a worryingly large role in the U.S. economy and financial system," the report concluded, "and it will be traumatic when the bubble bursts."
Doug Kass, the astute hedge fund manager of Seabreeze Partners, echoed the report: "There's no doubt we're in a real estate concentric economy."
...
"There is tremendous interest rate risk right now because of the abusive use of interest-only and adjustable-rate mortgages in the last few years," Mr. Kass said. "If we have to reset those mortgages at higher rates, it presents a huge risk to households' balance sheets."
His conclusion: "It's an accident waiting to happen."
I'll be waiting.
Tuesday, May 10, 2005
NAHB: Housing to Stay Healthy
by Calculated Risk on 5/10/2005 04:36:00 PM
According to the National Association of Home Builders: "Housing To Stay Healthy As It Recedes From Its Peak".
"... economists appearing at a forecasting conference held by the National Association of Home Builders (NAHB) last week said housing should remain healthy through next year even as it recedes from peak levels. Driven by ongoing population growth and household formations, an expanding market for second homes and the need to replace aging units, demand for housing should hold up well in the foreseeable future, said panelists."There was some concern expressed about "speculative investment activity" in some of the hotter housing markets: California, Las Vegas, South Florida, Washington, D.C. and the New York-Boston corridor, but the panelists expect to see a slowdown in the rate of price appreciation rather than a decline in prices.
J.P. Morgan’s Glassman discounted fears of reduced house-price appreciation taking a toll on the economy. With the exception of a few boom markets, he said, higher prices largely reflect the real estate market catching up with the lagging prices of the 1990s. “Worry if you want to,” he told audience members. “But I think I would take most of the worries with a grain of salt and just get back to business.”Whew! I guess I've been wrong: "After the Housing Boom: Impact on the Economy". That is a relief.
Monday, May 09, 2005
Update on UK Housing
by Calculated Risk on 5/09/2005 09:36:00 PM
Forbes reported today that UK housing prices are up " 0.31 pct from the previous quarter". That is a slight decline in real terms. However the "volume of sales decreased by 34.77 pct". That is exactly how a housing bust usually works:
"Housing "bubbles" typically do not "pop”, rather prices tend to deflate slowly in real terms, over several years. Historically real estate prices display strong persistence and are sticky downward. Sellers want a price close to recent sales in their neighborhood, and buyers, sensing prices are declining, will wait for even lower prices. This means real estate markets do not clear immediately, and what we usually observe is a drop in transaction volumes."It is the drop in transaction volumes that causes general economic problems (slower retail sales, lower employment, etc.).
UPDATE: In the comments, David Bennett recommends General Glut's comments. Globblog is an excellent site!
See this morning's post on Angry Bear concerning UK housing: When will Housing Slowdown?
March Trade Deficit (Due Wednesday)
by Calculated Risk on 5/09/2005 02:50:00 PM
The current projection for the March trade deficit is $61.2 Billion (briefing.com) to $61.7 Billion (NYTimes). My feeling is this projection is on the low side.
In the comments to a previous post, Brad Setser excerpted some of Morgan's view ($61.2 Billion forecast) on oil:
On the imports side, a sharp rise in oil prices should more than offset some moderation in volumes and lead to another sizable increase in petroleum products.First, according to the Census Bureau, the contract price for imported crude in Feb was $36.85. According to the DOE, the contract price for Mar was close to $46. Also there was no "moderation in volumes" according to the DOE:
Click on graph for larger image.
Source: Dept of Energy
The cost for imported energy related petroleum products was $14.9 Billion in February. The cost for imported petroleum in March will be approximately $20 Billion.
The uncertainty in this report is from the impact of slowing US demand in March (the "soft patch") and the impact of the slowing economies in Europe. (See Ken's comments too) Trade with China is the largest contributor to the trade deficit, and it appears that China's economy was still going strong in March (about 25% of the total goods deficit in February was to China).
Finally, Morgan concludes with:
"Note that our forecast trade deficit is about the same as the Bureau of Economic Analysisassumed in preparing the advance estimate of Q1 GDP."If Morgan is underestimating the trade deficit, then there will also be a significant reduction in Q1 GDP.
Sunday, May 08, 2005
More on housing and the UK
by Calculated Risk on 5/08/2005 11:49:00 PM
My most recent post is up at Angry Bear: When will Housing Slowdown?
There is more bad news from the UK and I think the UK might be leading the US by 6 to 8 months with a housing slowdown.
UPDATE: U.K. Manufacturing Output Slumps
U.K. manufacturing had its biggest drop in almost three years in March, pushing industry closer to recession and damping expectations of higher interest rates after the Bank of England left its benchmark rate unchanged today.
Factory production, which accounts for 16 percent of the economy, dropped 1.6 percent from February, the National Statistics office said in London today. The median forecast in a Bloomberg survey of 26 economists was for a 0.1 percent increase.
The decline in manufacturing comes on top of signs of a slowdown in consumer spending in the U.K.'s 1.1 trillion-pound ($2.1 trillion) economy.
Best to all.
Friday, May 06, 2005
Not Seasonally Adjusted Non-Farm Payroll
by Calculated Risk on 5/06/2005 07:16:00 PM
In the previous post I cautioned about the difference between seasonally adjusted data and not seasonally adjusted data. The reason was some commentators were misusing the birth / death model that is not seasonally adjusted.
Click on graph for larger image.
This illustrates why the BLS reports seasonally adjust job growth. There is a very distinct pattern to hiring / firing. As an example, every January all of the temporary retail help is let go.
For the current month, 1.179 million new "not seaonally adjusted" jobs were created according to the payroll report. The BLS reported 274 thousand new jobs. They seasonally adjust each category, so it is very difficult to determine the actual factors.
For those that want to check these numbers, go here. Just check the boxes for both "Not seasonally adjusted" and "Seasonally Adjusted" Total nonfarm employment. Then click on Retrieve Data.
Two charts will appear. For seasonally adjusted: If you subtract the March number from April you will get the headline number of 274K. For not seasonally adjusted: If you do the same subtraction (March from April) you will get the 1.179 Million number.
CAUTION: Don't use the "Not Seasonally Adjusted" for anything except these exercises. Take a look at January - we lost 2.692 Million jobs! (but seasonally adjusted we gained 124K). We lose a ton of jobs every January and July for seasonal reasons ... this is a series that really needs seasonal adjustment.


