 RSS Feed
 by Calculated Risk on 5/31/2025 02:11:00 PM
Saturday, May 31, 2025
Real Estate Newsletter Articles this Week: Case-Shiller National House Price Index Up 3.4% year-over-year
At the Calculated Risk Real Estate Newsletter this week:
 Click on graph for larger image.
• Case-Shiller: National House Price Index Up 3.4% year-over-year in March
• Inflation Adjusted House Prices 1.0% Below 2022 Peak
• Freddie Mac House Price Index Declined in April; Up 2.6% Year-over-year
• Final Look at Local Housing Markets in April and a Look Ahead to May Sales
This is usually published 4 to 6 times a week and provides more in-depth analysis of the housing market.
Schedule for Week of June 1, 2025
by Calculated Risk on 5/31/2025 08:11:00 AM
The key report scheduled for this week is the May employment report.
Other key reports include the May ISM Manufacturing, Vehicle Sales and April trade balance.
10:00 AM: ISM Manufacturing Index for May. The consensus is for the ISM to be at 49.2, up from 48.7 in April.
10:00 AM: Construction Spending for April. The consensus is for a 0.4% increase in construction spending.
1:00 PM: Speech, Fed Chair Jerome Powell, Opening Remarks, At the Federal Reserve Board’s International Finance Division 75th Anniversary Conference, Washington, D.C.
 10:00 AM ET: Job Openings and Labor Turnover Survey for April from the BLS.
 This graph shows job openings (black line), hires (purple), Layoff, Discharges and other (red column), and Quits (light blue column) from the JOLTS.
Jobs openings decreased in March to 7.19 million from 7.48 million in February. The number of job openings (black) were down 11% year-over-year.
Quits were unchanged year-over-year.
 Late: Light vehicle sales for May.
The consensus is for light vehicle sales to be 16.4 million SAAR in May, down from 17.3 million in April (Seasonally Adjusted Annual Rate).
 Late: Light vehicle sales for May.
The consensus is for light vehicle sales to be 16.4 million SAAR in May, down from 17.3 million in April (Seasonally Adjusted Annual Rate).
This graph shows light vehicle sales since the BEA started keeping data in 1967. The dashed line is the sales rate for last month.
----- Wednesday, June 4th -----
7:00 AM ET: The Mortgage Bankers Association (MBA) will release the results for the mortgage purchase applications index.
8:15 AM: The ADP Employment Report for May. This report is for private payrolls only (no government). The consensus is for 120,000 payroll jobs added in May, up from 62,000 in April.
10:00 AM: the ISM Services Index for May. The consensus is for a reading of 52.0, up from 51.6.
----- Thursday, June 5th -----
 8:30 AM: Trade Balance report for April from the Census Bureau.
This graph shows the U.S. trade deficit, with and without petroleum.
7:00 AM ET: The Mortgage Bankers Association (MBA) will release the results for the mortgage purchase applications index.
8:15 AM: The ADP Employment Report for May. This report is for private payrolls only (no government). The consensus is for 120,000 payroll jobs added in May, up from 62,000 in April.
10:00 AM: the ISM Services Index for May. The consensus is for a reading of 52.0, up from 51.6.
 8:30 AM: Trade Balance report for April from the Census Bureau.
 This graph shows the U.S. trade deficit, with and without petroleum.
The blue line is the total deficit, and the black line is the petroleum surplus, and the red line is the trade deficit ex-petroleum products.
The consensus is the trade deficit to be $117.3 billion. The U.S. trade deficit was at $140.5 Billion in March.
8:30 AM: The initial weekly unemployment claims report will be released. The consensus is for initial claims of 230 thousand, down from 240 thousand last week.
----- Friday, June 6th -----
 8:30 AM: Employment Report for May. The consensus is for 130,000 jobs added, and for the unemployment rate to be unchanged at 4.2%.
There were 177,000 jobs added in April, and the unemployment rate was at 4.2%.
This graph shows the jobs added per month since January 2021.
The consensus is the trade deficit to be $117.3 billion. The U.S. trade deficit was at $140.5 Billion in March.
8:30 AM: The initial weekly unemployment claims report will be released. The consensus is for initial claims of 230 thousand, down from 240 thousand last week.
 8:30 AM: Employment Report for May. The consensus is for 130,000 jobs added, and for the unemployment rate to be unchanged at 4.2%.
There were 177,000 jobs added in April, and the unemployment rate was at 4.2%.
This graph shows the jobs added per month since January 2021.
Friday, May 30, 2025
May 30th COVID Update: Weekly COVID Deaths at New Pandemic Low
by Calculated Risk on 5/30/2025 07:39:00 PM
 Note: Mortgage rates are from MortgageNewsDaily.com and are for top tier scenarios.
For deaths, I'm currently using 4 weeks ago for "now", since the most recent three weeks will be revised significantly.
Note: "Effective May 1, 2024, hospitals are no longer required to report COVID-19 hospital admissions, hospital capacity, or hospital occupancy data." So, I'm no longer tracking hospitalizations.
| COVID Metrics | ||||
|---|---|---|---|---|
| Now | Week Ago | Goal | ||
| Deaths per Week | 267✅ | 310 | ≤3501 | |
| 1my goals to stop weekly posts. 🚩 Increasing number weekly for Deaths. ✅ Goal met. | ||||
 Click on graph for larger image.
This graph shows the weekly (columns) number of deaths reported since Jan 2020.
Although weekly deaths met the original goal to stop posting in June 2024 (previous pandemic low of 314 deaths), I've continued to post since deaths moved above the goal again - and I'll continue to post until weekly deaths are below the goal for several weeks.
 This appears to be a leading indicator for COVID hospitalizations and deaths. This is close to the lows of May 2024.
Nationally COVID in wastewater is "Very Low".
Q2 GDP Tracking: Wide Range due to Trade "Distortions"
by Calculated Risk on 5/30/2025 02:09:00 PM
From BofA:
Since our last weekly publication, our 2Q GDP tracking is down two-tenths to +1.8% q/q saar. [May 30th estimate]From Goldman:
emphasis added
The goods trade deficit narrowed by more than expected in April, reflecting a sharp decline in goods imports and a moderate increase in goods exports. The Advance Economic Indicators report indicated a significantly larger decline in imports than our previous GDP tracking assumptions, while the details of the personal income and spending report were modestly softer than our previous assumptions. On net, we boosted our Q2 GDP tracking estimate by 1.0pp to +3.3% (quarter-over-quarter annualized). Our Q2 domestic final sales estimate stands at -0.6%. We continue to see the headline Q1 and Q2 GDP growth readings as distorted measures of economic growth because of measurement challenges related to swings in imports around tariff increases. [May 30th estimate]And from the Atlanta Fed: GDPNow

The GDPNow model estimate for real GDP growth (seasonally adjusted annual rate) in the second quarter of 2025 is 3.8 percent on May 30, up from 2.2 percent on May 27. After recent releases from the US Census Bureau and the US Bureau of Economic Analysis, the nowcast of the contribution of net exports to second-quarter real GDP growth increased from -0.64 percentage points to 1.45 percentage points, while the nowcasts of second-quarter real personal consumption expenditures growth and second-quarter real gross private domestic investment growth declined from 3.7 percent and -0.2 percent, respectively, to 3.3 percent and -1.4 percent. [May 30th estimate]
Hotels: Occupancy Rate Decreased 0.4% Year-over-year
by Calculated Risk on 5/30/2025 01:10:00 PM
The U.S. hotel industry reported mixed year-over-year comparisons, according to CoStar’s latest data through 24 May. ...The following graph shows the seasonal pattern for the hotel occupancy rate using the four-week average.
18-24 May 2025 (percentage change from comparable week in 2024):
• Occupancy: 67.5% (-0.4%)
• Average daily rate (ADR): US$164.57 (+1.5%)
• Revenue per available room (RevPAR): US$111.02 (+1.1%)
emphasis added
 Click on graph for larger image.
The red line is for 2025, blue is the median, and dashed light blue is for 2024. Dashed purple is for 2018, the record year for hotel occupancy.
The 4-week average of the occupancy rate is tracking last year and above the median rate for the period 2000 through 2024 (Blue).
Note: Y-axis doesn't start at zero to better show the seasonal change.
The 4-week average will mostly move sideways for a couple more weeks until the summer travel season. We will likely see a hit to occupancy during the summer months due to less international tourism.
Freddie Mac House Price Index Declined in April; Up 2.6% Year-over-year
by Calculated Risk on 5/30/2025 10:09:00 AM
Today, in the Calculated Risk Real Estate Newsletter: Freddie Mac House Price Index Declined in April; Up 2.6% Year-over-year
A brief excerpt:
Freddie Mac reported that its “National” Home Price Index (FMHPI) decreased -0.15% month-over-month (MoM) on a seasonally adjusted (SA) basis in April. On a year-over-year basis, the National FMHPI was up 2.6% in April, down from up 2.9% YoY in March. The YoY increase peaked at 19.0% in July 2021, and for this cycle, bottomed at up 0.9% YoY in April 2023. ...There is much more in the article!
As of April, 26 states and D.C. were below their previous peaks, Seasonally Adjusted. The largest seasonally adjusted declines from the recent peaks are in D.C. (-5.3), Colorado (-2.4%), Oregon (-2.0%), Montana (-1.7%) and Florida (-1.7%).
For cities (Core-based Statistical Areas, CBSA), here are the 30 cities with the largest declines from the peak, seasonally adjusted. Austin continues to be the worst performing city. However, 4 of the 5 cities with the largest price declines are in Florida.

PCE Measure of Shelter Decreases to 4.2% YoY in April
by Calculated Risk on 5/30/2025 08:53:00 AM
Here is a graph of the year-over-year change in shelter from the CPI report and housing from the PCE report this morning, both through April 2025.
 CPI Shelter was up 4.0% year-over-year in April, unchanged from 4.0% in March, and down from the cycle peak of 8.2% in March 2023.
Housing (PCE) was up 4.2% YoY in April, down from 4.3% in March and down from the cycle peak of 8.3% in April 2023.
Since asking rents are mostly flat year-over-year, these measures will slowly continue to decline over the next year as rents for existing tenants continue to increase.
Since asking rents are mostly flat year-over-year, these measures will slowly continue to decline over the next year as rents for existing tenants continue to increase.
 The second graph shows PCE prices, Core PCE prices and Core ex-housing over the last 3 months (annualized):
Key measures are slightly above the Fed's target on a 3-month basis.
3-month annualized change:
PCE Price Index: 2.1%
Core PCE Prices: 2.7%
Core minus Housing: 2.4%
Core PCE Prices: 2.7%
Core minus Housing: 2.4%
Note: It is likely there is still some residual seasonality distorting PCE prices in Q1.
Personal Income increased 0.8% in April; Spending increased 0.2%
by Calculated Risk on 5/30/2025 08:30:00 AM
From the BEA: Personal Income and Outlays, April 2025
Personal income increased $210.1 billion (0.8 percent at a monthly rate) in April, according to estimates released today by the U.S. Bureau of Economic Analysis. Disposable personal income (DPI)—personal income less personal current taxes—increased $189.4 billion (0.8 percent) and personal consumption expenditures (PCE) increased $47.8 billion (0.2 percent).The April PCE price index increased 2.1 percent year-over-year (YoY), down from 2.3 percent YoY in March, and down from the recent peak of 7.2 percent in June 2022.
Personal outlays—the sum of PCE, personal interest payments, and personal current transfer payments—increased $48.6 billion in April. Personal saving was $1.12 trillion in April and the personal saving rate—personal saving as a percentage of disposable personal income—was 4.9 percent.
From the preceding month, the PCE price index for April increased 0.1 percent. Excluding food and energy, the PCE price index also increased 0.1 percent.
From the same month one year ago, the PCE price index for April increased 2.1 percent. Excluding food and energy, the PCE price index increased 2.5 percent from one year ago.
emphasis added
The PCE price index, excluding food and energy, increased 2.5 percent YoY, down from 2.6 percent the previous month, and down from the recent peak of 5.6 percent in February 2022.
The following graph shows real Personal Consumption Expenditures (PCE) through April 2025 (2017 dollars). Note that the y-axis doesn't start at zero to better show the change.
 Click on graph for larger image.
The dashed red lines are the quarterly levels for real PCE.
Personal income was above expectations and PCE were at expectations.
Inflation was slightly below expectations.
Thursday, May 29, 2025
Friday: Personal Income and Outlays
by Calculated Risk on 5/29/2025 07:21:00 PM
 Note: Mortgage rates are from MortgageNewsDaily.com and are for top tier scenarios.
Friday:
• At 8:30 AM ET, Personal Income and Outlays, April 2025. The consensus is for a 0.3% increase in personal income, and for a 0.2% increase in personal spending. And for the Core PCE price index to increase 0.1%. PCE prices are expected to be up 2.2% YoY, and core PCE prices up 2.5% YoY.
• At 9:45 AM, Chicago Purchasing Managers Index for May.
• At 10:00 AM: University of Michigan's Consumer sentiment index (Final for May). The consensus is for a reading of 50.8.
Realtor.com Reports Most Actively "For Sale" Inventory since 2019
by Calculated Risk on 5/29/2025 01:08:00 PM
What this means: On a weekly basis, Realtor.com reports the year-over-year change in active inventory and new listings. On a monthly basis, they report total inventory. For May, Realtor.com reported inventory was up 30.6% YoY, but still down 16.3% compared to the 2017 to 2019 same month levels.
Now - on a weekly basis - inventory is up 29.7% YoY.
Realtor.com has monthly and weekly data on the existing home market. Here is their weekly report: Weekly Housing Trends View—Data for Week Ending May 24, 2025 Here is a graph of the year-over-year change in inventory according to realtor.com.
Inventory was up year-over-year for the 81st consecutive week.
Realtor.com has monthly and weekly data on the existing home market. Here is their weekly report: Weekly Housing Trends View—Data for Week Ending May 24, 2025
• Active inventory climbed 29.7% year-over-year
The number of homes actively for sale remains on a strong upward trajectory, now 29.7% higher than this time last year. This represents the 81st consecutive week of annual gains in inventory. There were more than 1 million homes for sale last week, the highest inventory level since December 2019.
• New listings—a measure of sellers putting homes up for sale—rising 8.2% year-over-year
New listings rose again last week, up 8.2% compared to the same period last year.
• The median list price was up 0.2% year-over-year
After a brief cooling period the previous week, the national median listing price resumed its upward trajectory last week. At the same time, the median listing price per square foot—which adjusts for changes in home size—rose 0.9% year-over-year.
 Here is a graph of the year-over-year change in inventory according to realtor.com.
 Inventory was up year-over-year for the 81st consecutive week.
New listings were solid.
Median list prices were mostly unchanged year-over-year.
NAR: Pending Home Sales Decrease 6.3% in April; Down 2.5% YoY
by Calculated Risk on 5/29/2025 10:00:00 AM
From the NAR: Pending Home Sales Declined 6.3% in April
Pending home sales decreased 6.3% in April, according to the National Association of REALTORS®. All four U.S. regions experienced month-over-month losses in transactions. Year-over-year, contract signings rose in the Midwest but descended in the Northeast, South and West – with the West suffering the greatest loss.Note: Contract signings usually lead sales by about 45 to 60 days, so this would usually be for closed sales in May and June.
The Pending Home Sales Index (PHSI)* – a forward-looking indicator of home sales based on contract signings – dove 6.3% to 71.3 in April. Year-over-year, pending transactions retracted by 2.5%. An index of 100 is equal to the level of contract activity in 2001.
"At this critical stage of the housing market, it is all about mortgage rates," said NAR Chief Economist Lawrence Yun. "Despite an increase in housing inventory, we are not seeing higher home sales. Lower mortgage rates are essential to bring home buyers back into the housing market."
...
The Northeast PHSI decreased 0.6% from last month to 62.1, down 3.0% from April 2024. The Midwest index condensed 5.0% to 73.5 in April, up 2.2% from the previous year.
The South PHSI sank 7.7% to 85.9 in April, down 3.0% from a year ago. The West index degraded 8.9% from the prior month to 53.3, down 6.5% from April 2024.
emphasis added
Q1 GDP Growth Revised up to -0.2% Annual Rate
by Calculated Risk on 5/29/2025 08:35:00 AM
From the BEA: Gross Domestic Product (Second Estimate), Corporate Profits (Preliminary Estimate), 1st Quarter 2025
Real gross domestic product (GDP) decreased at an annual rate of 0.2 percent in the first quarter of 2025 (January, February, and March), according to the second estimate released by the U.S. Bureau of Economic Analysis. In the fourth quarter of 2024, real GDP increased 2.4 percent.Here is a Comparison of Second and Advance Estimates. PCE growth was revised down from 1.8% to 1.2%. Residential investment was revised down from 1.3% to -0.6%.
The decrease in real GDP in the first quarter primarily reflected an increase in imports, which are a subtraction in the calculation of GDP, and a decrease in government spending. These movements were partly offset by increases in investment, consumer spending, and exports.
Real GDP was revised up 0.1 percentage point from the advance estimate, reflecting an upward revision to investment that was partly offset by a downward revision to consumer spending.
emphasis added
Weekly Initial Unemployment Claims Increase to 240,000
by Calculated Risk on 5/29/2025 08:30:00 AM
The DOL reported:
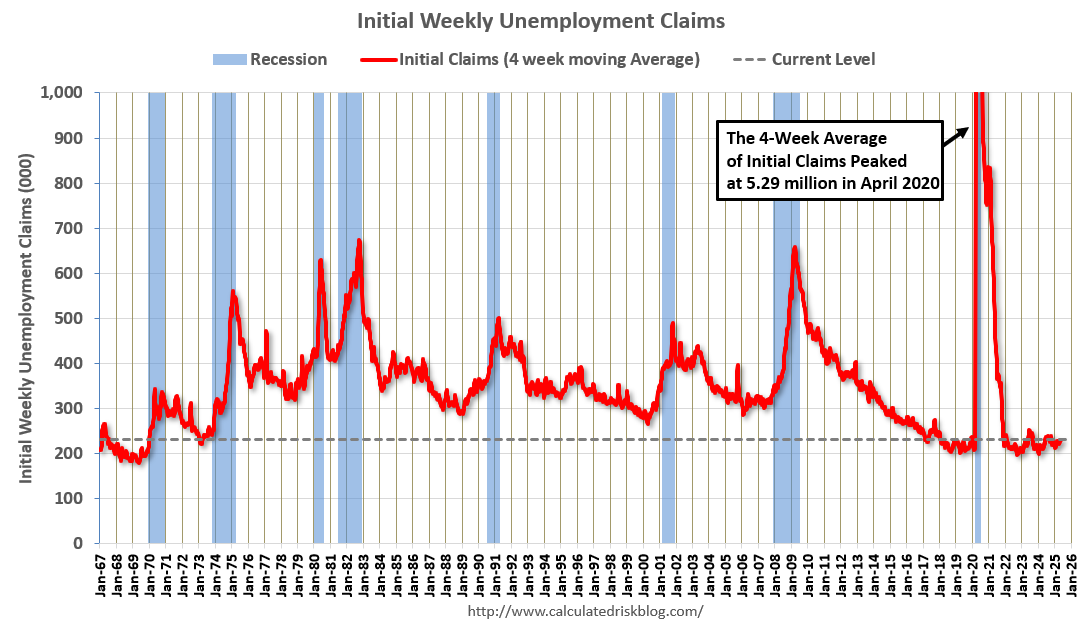
In the week ending May 24, the advance figure for seasonally adjusted initial claims was 240,000, an increase of 14,000 from the previous week's revised level. The previous week's level was revised down by 1,000 from 227,000 to 226,000. The 4-week moving average was 230,750, a decrease of 250 from the previous week's revised average. The previous week's average was revised down by 500 from 231,500 to 231,000.The following graph shows the 4-week moving average of weekly claims since 1971.
emphasis added
 Click on graph for larger image.
The dashed line on the graph is the current 4-week average. The four-week average of weekly unemployment claims decreased to 230,750.
The previous week was revised down.
Weekly claims were higher than the consensus forecast.
Wednesday, May 28, 2025
Thursday: GDP, Unemployment Claims, Pending Home Sales
by Calculated Risk on 5/28/2025 07:15:00 PM
 Note: Mortgage rates are from MortgageNewsDaily.com and are for top tier scenarios.
Thursday:
• At 8:30 AM, The initial weekly unemployment claims report will be released. The consensus is for initial claims of 225 thousand, down from 227 thousand last week.
• Also at 8:30 AM, Gross Domestic Product, 1st quarter 2025 (Second estimate). The consensus is that real GDP decreased 0.3% annualized in Q1, unchanged from the advance estimate of -0.3%.
• At 10:00 AM, Pending Home Sales Index for April. The consensus is for a 0.4% decrease in the index.
Las Vegas in April: Visitor Traffic Down 5.1% YoY; Convention Traffic up 13.9% YoY
by Calculated Risk on 5/28/2025 03:24:00 PM
From the Las Vegas Visitor Authority: April 2025 Las Vegas Visitor Statistics
With a strong convention segment and events including Wrestlemania, counterbalanced by consumer uncertainty with evolving federal policies, visitation saw a net YoY decrease of ‐5.1% as the destination hosted approximately 3.3 million visitors in April.
Convention attendance approached 574k attendees for the month, up 13.9% YoY, benefitting from the in‐rotation of shows that were held elsewhere last year including International Sign Expo (21k attendees), American Urological Association (15k attendees) and The Carwash Show (10k attendees).
Occupancy reached 84.5%, down ‐1.0 pt with Weekend occupancy of 93.8% (up +0.4 pts) and Midweek occupancy of 81.2% (down ‐1.4 pts). ADR for the month reached $190 (+4.4% YoY) with RevPAR of $161 (+3.2% YoY).
emphasis added
 Click on graph for larger image.
 The first graph shows visitor traffic for 2019 (Black), 2020 (dark blue), 2021 (light blue), 2022 (light orange), 2023 (orange), 2024 (dark orange) and 2025 (red).
Visitor traffic was down 5.1% compared to last April. Visitor traffic was down 5.8% compared to April 2019.
Year-to-date (YTD) visitor traffic is down 5.8% compared to the same period in 2019.
 Convention traffic was up 13.9% compared to April 2024, and up 8.3% compared to April 2019.
The second graph shows convention traffic.

YTD convention traffic is down 6.4% compared to 2019.
FOMC Minutes: "Difficult tradeoffs" if Inflation "more persistent" and "growth and employment weaken"
by Calculated Risk on 5/28/2025 03:07:00 PM
From the Fed: Minutes of the Federal Open Market Committee, May 6–7, 2025. Excerpt:
In considering the outlook for monetary policy, participants agreed that with economic growth and the labor market still solid and current monetary policy moderately restrictive, the Committee was well positioned to wait for more clarity on the outlooks for inflation and economic activity. Participants agreed that uncertainty about the economic outlook had increased further, making it appropriate to take a cautious approach until the net economic effects of the array of changes to government policies become clearer. Participants noted that monetary policy would be informed by a wide range of incoming data, the economic outlook, and the balance of risks.
In discussing risk-management considerations that could bear on the outlook for monetary policy, participants agreed that the risks of higher inflation and higher unemployment had risen. Almost all participants commented on the risk that inflation could prove to be more persistent than expected. Participants emphasized the importance of ensuring that longer-term inflation expectations remained well anchored, with some noting that expectations might be particularly sensitive because inflation had been above the Committee's target for an extended period. Participants noted that the Committee might face difficult tradeoffs if inflation proves to be more persistent while the outlooks for growth and employment weaken. Participants observed, however, that the ultimate extent of changes to government policy and their effects on the economy was highly uncertain. A few participants additionally noted that higher uncertainty could restrain business and consumer demand and that inflationary pressures could be damped if downside risks to economic activity or the labor market materialized.
emphasis added
Inflation Adjusted House Prices 1.0% Below 2022 Peak; Price-to-rent index is 8.1% below 2022 peak
by Calculated Risk on 5/28/2025 12:15:00 PM
Today, in the Calculated Risk Real Estate Newsletter: Inflation Adjusted House Prices 1.0% Below 2022 Peak
Excerpt:
It has been almost 19 years since the housing bubble peak, ancient history for some readers!There is much more in the article!
In the March Case-Shiller house price index released yesterday, the seasonally adjusted National Index (SA), was reported as being 78% above the bubble peak in 2006. However, in real terms, the National index (SA) is about 12% above the bubble peak (and historically there has been an upward slope to real house prices). The composite 20, in real terms, is 3% above the bubble peak.
People usually graph nominal house prices, but it is also important to look at prices in real terms. As an example, if a house price was $300,000 in January 2010, the price would be $441,000 today adjusted for inflation (47% increase). That is why the second graph below is important - this shows "real" prices.
The third graph shows the price-to-rent ratio, and the fourth graph is the affordability index. The last graph shows the 5-year real return based on the Case-Shiller National Index.
...
The second graph shows the same two indexes in real terms (adjusted for inflation using CPI).
In real terms (using CPI), the National index is 1.0% below the recent peak, and the Composite 20 index is 1.2% below the recent peak in 2022.
Both the real National index and the Comp-20 index decreased slightly in March.
It has now been 34 months since the real peak in house prices. Typically, after a sharp increase in prices, it takes a number of years for real prices to reach new highs (see House Prices: 7 Years in Purgatory)

FDIC: Commercial Real Estate "Past-Due and nonaccrual" Highest Since 2014
by Calculated Risk on 5/28/2025 10:00:00 AM
The FDIC released the Quarterly Banking Profile for Q1 2025:
Net Income Increased from the Prior Quarter, Led by Higher Noninterest Income
Quarterly net income for the 4,462 FDIC-insured commercial banks and savings institutions totaled $70.6 billion, up $3.8 billion (5.8 percent) from the prior quarter. The banking industry reported an aggregate return on assets of 1.16 percent in first quarter 2025, up from 1.11 percent in fourth quarter 2024 and up from 1.09 percent in the year-ago quarter. The quarterly increase in net income was led by higher noninterest income (up $5.4 billion, or 7 percent). Gains in noninterest income were due to market movements and volatility as several large firms reported mark-to-market gains on certain financial instruments in the quarter. Industry noninterest income also benefited from other one-time items, such as gains on loan sales. Lower losses on the sale of securities also contributed to the increase in net income.
...
Asset Quality Metrics Remained Generally Favorable, Though Weakness in Certain Portfolios Persisted
Past-due and nonaccrual (PDNA) loans, or loans that are 30 or more days past due or in nonaccrual status, fell 1 basis point from the prior quarter to 1.59 percent of total loans. The industry’s PDNA ratio is still below the pre-pandemic average of 1.94 percent. While banks reported quarterly decreases in PDNA credit card loans (down $2.7 billion, or 9 basis points to 3.22 percent) and auto loans (down $2.6 billion, or 48 basis points to 2.84 percent), weaknesses persisted in certain portfolios. The PDNA rate for commercial real estate (CRE) loan portfolios is the highest it has been since fourth quarter 2014 at 1.49 percent. Multifamily CRE PDNAs have grown the most in the past year, up 88 basis points to 1.47 percent.
The industry’s net charge-off rate decreased 3 basis points to 0.67 percent from the prior quarter and is 1 basis point higher than the year-ago quarter and 19 basis points above the pre-pandemic average. Most portfolios have net charge-off rates above their pre-pandemic averages including credit card loans, which are 123 basis points above the pre-pandemic average at 4.71 percent.
emphasis added
 Click on graph for larger image.
From the FDIC:
The Number of Problem Banks Decreased in the First QuarterThis graph from the FDIC shows the number of problem banks.
The number of banks on the FDIC’s “Problem Bank List” decreased by a net of three in the first quarter to 63 banks. The number of problem banks represented 1.4 percent of total banks in the first quarter, which is in the middle of the normal range for non-crisis periods of 1 to 2 percent of all banks.
MBA: Mortgage Applications Decrease in Latest MBA Weekly Survey
by Calculated Risk on 5/28/2025 07:00:00 AM
From the MBA: Mortgage Applications Decrease in Latest MBA Weekly Survey
Mortgage applications decreased 1.2 percent from one week earlier, according to data from the Mortgage Bankers Association’s (MBA) Weekly Mortgage Applications Survey for the week ending May 23, 2025.
The Market Composite Index, a measure of mortgage loan application volume, decreased 1.2 percent on a seasonally adjusted basis from one week earlier. On an unadjusted basis, the Index decreased 2 percent compared with the previous week. The Refinance Index decreased 7 percent from the previous week and was 37 percent higher than the same week one year ago. The seasonally adjusted Purchase Index increased 3 percent from one week earlier. The unadjusted Purchase Index increased 2 percent compared with the previous week and was 18 percent higher than the same week one year ago.
“Mortgage rates reached its highest level since January, following higher Treasury yields. Additional market volatility has added to the increase, keeping the mortgage-Treasury spread wider than it was earlier this year. The 30-year fixed rate increased to 6.98 percent, its third consecutive weekly increase,” said Joel Kan, MBA’s Vice President and Deputy Chief Economist. “As a result of these higher rates, applications activity decreased, driven by a 7 percent decline in refinance applications. Conventional refinances were down 6 percent, and VA refinances dropped 16 percent. Purchase applications were up over the week and continue to run ahead of last year's pace as increased housing inventory in many markets has been supporting some transaction volume, despite the economic uncertainty.”
...
The average contract interest rate for 30-year fixed-rate mortgages with conforming loan balances ($806,500 or less) increased to 6.98 percent from 6.92 percent, with points decreasing to 0.67 from 0.69 (including the origination fee) for 80 percent loan-to-value ratio (LTV) loans.
emphasis added
 Click on graph for larger image.
The first graph shows the MBA mortgage purchase index.
According to the MBA, purchase activity is up 18% year-over-year unadjusted.
Red is a four-week average (blue is weekly).
Purchase application activity is still depressed, but above the lows of October 2023 and is 7% above the lowest levels during the housing bust.

The second graph shows the refinance index since 1990.
The refinance index decreased and remained very low.
Tuesday, May 27, 2025
Wednesday: FOMC Minutes
by Calculated Risk on 5/27/2025 07:17:00 PM
 Note: Mortgage rates are from MortgageNewsDaily.com and are for top tier scenarios.
Wednesday:
• At 7:00 AM ET, The Mortgage Bankers Association (MBA) will release the results for the mortgage purchase applications index.
• At 10:00 AM, Richmond Fed Survey of Manufacturing Activity for May.
2:00 PM, FOMC Minutes, Minutes Meeting of May 6-7, 2025
A few comments on the Seasonal Pattern for House Prices
by Calculated Risk on 5/27/2025 01:10:00 PM
Another update ... a few key points:
1) There is a clear seasonal pattern for house prices.
2) The surge in distressed sales during the housing bust distorted the seasonal pattern. This was because distressed sales (at lower price points) happened at a steady rate all year, while regular sales followed the normal seasonal pattern. This made for larger swings in the seasonal factor during the housing bust.
3) The seasonal swings have increased recently without a surge in distressed sales.
 Click on graph for larger image.
This graph shows the month-to-month change in the NSA Case-Shiller National index since 1987 (through March 2025). The seasonal pattern was smaller back in the '90s and early '00s and increased once the bubble burst.
The seasonal swings declined following the bust, however the pandemic price surge changed the month-over-month pattern.
 The second graph shows the seasonal factors for the Case-Shiller National index since 1987. The factors started to change near the peak of the bubble, and really increased during the bust since normal sales followed the regular seasonal pattern - and distressed sales happened all year.
The swings in the seasonal factors were decreasing following the bust but have increased again recently - this time without a surge in distressed sales.
 Click on graph for larger image.
This graph shows the month-to-month change in the NSA Case-Shiller National index since 1987 (through March 2025). The seasonal pattern was smaller back in the '90s and early '00s and increased once the bubble burst.
The seasonal swings declined following the bust, however the pandemic price surge changed the month-over-month pattern.
 The second graph shows the seasonal factors for the Case-Shiller National index since 1987. The factors started to change near the peak of the bubble, and really increased during the bust since normal sales followed the regular seasonal pattern - and distressed sales happened all year.
 The swings in the seasonal factors were decreasing following the bust but have increased again recently - this time without a surge in distressed sales.
Newsletter: Case-Shiller: National House Price Index Up 3.4% year-over-year in March
by Calculated Risk on 5/27/2025 09:52:00 AM
Today, in the Calculated Risk Real Estate Newsletter: Case-Shiller: National House Price Index Up 3.4% year-over-year in March
Excerpt:
S&P/Case-Shiller released the monthly Home Price Indices for March ("March" is a 3-month average of January, February and March closing prices). January closing prices include some contracts signed in November, so there is a significant lag to this data. Here is a graph of the month-over-month (MoM) change in the Case-Shiller National Index Seasonally Adjusted (SA).
The MoM decrease in the seasonally adjusted (SA) Case-Shiller National Index was at -0.30% (a -3.5% annual rate), This was the first MoM decrease since January 2023.
On a seasonally adjusted basis, prices increased month-to-month in just 6 of the 20 Case-Shiller cities. San Francisco has fallen 6.3% from the recent peak, Tampa is down 2.6% from the peak, and Denver down 1.9%.

Case-Shiller: National House Price Index Up 3.4% year-over-year in March
by Calculated Risk on 5/27/2025 09:00:00 AM
S&P/Case-Shiller released the monthly Home Price Indices for March ("March" is a 3-month average of January, February and March closing prices).
This release includes prices for 20 individual cities, two composite indices (for 10 cities and 20 cities) and the monthly National index.
From S&P S&P CoreLogic Case-Shiller Index Records 3.4% Annual Gain in March 2025
The S&P CoreLogic Case-Shiller U.S. National Home Price NSA Index, covering all nine U.S. census divisions, reported a 3.4% annual return for March, down from a 4% annual gain in the previous month. The 10-City Composite saw an annual increase of 4.8%, down from a 5.2% annual increase in the previous month. The 20-City Composite posted a year-over-year increase of 4.1%, down from a 4.5% increase in the previous month. New York again reported the highest annual gain among the 20 cities with an 8% increase in March, followed by Chicago and Cleveland with annual increases of 6.5% and 5.9%, respectively. Tampa posted the lowest return, falling 2.2%.
...
The pre-seasonally adjusted U.S. National, 10-City Composite, and 20-City Composite Indices saw slight upward trends in March, posting gains of 0.8%, 1.2%, and 1.1%, respectively.
After seasonal adjustment, the U.S. National Index posted a decrease of -0.3%. The 10-City Composite Index recorded a 0.01% increase and the 20-City Composite Index presented a -0.1% decrease.
“Home price growth continued to decelerate on an annual basis in March, even as the market experienced its strongest monthly gains so far in 2025,” said Nicholas Godec, CFA, CAIA, CIPM, Head of Fixed Income Tradables & Commodities at S&P Dow Jones Indices. “This divergence between slowing year-over-year appreciation and renewed spring momentum highlighted how the housing market shifted from mere resilience to a broader seasonal recovery. Limited supply and steady demand drove prices higher across most metropolitan areas, despite affordability challenges remaining firmly in place."
emphasis added
 Click on graph for larger image.
 The first graph shows the nominal seasonally adjusted Composite 10, Composite 20 and National indices (the Composite 20 was started in January 2000).
The Composite 10 index was up 0.01% in March (SA). The Composite 20 index was down 0.1% (SA) in March.
The National index was down 0.3% (SA) in March.
The second graph shows the year-over-year change in all three indices.The Composite 10 NSA was up 4.8% year-over-year. The Composite 20 NSA was up 4.1% year-over-year.
The National index NSA was up 3.4% year-over-year.
Annual price changes were lower than expectations. I'll have more later.
Monday, May 26, 2025
Tuesday: Durable Goods, Case-Shiller House Prices
by Calculated Risk on 5/26/2025 06:48:00 PM
Weekend:
• Schedule for Week of May 25, 2025
Tuesday:
• At 8:30 AM ET, Durable Goods Orders for April from the Census Bureau. The consensus is for a 7.8% decrease in durable goods orders.
• At 9:00 AM, S&P/Case-Shiller House Price Index for March. The consensus is for the Case-Shiller 20-City Composite Index to increase 4.5% YoY, unchanged from 4.5% YoY in February.
• Also at 9:00 AM, FHFA House Price Index for March. This was originally a GSE only repeat sales, however there is also an expanded index.
• At 10:00 AM, Dallas Fed Survey of Manufacturing Activity for May.
From CNBC: Pre-Market Data and Bloomberg futures S&P 500 are up 63 and DOW futures are up 402 (fair value).
Oil prices were down over the last week with WTI futures at $61.46 per barrel and Brent at $64.72 per barrel. A year ago, WTI was at $78, and Brent was at $79 - so WTI oil prices are down about 21% year-over-year.
Here is a graph from Gasbuddy.com for nationwide gasoline prices. Nationally prices are at $3.13 per gallon. A year ago, prices were at $3.56 per gallon, so gasoline prices are down $0.43 year-over-year.
Final Look at Local Housing Markets in April and a Look Ahead to May Sales
by Calculated Risk on 5/26/2025 12:44:00 PM
Today, in the Calculated Risk Real Estate Newsletter: Final Look at Local Housing Markets in April and a Look Ahead to May Sales
A brief excerpt:
After the National Association of Realtors® (NAR) releases the monthly existing home sales report, I pick up additional local market data that is reported after the NAR. This is the final look at local markets in April.There is much more in the article.
There were several key stories for April:
• Sales NSA are down YoY through April, and sales last year were the lowest since 1995! Ouch.
• Sales SA were down YoY for the 3rd consecutive month and 40 of the last 44 months.
• Months-of-supply is at the highest level since 2016 (excluding one month near the start of the pandemic).
• The median price is barely up YoY, and with the increases in inventory, some regional areas will see more price declines.
Sales at 4.00 million on a Seasonally Adjusted Annual Rate (SAAR) basis were below the consensus estimate; however, housing economist Tom Lawler’s estimate was very close (as usual).
Sales averaged close to 5.4 million SAAR for the month of April in the 2017-2019 period. So, sales are about 26% below pre-pandemic levels.
Also, months-of-supply for April was above pre-pandemic levels for the period 2017-2019 and the highest for April since 2016.
...
Here is a look at months-of-supply using NSA sales. Since this is NSA data, it is likely months-of-supply will increase over the next few months.
Months in red are areas that are seeing 5+ months of supply now and might see price pressures later this summer.
...
More local data coming in June for activity in May!

Memorial Day: Remembering James Hoey
by Calculated Risk on 5/26/2025 10:29:00 AM
Memorial Day is about remembering those that in the words of Abraham Lincoln, “gave the last full measure of devotion” in defending our nation so “that this government of the people, by the people, for the people, shall not perish from the earth”.
Today I’m thinking of my distant relative, James Hoey (Jan 14, 1842 – Aug 13, 1864) who fought for the Union during the Civil War and gave the ultimate sacrifice at the age of 22. Thank you, James!
My family has fought in every major American war. For example, my 4th Great Grandfather, William Marks (1749 – 1824) fought in the revolutionary war. His son, my 3rd Great Grandfather, William Marks, Jr. was a Brigadier General during the war of 1812 – and went on the serve as a U.S. Senator from the State of Pennsylvania.
We must also remember what they all fought for: America’s core value is the rule of law rooted in the U.S. Constitution. We are a Nation of Laws, not of men.
Housing May 26th Weekly Update: Inventory up 2.6% Week-over-week, Up 32.4% Year-over-year
by Calculated Risk on 5/26/2025 08:11:00 AM
Altos reports that active single-family inventory was up 2.6% week-over-week.
Inventory is now up 26.0% from the seasonal bottom in January and is increasing.
Usually, inventory is up about 15% from the seasonal low by this week in the year. So, 2025 is seeing a larger than normal pickup in inventory.
The first graph shows the seasonal pattern for active single-family inventory since 2015.
 Click on graph for larger image.
The red line is for 2025. The black line is for 2019.
Inventory was up 32.4% compared to the same week in 2024 (last week it was up 32.7%), and down 15.6% compared to the same week in 2019 (last week it was down 15.6%).
This is the highest level since 2019.
It now appears inventory will be close to 2019 levels towards the end of 2025.
 This second inventory graph is courtesy of Altos Research.
As of May 23rd, inventory was at 787 thousand (7-day average), compared to 767 thousand the prior week.
Mike Simonsen discusses this data regularly on Youtube
Sunday, May 25, 2025
The Normal Seasonal Pattern for Median House Prices
by Calculated Risk on 5/25/2025 08:12:00 AM
This week, in the CalculatedRisk Real Estate Newsletter on March existing home sales, NAR: Existing-Home Sales Decreased to 4.00 million SAAR in April; Down 2.0% YoY, I noted:
On a month-over-month basis, median prices increased 2.7% from March and are now down 3.0% from the June 2024 peak. This is less than the normal seasonal increase in the median price for April.Seasonally, median prices typically peak in June (closed sales are mostly for contracts signed in April and May).
And seasonally, prices usually bottom the following January (contracts signed in November and December).
Here is a table of the seasonal percentage increases from January to April, from April to June, and from January to June (the usual seasonal peak), over the last several years.
The last row shows the seasonal decline from June to January of the following year.
In 2020, prices continued to increase in the 2nd half of the year and didn't peak seasonally until October. And prices only declined slightly in the 2nd half of 2021.
| 2018 | 2019 | 2020 | 2021 | 2022 | 2023 | 2024 | 2025 | |
|---|---|---|---|---|---|---|---|---|
| Jan to Apr | 7.1% | 7.1% | 7.7% | 12.2% | 11.6% | 6.9% | 7.4% | 5.2% |
| Apr to Jun | 6.2% | 6.9% | 2.6% | 7.7% | 4.6% | 6.3% | 5.0% | NA |
| Jan to Jun | 13.7% | 14.4% | 10.6% | 20.8% | 16.8% | 13.7% | 12.8% | NA |
| Jun to Jan | -8.9% | -6.7% | 3.1% | -3.4% | -12.8% | -7.7% | -7.8% | NA |
The 2025 increase in median prices from January to April was less than the normal seasonal increase.
Normally we'd expect median prices to increase about 6% to 7% over the next three months, before declining in the 2nd half of the year. With more and more inventory, and economic uncertainty, the seasonal increase from April to June will probably be less than 6% this year.
Saturday, May 24, 2025
Real Estate Newsletter Articles this Week: Existing-Home Sales Decreased to 4.00 million SAAR in April
by Calculated Risk on 5/24/2025 02:11:00 PM
At the Calculated Risk Real Estate Newsletter this week:
 Click on graph for larger image.
• NAR: Existing-Home Sales Decreased to 4.00 million SAAR in April; Down 2.0% YoY
• New Home Sales Increase to 743,000 Annual Rate in April
• "How do you grade the Spring housing market?"
• In Q1 2025, 19% of Units Started Built-for-Rent were Single Family
• California Home Sales "Retreat" in April; New Listings "Surge"
This is usually published 4 to 6 times a week and provides more in-depth analysis of the housing market.
Schedule for Week of May 25, 2025
by Calculated Risk on 5/24/2025 08:11:00 AM
The key reports this week are the second estimate of Q1 GDP, March Case-Shiller house prices, and Personal Income and Outlays for April.
For manufacturing, the May Richmond and Dallas Fed manufacturing surveys will be released.
All US markets will be closed in observance of Memorial Day.
8:30 AM: Durable Goods Orders for April from the Census Bureau. The consensus is for a 7.8% decrease in durable goods orders.
 9:00 AM: S&P/Case-Shiller House Price Index for March. The consensus is for the Case-Shiller 20-City Composite Index to increase 4.5% YoY, unchanged from 4.5% YoY in February.
This graph shows the year-over-year change in the seasonally adjusted National Index, Composite 10 and Composite 20 indexes through the most recent report (the Composite 20 was started in January 2000).
9:00 AM: FHFA House Price Index for March. This was originally a GSE only repeat sales, however there is also an expanded index.
10:00 AM: Dallas Fed Survey of Manufacturing Activity for May.
7:00 AM ET: The Mortgage Bankers Association (MBA) will release the results for the mortgage purchase applications index.
10:00 AM: Richmond Fed Survey of Manufacturing Activity for May.
2:00 PM: FOMC Minutes, Minutes Meeting of May 6-7, 2025
8:30 AM: The initial weekly unemployment claims report will be released. The consensus is for initial claims of 225 thousand, down from 227 thousand last week.
8:30 AM: Gross Domestic Product, 1st quarter 2025 (Second estimate). The consensus is that real GDP decreased 0.3% annualized in Q1, unchanged from the advance estimate of -0.3%.
10:00 AM: Pending Home Sales Index for April. The consensus is for a 0.4% decrease in the index.
8:30 AM ET: Personal Income and Outlays, April 2025. The consensus is for a 0.3% increase in personal income, and for a 0.2% increase in personal spending. And for the Core PCE price index to increase 0.1%. PCE prices are expected to be up 2.2% YoY, and core PCE prices up 2.5% YoY.
9:45 AM: Chicago Purchasing Managers Index for May.
10:00 AM: University of Michigan's Consumer sentiment index (Final for May). The consensus is for a reading of 50.8.
Friday, May 23, 2025
May 23rd COVID Update: Weekly COVID Deaths at New Pandemic Low
by Calculated Risk on 5/23/2025 07:05:00 PM
 Note: Mortgage rates are from MortgageNewsDaily.com and are for top tier scenarios.
For deaths, I'm currently using 4 weeks ago for "now", since the most recent three weeks will be revised significantly.
Note: "Effective May 1, 2024, hospitals are no longer required to report COVID-19 hospital admissions, hospital capacity, or hospital occupancy data." So, I'm no longer tracking hospitalizations.
| COVID Metrics | ||||
|---|---|---|---|---|
| Now | Week Ago | Goal | ||
| Deaths per Week | 306✅ | 368 | ≤3501 | |
| 1my goals to stop weekly posts. 🚩 Increasing number weekly for Deaths. ✅ Goal met. | ||||
 Click on graph for larger image.
This graph shows the weekly (columns) number of deaths reported since Jan 2023.
Although weekly deaths met the original goal to stop posting in June 2024 (previous pandemic low of 314 deaths), I've continued to post since deaths were above the goal again - and I'll continue to post until weekly deaths are below the goal for several weeks.
 This appears to be a leading indicator for COVID hospitalizations and deaths. This is moving towards the lows last May.
Nationally COVID in wastewater is "Low".
Q2 GDP Tracking: Low 2%
by Calculated Risk on 5/23/2025 02:00:00 PM
From BofA:
Since our last weekly publication, our 2Q and 1Q GDP tracking are down two-tenths each to +2.0% q/q saar and -0.5% q/q saar, respectively. [May 23rd estimate]From Goldman:
emphasis added
We left our Q2 GDP tracking estimate unchanged at +2.1% (quarter-over-quarter annualized) and our Q2 domestic final sales forecast unchanged at 0%. We left our past-quarter tracking estimate unchanged at -0.5%. [May 23rd estimate]And from the Atlanta Fed: GDPNow

The GDPNow model estimate for real GDP growth (seasonally adjusted annual rate) in the second quarter of 2025 is 2.4 percent on May 16, down from 2.5 percent on May 15. After this morning’s housing starts report from the US Census Bureau and the release of import and export price indexes from the US Bureau of Labor Statistics, the nowcast of second-quarter real residential fixed investment growth decreased from 0.4 percent to -3.0 percent. [May 16th estimate] (Next update on May 27th)
Newsletter: New Home Sales Increase to 743,000 Annual Rate in April
by Calculated Risk on 5/23/2025 10:59:00 AM
Today, in the Calculated Risk Real Estate Newsletter: New Home Sales Increase to 743,000 Annual Rate in April
Brief excerpt:
The Census Bureau reported New Home Sales in April were at a seasonally adjusted annual rate (SAAR) of 743 thousand. The previous three months were revised down significantly, combined.There is much more in the article.
...
The next graph shows new home sales for 2024 and 2025 by month (Seasonally Adjusted Annual Rate). Sales in April 2025 were up 3.3% from April 2024.
New home sales, seasonally adjusted, have increased year-over-year in 19 of the last 25 months. This is essentially the opposite of what happened with existing home sales that had been down year-over-year for 40 of the last 44 months.

New Home Sales Increase to 743,000 Annual Rate in April
by Calculated Risk on 5/23/2025 10:00:00 AM
The Census Bureau reports New Home Sales in April were at a seasonally adjusted annual rate (SAAR) of 743 thousand.
The previous three months were revised down significantly, combined.
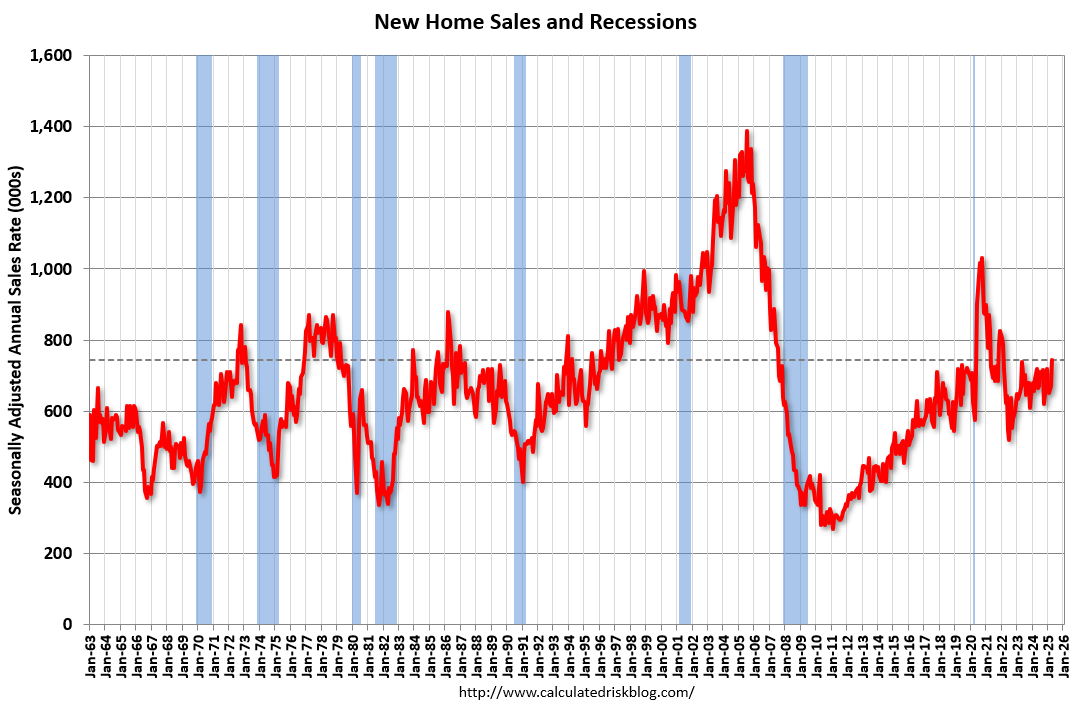
Sales of new single-family houses in April 2025 were at a seasonally-adjusted annual rate of 743,000, according to estimates released jointly today by the U.S. Census Bureau and the Department of Housing and Urban Development. This is 10.9 percent above the March 2025 rate of 670,000, and is 3.3 percent above the April 2024 rate of 719,000.
emphasis added
 Click on graph for larger image.
The first graph shows New Home Sales vs. recessions since 1963. The dashed line is the current sales rate.
New home sales were above pre-pandemic levels.
The second graph shows New Home Months of Supply.
 The months of supply decreased in April to 8.1 months from 9.1 months in March.
 The all-time record high was 12.2 months of supply in January 2009. The all-time record low was 3.3 months in August 2020.
This is well above the top of the normal range (about 4 to 6 months of supply is normal).
"The seasonally-adjusted estimate of new houses for sale at the end of April 2025 was 504,000. This is 0.6 percent below the March 2025 estimate of 507,000, and is 8.6 percent above the April 2024 estimate of 464,000.Sales were above expectations of 700 thousand SAAR, however sales for the three previous months were revised down significantly, combined. I'll have more later today.
This represents a supply of 8.1 months at the current sales rate. The months' supply is 11.0 percent below the March 2025 estimate of 9.1 months, and is 5.2 percent above the April 2024 estimate of 7.7 months."
ICE First Look at April Mortgage Performance: "Foreclosure Activity Edges Higher Following Recent Record Lows"
by Calculated Risk on 5/23/2025 08:09:00 AM
From Intercontinental Exchange: ICE First Look at Mortgage Performance: Foreclosure Activity Edges Higher Following Recent Record Lows
Intercontinental Exchange, Inc. (NYSE:ICE) ... today released its April 2025 First Look, which shows U.S. Department of Veterans Affairs (VA) mortgages progressing through the foreclosure pipeline following the recent moratorium expiration.
The ICE First Look reports on month-end delinquency, foreclosure and prepayment statistics sourced from its loan-level database, which covers a majority of the U.S. mortgage market. Key takeaways from this month’s findings include:
• The national delinquency rate ticked up 1 basis point (bp) to 3.22% in April and is up a modest 13 bps (4.1%) from the same time last year. Still, delinquencies remain below pre-pandemic levels.
• Serious delinquencies – loans 90+ days past due but not in foreclosure – improved seasonally but rose 14% from April 2024 marking the sixth consecutive month of 10%+ annual increases.
• While foreclosure activity remains muted, foreclosure starts (+13%), sales (+9%), and active inventory (+4%) all rose on an annual basis for the second consecutive month.
• April’s 6,500 foreclosure sales marked the largest single-month volume in 15 months, with VA sales, which account for the bulk of the recent rise, hitting their highest level since 2019.
• Prepayment activity, measured in single month mortality, jumped to 0.71%, the highest level since October. This rise was driven by stronger home sale and refinance-related prepayments, which grew +19.0% over the previous month and +34.9% over the previous year.
emphasis added
 Click on graph for larger image.
Here is a table from ICE.
Thursday, May 22, 2025
Friday: New Home Sales
by Calculated Risk on 5/22/2025 08:17:00 PM
 Note: Mortgage rates are from MortgageNewsDaily.com and are for top tier scenarios.
Friday:
• At 10:00 AM ET, New Home Sales for April from the Census Bureau. The consensus is for 700 thousand SAAR, down from 724 thousand SAAR in March.
Realtor.com Reports Most Actively "For Sale" Inventory since 2019
by Calculated Risk on 5/22/2025 04:59:00 PM
What this means: On a weekly basis, Realtor.com reports the year-over-year change in active inventory and new listings. On a monthly basis, they report total inventory. For May, Realtor.com reported inventory was up 30.6% YoY, but still down 16.3% compared to the 2017 to 2019 same month levels.
Now - on a weekly basis - inventory is up 29.7% YoY.
Realtor.com has monthly and weekly data on the existing home market. Here is their weekly report: Weekly Housing Trends View—Data for Week Ending May 17, 2025 Here is a graph of the year-over-year change in inventory according to realtor.com.
Inventory was up year-over-year for the 80th consecutive week.
Realtor.com has monthly and weekly data on the existing home market. Here is their weekly report: Weekly Housing Trends View—Data for Week Ending May 17, 2025
• Active inventory climbed 29.7% year-over-year
The number of homes actively for sale remains on a strong upward trajectory, now 29.7% higher than this time last year. This represents the 80th consecutive week of annual gains in inventory. There were more than 1 million homes for sale last week, the highest inventory level since December 2019.
• New listings—a measure of sellers putting homes up for sale—rising 8.2% year-over-year
New listings rose again last week, up 8.2% compared to the same period last year.
• The median list price falls more than 1%
After nine consecutive weeks of flat or rising prices, the national median listing price fell year-over-year last week. Ongoing affordability challenges, along with growing concerns about personal finances and job security, continue to pose significant hurdles for many buyers. Nearly four in five home shoppers believe it’s a bad time to buy, which is dampening demand.
 Here is a graph of the year-over-year change in inventory according to realtor.com.
 Inventory was up year-over-year for the 80th consecutive week.
New listings were solid.
Median list prices declined year-over-year.
Hotels: Occupancy Rate Decreased 0.4% Year-over-year
by Calculated Risk on 5/22/2025 02:01:00 PM
The U.S. hotel industry reported mixed year-over-year comparisons, according to CoStar’s latest data through 17 May. ...The following graph shows the seasonal pattern for the hotel occupancy rate using the four-week average.
11-17 May 2025 (percentage change from comparable week in 2024):
• Occupancy: 67.2% (-0.4%)
• Average daily rate (ADR): US$166.31 (+1.3%)
• Revenue per available room (RevPAR): US$111.80 (+0.9%)
emphasis added
 Click on graph for larger image.
The red line is for 2025, blue is the median, and dashed light blue is for 2024. Dashed purple is for 2018, the record year for hotel occupancy.
The 4-week average of the occupancy rate is tracking slightly below last year and slightly above the median rate for the period 2000 through 2024 (Blue).
Note: Y-axis doesn't start at zero to better show the seasonal change.
The 4-week average will mostly move sideways for a few more weeks until the summer travel season. We will likely see a hit to occupancy during the summer months due to less international tourism.
Newsletter: NAR: Existing-Home Sales Decreased to 4.00 million SAAR in April; Down 2.0% YoY
by Calculated Risk on 5/22/2025 10:52:00 AM
Today, in the CalculatedRisk Real Estate Newsletter: NAR: Existing-Home Sales Decreased to 4.00 million SAAR in April; Down 2.0% YoY
Excerpt:
Sales in April (4.00 million SAAR) were down 0.5% from the previous month and were 2.0% below the April 2024 sales rate. This was the 3rd consecutive month with a year-over-year decline in sales.There is much more in the article.
...
Sales Year-over-Year and Not Seasonally Adjusted (NSA)
The fourth graph shows existing home sales by month for 2024 and 2025.
Sales decreased 2.0% year-over-year compared to April 2024.
...
On an NSA basis for the month of April, this was at the low for housing bust for the month of April that happened in April 2009. Year-to-date, sales are down 2.4% NSA.


