 RSS Feed
 by Calculated Risk on 4/30/2025 07:54:00 PM
Wednesday, April 30, 2025
Thursday: Unemployment Claims, ISM Mfg, Construction Spending, Vehicle Sales
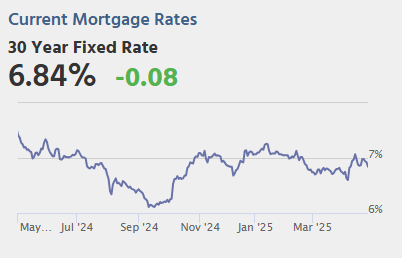
 Note: Mortgage rates are from MortgageNewsDaily.com and are for top tier scenarios.
Thursday:
• At 8:30 AM ET, The initial weekly unemployment claims report will be released. The consensus is for initial claims of 218 thousand, down from 222 thousand last week.
• At 10:00 AM ET, ISM Manufacturing Index for April. The consensus is for the ISM to be at 48.1, down from 49.0 in March.
• Also at 10:00 AM, Construction Spending for March. The consensus is for a 0.3% increase in construction spending.
• All day, Light vehicle sales for April. The consensus expectation is for light vehicle sales to be 16.8 million SAAR in April, down from 17.8 million in March (Seasonally Adjusted Annual Rate). The WardsAuto estimate is for sales of 17.4 million SAAR in April.
Freddie Mac House Price Index Mostly Unchanged in March; Up 3.0% Year-over-year
by Calculated Risk on 4/30/2025 12:45:00 PM
Today, in the Calculated Risk Real Estate Newsletter: Freddie Mac House Price Index Mostly Unchanged in March; Up 3.0% Year-over-year
A brief excerpt:
Freddie Mac reported that its “National” Home Price Index (FMHPI) increased 0.01% month-over-month on a seasonally adjusted (SA) basis in March. On a year-over-year basis, the National FMHPI was up 3.0% in March, down from up 3.4% YoY in February. The YoY increase peaked at 19.0% in July 2021, and for this cycle, bottomed at up 0.9% YoY in May 2023. ...There is much more in the article!
As of March, 25 states and D.C. were below their previous peaks, Seasonally Adjusted. The largest seasonally adjusted declines from the recent peaks are in D.C. (-4.9), Oregon (-1.6%), Arkansas (-1.6%), Delaware (-1.3%), Idaho (-1.2%) and Oklahoma (-1.2%).
For cities (Core-based Statistical Areas, CBSA), here are the 30 cities with the largest declines from the peak, seasonally adjusted. Austin continues to be the worst performing city. However, 10 of the 19 cities with the largest price declines are in Florida.

PCE Measure of Shelter Decreases Slightly to 4.3% YoY in March
by Calculated Risk on 4/30/2025 10:30:00 AM
Here is a graph of the year-over-year change in shelter from the CPI report and housing from the PCE report this morning, both through March 2025.
 CPI Shelter was up 4.0% year-over-year in March, down from 4.2% in February, and down from the cycle peak of 8.2% in March 2023.
Housing (PCE) was up 4.3% YoY in March, down slightly from 4.3% in February and down from the cycle peak of 8.3% in April 2023.
Since asking rents are mostly flat year-over-year, these measures will slowly continue to decline over the next year as rents for existing tenants continue to increase.
Since asking rents are mostly flat year-over-year, these measures will slowly continue to decline over the next year as rents for existing tenants continue to increase.
 The second graph shows PCE prices, Core PCE prices and Core ex-housing over the last 3 months (annualized):
Key measures are above the Fed's target on a 3-month basis.
3-month annualized change:
PCE Price Index: 3.1%
Core PCE Prices: 3.5%
Core minus Housing: 3.4%
Core PCE Prices: 3.5%
Core minus Housing: 3.4%
Note: It is likely there is still some residual seasonality distorting PCE prices in Q1.
Personal Income increased 0.5% in March; Spending increased 0.7%
by Calculated Risk on 4/30/2025 10:15:00 AM
The BEA released the Personal Income and Outlays report for March:
Personal income increased $116.8 billion (0.5 percent at a monthly rate) in March, according to estimates released today by the U.S. Bureau of Economic Analysis. Disposable personal income (DPI)—personal income less personal current taxes—increased $102.0 billion (0.5 percent) and personal consumption expenditures (PCE) increased $134.5 billion (0.7 percent).The March PCE price index increased 2.3 percent year-over-year (YoY), down from 2.7 percent YoY in February, and down from the recent peak of 7.2 percent in June 2022.
Personal outlays—the sum of PCE, personal interest payments, and personal current transfer payments—increased $136.6 billion in March. Personal saving was $872.3 billion in March and the personal saving rate—personal saving as a percentage of disposable personal income—was 3.9 percent.
From the preceding month, the PCE price index for March decreased less than 0.1 percent. Excluding food and energy, the PCE price index increased less than 0.1 percent.
From the same month one year ago, the PCE price index for March increased 2.3 percent. Excluding food and energy, the PCE price index increased 2.6 percent from one year ago.
emphasis added
The PCE price index, excluding food and energy, increased 2.6 percent YoY, down from 3.0 percent in January, and down from the recent peak of 5.6 percent in February 2022.
The following graph shows real Personal Consumption Expenditures (PCE) through March 2025 (2017 dollars). Note that the y-axis doesn't start at zero to better show the change.
 Click on graph for larger image.
The dashed red lines are the quarterly levels for real PCE.
Personal income and PCE were above expectations.
Inflation was below expectations.
NAR: Pending Home Sales Increase 6.1% in March; Down 0.6% YoY
by Calculated Risk on 4/30/2025 10:00:00 AM
From the NAR: Pending Home Sales Jumped 6.1% in March
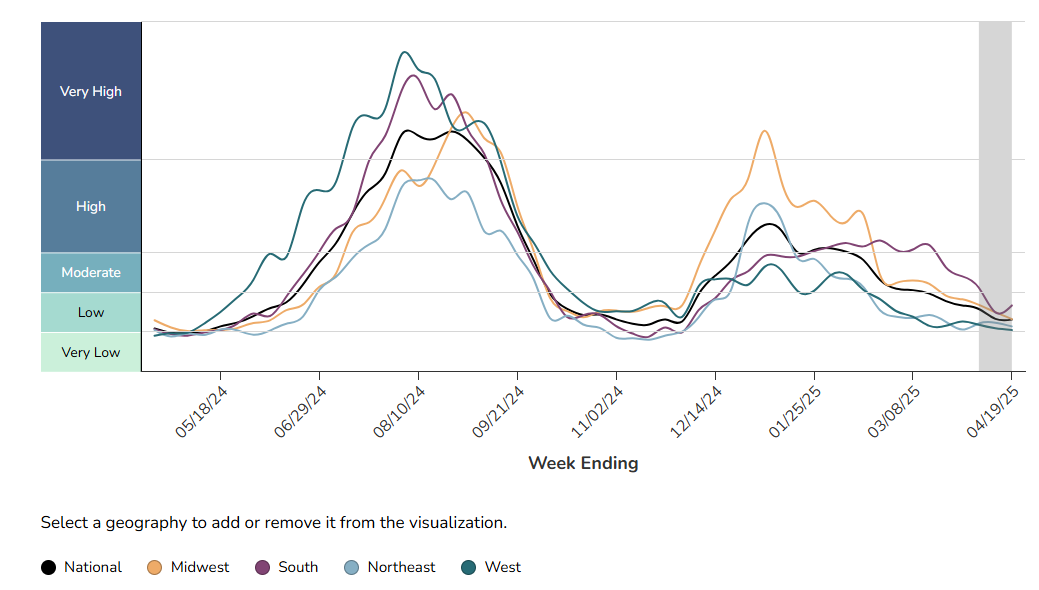
Pending home sales increased 6.1% in March – the greatest month-to-month increase since December 2023 (+7.0%) – according to the National Association of REALTORS®. The Northeast experienced month-over-month losses in transactions, while the Midwest, South and West saw gains, which were most substantial in the South. Year-over-year, contract signings grew in the Midwest but fell in the Northeast, South and West – with the Northeast undergoing the greatest decrease.Note: Contract signings usually lead sales by about 45 to 60 days, so this would usually be for closed sales in April and May.
The Pending Home Sales Index (PHSI)* – a forward-looking indicator of home sales based on contract signings – augmented 6.1% to 76.5 in March. Year-over-year, pending transactions lessened by 0.6%. An index of 100 is equal to the level of contract activity in 2001.
"Home buyers are acutely sensitive to even minor fluctuations in mortgage rates," said NAR Chief Economist Lawrence Yun. "While contract signings are not a guarantee of eventual closings, the solid rise in pending home sales implies a sizable build-up of potential home buyers, fueled by ongoing job growth."
...
The Northeast PHSI dropped 0.5% from last month to 62.5, down 3.0% from March 2024. The Midwest index expanded 4.9% to 77.7 in March, up 1.4% from the previous year.
The South PHSI soared 9.8% to 94.1 in March, down 0.4% from a year ago. The West index climbed 4.8% from the prior month to 58.6, down 2.0% from March 2024.
emphasis added
BEA: Real GDP decreased at 0.3% Annualized Rate in Q1
by Calculated Risk on 4/30/2025 08:30:00 AM
From the BEA: Gross Domestic Product, 1st Quarter 2025 (Advance Estimate)
Real gross domestic product (GDP) decreased at an annual rate of 0.3 percent in the first quarter of 2025 (January, February, and March), according to the advance estimate released by the U.S. Bureau of Economic Analysis. In the fourth quarter of 2024, real GDP increased 2.4 percent.PCE increased at a 1.8% annual rate, and residential investment increased at a 1.3% rate. The advance Q1 GDP report, with 0.3% annualized decrease, was below expectations.
The decrease in real GDP in the first quarter primarily reflected an increase in imports, which are a subtraction in the calculation of GDP, and a decrease in government spending. These movements were partly offset by increases in investment, consumer spending, and exports. ...
Compared to the fourth quarter, the downturn in real GDP in the first quarter reflected an upturn in imports, a deceleration in consumer spending, and a downturn in government spending that were partly offset by upturns in investment and exports.
Real final sales to private domestic purchasers, the sum of consumer spending and gross private fixed investment, increased 3.0 percent in the first quarter, compared with an increase of 2.9 percent in the fourth quarter.
The price index for gross domestic purchases increased 3.4 percent in the first quarter, compared with an increase of 2.2 percent in the fourth quarter. The personal consumption expenditures (PCE) price index increased 3.6 percent, compared with an increase of 2.4 percent. Excluding food and energy prices, the PCE price index increased 3.5 percent, compared with an increase of 2.6 percent.
emphasis added
I'll have more later ...
ADP: Private Employment Increased 62,000 in April
by Calculated Risk on 4/30/2025 08:15:00 AM
“Unease is the word of the day. Employers are trying to reconcile policy and consumer uncertainty with a run of mostly positive economic data,” said Dr. Nela Richardson, chief economist, ADP. “It can be difficult to make hiring decisions in such an environment.”This was well below the consensus forecast of 130,000. The BLS report will be released Friday, and the consensus is for 130,000 non-farm payroll jobs added in April.
emphasis added
MBA: Mortgage Applications Decrease in Latest MBA Weekly Survey
by Calculated Risk on 4/30/2025 07:00:00 AM
From the MBA: Mortgage Applications Decrease in Latest MBA Weekly Survey
Mortgage applications decreased 4.2 percent from one week earlier, according to data from the Mortgage Bankers Association’s (MBA) Weekly Mortgage Applications Survey for the week ending April 25, 2025.
The Market Composite Index, a measure of mortgage loan application volume, decreased 4.2 percent on a seasonally adjusted basis from one week earlier. On an unadjusted basis, the Index decreased 4 percent compared with the previous week. The Refinance Index decreased 4 percent from the previous week and was 42 percent higher than the same week one year ago. The seasonally adjusted Purchase Index decreased 4 percent from one week earlier. The unadjusted Purchase Index decreased 3 percent compared with the previous week and was 3 percent higher than the same week one year ago.
“Mortgage rates were little changed last week with the 30-year fixed rate at 6.89 percent. Mortgage application activity, particularly for home purchases, continues to be subdued by broader economic uncertainty and signs of labor market weakness, dropping to the slowest pace since February,” said Joel Kan, MBA’s Vice President and Deputy Chief Economist. “Even with the spring homebuying season underway, purchase applications decreased, as conventional and VA applications saw declines of 6 percent and 4 percent, respectively. With slowly-increasing housing inventory in many markets and first time homebuyers still in the mix, FHA purchase applications fared better with only a slight decline. Overall purchase applications continued to run ahead of last year’s pace.
Added Kan, “Refinance activity dipped again, as mortgage rates remained close to 7 percent, and borrowers hold out for a bigger decline in rates. Given the pullback in refinancing, the average loan size for refinances declined to just under $290,000, the lowest level in three months.”
...
The average contract interest rate for 30-year fixed-rate mortgages with conforming loan balances ($806,500 or less) decreased to 6.89 percent from 6.90 percent, with points increasing to 0.67 from 0.66 (including the origination fee) for 80 percent loan-to-value ratio (LTV) loans.
emphasis added
 Click on graph for larger image.
The first graph shows the MBA mortgage purchase index.
According to the MBA, purchase activity is up 3% year-over-year unadjusted.
Red is a four-week average (blue is weekly).
Purchase application activity is up from the lows in late October 2023 but is 3% below the lowest levels during the housing bust.

The second graph shows the refinance index since 1990.
The refinance index decreased and remained very low.
Tuesday, April 29, 2025
Wednesday: GDP, Personal Income and Outlays, Pending Home Sales
by Calculated Risk on 4/29/2025 07:11:00 PM
 Note: Mortgage rates are from MortgageNewsDaily.com and are for top tier scenarios.
Wednesday:
• At 7:00 AM ET, The Mortgage Bankers Association (MBA) will release the results for the mortgage purchase applications index.
• At 8:15 AM, The ADP Employment Report for April. This report is for private payrolls only (no government). The consensus is for 130,000 payroll jobs added in April, down from 155,000 added in March.
• At 8:30 AM, Gross Domestic Product, 1st quarter 2025 (Advance estimate). The consensus is that real GDP increased 0.4% annualized in Q1, down from 2.4% in Q4.
9:45 AM, Chicago Purchasing Managers Index for April. The consensus is for a reading of 45.5, down from 47.6 in March.
• At 10:00 AM, Personal Income and Outlays, March 2025. The consensus is for a 0.4% increase in personal income, and for a 0.6% increase in personal spending. And for the Core PCE price index to increase 0.1%. PCE prices are expected to be up 2.6% YoY, and core PCE prices up 2.2% YoY.
• Also at 10:00 AM, Pending Home Sales Index for March. The consensus is for a 1.0% increase in the index.
Las Vegas in March: Visitor Traffic Down 7.8% YoY; Convention Traffic Up 10.2% YoY
by Calculated Risk on 4/29/2025 03:32:00 PM
From the Las Vegas Visitor Authority: March 2025 Las Vegas Visitor Statistics
With a slightly less‐packed event calendar and as‐yet unclear impacts of evolving federal policies rippling thru international and domestic markets, visitation saw a ‐7.8% YoY decline as the destination hosted approximately 3.39 million visitors in March.
Rotation cycles helped convention attendance in March as the destination hosted roughly 534k attendees for the month, up 10.2% YoY, reflecting in part the calendar impact of the in‐rotation of the Healthcare Information & Management Systems Society conference (48k attendees) which was held elsewhere last year.
Occupancy reached 82.9%, down ‐2.4 pts with Weekend occupancy of 90.8% (down ‐1.0 pts) and Midweek occupancy of 79.7% (down ‐2.5 pts). ADR for the month reached $184 (+3.1% YoY) with RevPAR of $152 (+0.2% YoY).
emphasis added
 Click on graph for larger image.
 The first graph shows visitor traffic for 2019 (Black), 2020 (dark blue), 2021 (light blue), 2022 (light orange), 2023 (orange), 2024 (dark orange) and 2025 (red).
Visitor traffic was down 7.8% compared to last March. Visitor traffic was down 8.4% compared to March 2019.
Year-to-date (YTD) visitor traffic is down 10.4% compared to the same period in 2019.
 Convention traffic was up 10.2% compared to March 2024, and down 17.8% compared to March 2019.
The second graph shows convention traffic.

YTD convention traffic is down 5.8% compared to 2019.
"Inside the Auto Tariff Battle: What Washington Is Not Saying Out Loud"
by Calculated Risk on 4/29/2025 01:28:00 PM
This substack is from a auto industry insider: Inside the Auto Tariff Battle: What Washington Is Not Saying Out Loud
A friend of mine who lives in the thick of Washington called me this week. What he said made me sit up straight.CR Note: From ABC News this morning: Trump to ease tariffs faced by US automakers
The news is spinning a safe version of what is happening.
They are missing the real pulse.
Right now, April 2025, the Trump administration has dropped a hammer.
...
Some midsize SUVs and pickup trucks are quietly getting new sticker prices.
The big jump is expected by June.
Most insiders are whispering five to fifteen percent increases depending on the model.
Some high-volume imports could climb even higher.
President Donald Trump is set to provide tariff relief for carmakers on Tuesday, just weeks after the onset of auto levies triggered warnings of price increases.
An administration official confirmed that the 25% tariff on finished foreign-made cars and parts will remain -- but today's announcement will prevent tariffs from stacking on top of other tariffs he's imposed, such as duties on steel and aluminum.
Trump's 25% tariff on foreign auto parts goes into effect on Saturday and automakers will also be reimbursed for those tariffs up to an amount equal to 3.75% of the value of a U.S.-made car for one year. Reimbursement would fall to 2.5% of the car's value in a second year, and then completely phased out altogether.
emphasis added
BLS: Job Openings Decreased to 7.2 million in March
by Calculated Risk on 4/29/2025 10:00:00 AM
From the BLS: Job Openings and Labor Turnover Summary
The number of job openings was little changed at 7.2 million in March, the U.S. Bureau of Labor Statistics reported today. Over the month, hires held at 5.4 million, and total separations changed little at 5.1 million. Within separations, quits (3.3 million) were unchanged and layoffs and discharges (1.6 million) edged down.The following graph shows job openings (black line), hires (dark blue), Layoff, Discharges and other (red column), and Quits (light blue column) from the JOLTS.
emphasis added
This series started in December 2000.
Note: The difference between JOLTS hires and separations is similar to the CES (payroll survey) net jobs headline numbers. This report is for March; the employment report this Friday will be for April.
 Click on graph for larger image.
Note that hires (dark blue) and total separations (red and light blue columns stacked) are usually pretty close each month. This is a measure of labor market turnover. When the blue line is above the two stacked columns, the economy is adding net jobs - when it is below the columns, the economy is losing jobs.
The spike in layoffs and discharges in March 2020 is labeled, but off the chart to better show the usual data.
Jobs openings decreased in March to 7.19 million from 7.48 million in February.
The number of job openings (black) were down 11% year-over-year.
Quits were unchanged year-over-year. These are voluntary separations. (See light blue columns at bottom of graph for trend for "quits").
Newsletter: Case-Shiller: National House Price Index Up 3.9% year-over-year in February
by Calculated Risk on 4/29/2025 09:51:00 AM
Today, in the Calculated Risk Real Estate Newsletter: Case-Shiller: National House Price Index Up 3.9% year-over-year in February
Excerpt:
S&P/Case-Shiller released the monthly Home Price Indices for February ("February" is a 3-month average of December, January and February closing prices). January closing prices include some contracts signed in October, so there is a significant lag to this data. Here is a graph of the month-over-month (MoM) change in the Case-Shiller National Index Seasonally Adjusted (SA).There is much more in the article.
The MoM increase in the seasonally adjusted (SA) Case-Shiller National Index was at 0.26% (a 3.1% annual rate), This was the 25th consecutive MoM increase in the seasonally adjusted index.
On a seasonally adjusted basis, prices increased month-to-month in 14 of the 20 Case-Shiller cities. San Francisco has fallen 4.9% from the recent peak, Tampa is down 1.6% from the peak, and Denver down 1.1%.

Case-Shiller: National House Price Index Up 3.9% year-over-year in February
by Calculated Risk on 4/29/2025 09:00:00 AM
S&P/Case-Shiller released the monthly Home Price Indices for February ("February" is a 3-month average of December, January and February closing prices).
This release includes prices for 20 individual cities, two composite indices (for 10 cities and 20 cities) and the monthly National index.
From S&P S&P CoreLogic Case-Shiller Index Records 3.9% Annual Gain in February 2025
The S&P CoreLogic Case-Shiller U.S. National Home Price NSA Index, covering all nine U.S. census divisions, reported a 3.9% annual return for February, down from a 4.1% annual gain in the previous month. The 10-City Composite saw an annual increase of 5.2%, down from a 5.4% annual increase in the previous month. The 20-City Composite posted a year-over-year increase of 4.5%, down from a 4.7% increase in the previous month. New York again reported the highest annual gain among the 20 cities with a 7.7% increase in February, followed by Chicago and Cleveland with annual increases of 7.0% and 6.6%, respectively. Tampa posted the lowest return, falling 1.5%.
...
The pre-seasonally adjusted U.S. National, 10-City Composite, and 20-City Composite Indices presented slight upward trends in February, posting 0.4%, 0.8%, and 0.7% respectively.
After seasonal adjustment, the 10-City and 20-City Composite Indices posted month-over-month increases of 0.5% and 0.4%. The U.S. National Composite Index posted a month-over-month increase of 0.3%.
“Even with mortgage rates remaining in the mid-6% range and affordability challenges lingering, home prices have shown notable resilience,” said Nicholas Godec, CFA, CAIA, CIPM, Head of Fixed Income Tradables & Commodities at S&P Dow Jones Indices. “Buyer demand has certainly cooled compared to the frenzied pace of prior years, but limited housing supply continues to underpin prices in most markets. Rather than broad declines, we are seeing a slower, more sustainable pace of price growth.”
emphasis added
 Click on graph for larger image.
 The first graph shows the nominal seasonally adjusted Composite 10, Composite 20 and National indices (the Composite 20 was started in January 2000).
The Composite 10 index was up 0.5% in February (SA). The Composite 20 index was up 0.4% (SA) in February.
The National index was up 0.3% (SA) in February.
 The second graph shows the year-over-year change in all three indices.
The Composite 10 NSA was up 5.2% year-over-year. The Composite 20 NSA was up 4.5% year-over-year.
The National index NSA was up 3.9% year-over-year.
Annual price changes were lower than expectations. I'll have more later.
Monday, April 28, 2025
Tuesday: Case-Shiller House Prices, Job Openings
by Calculated Risk on 4/28/2025 07:15:00 PM
 From Matthew Graham at Mortgage News Daily: Mortgage Rates Start New Week Slightly Lower
Mortgage rates ended last week at the lowest levels since April 7th. The average lender remained at those same levels at the start of business today, but many lenders offered modest improvements as the day progressed.Tuesday:
...
As the week continues, there will be more and more scheduled events with the power to cause intraday volatility and even to impact the longer-term trend. As for that trend, it is arguably flat at the moment after experiencing significant volatility for most of the month of April. [30 year fixed 6.82%]
emphasis added
• At 9:00 AM ET, S&P/Case-Shiller House Price Index for February. The consensus is for a 4.8% year-over-year increase in the Comp 20 index for February, up from 4.7% YoY.
• Also at 9:00 AM, FHFA House Price Index for February. This was originally a GSE only repeat sales, however there is also an expanded index.
• At 10:00 AM, Job Openings and Labor Turnover Survey for March from the BLS.
Final Look at Local Housing Markets in March and a Look Ahead to April Sales
by Calculated Risk on 4/28/2025 11:26:00 AM
Today, in the Calculated Risk Real Estate Newsletter: Final Look at Local Housing Markets in March and a Look Ahead to April Sales
A brief excerpt:
After the National Association of Realtors® (NAR) releases the monthly existing home sales report, I pick up additional local market data that is reported after the NAR. This is the final look at local markets in March.There is much more in the article.
The big story for March was that existing home sales decreased year-over-year (YoY) for the 2nd consecutive month following four consecutive months with a year-over-year increase. Sales at 4.02 million on a Seasonally Adjusted Annual Rate (SAAR) basis were below the consensus estimate; however, housing economist Tom Lawler’s estimate was very close (as usual).
Sales averaged close to 5.5 million SAAR for the month of March in the 2017-2019 period. So, sales are still about 27% below pre-pandemic levels.
Also, months-of-supply for March was above pre-pandemic levels for the period 2017-2019.
...
Here is a look at months-of-supply using NSA sales. Since this is NSA data, it is likely months-of-supply will increase into the Summer.
Months in red will likely see 6+ months of supply this summer and might see price pressures. There is nothing magical about 6 months; some areas see price declines with less inventory, some more.
Note: This month, for months-of-supply, I broke out Miami (Miami-Dade) from the “Miami Area” this also includes Broward County and Palm Beach.
...
More local data coming in May for activity in April!

HVS: Q1 2025 Homeownership and Vacancy Rates
by Calculated Risk on 4/28/2025 10:00:00 AM
The Census Bureau released the Residential Vacancies and Homeownership report for Q1 2025 today.
The results of this survey were significantly distorted by the pandemic in 2020.
This report is frequently mentioned by analysts and the media to track household formation, the homeownership rate, and the homeowner and rental vacancy rates. However, there are serious questions about the accuracy of this survey.
This survey might show the trend, but I wouldn't rely on the absolute numbers. Analysts probably shouldn't use the HVS to estimate the excess vacant supply or household formation, or rely on the homeownership rate, except as a guide to the trend.
National vacancy rates in the first quarter 2025 were 7.1 percent for rental housing and 1.1 percent for homeowner housing. The rental vacancy rate was higher than the rate in the first quarter 2024 (6.6 percent) and not statistically different from the rate in the fourth quarter 2024 (6.9 percent).
The homeowner vacancy rate of 1.1 percent was higher than the rate in the first quarter 2024 (0.8 percent) and virtually the same as the rate in the fourth quarter 2024 (1.1 percent).
The homeownership rate of 65.1 percent was not statistically different from the rate in the first quarter 2024 (65.6 percent) and lower than the rate in the fourth quarter 2024 (65.7 percent).
emphasis added
 Click on graph for larger image.
The Red dots are the decennial Census homeownership rates for April 1st, 1990, 2000, 2010, and 2020.
The HVS homeownership rate was decreased to 65.1% in Q1, from 65.7% in Q4.
The HVS homeownership rate was decreased to 65.1% in Q1, from 65.7% in Q4.
The results in Q2 and Q3 2020 were distorted by the pandemic and should be ignored.
 The HVS homeowner vacancy was unchanged at 1.1% in Q1 from 1.1% in Q4.
 The homeowner vacancy rate declined sharply during the pandemic and includes homes that are vacant and for sale (so this mirrors the low but increasing levels of existing home inventory).
Once again - this probably shows the general trend, but I wouldn't rely on the absolute numbers.
 The rental vacancy rate increased to 7.1% in Q1 from 6.9% in Q4. This is up from the low of 5.6% in 2021 and 2022 and at the highest level since 2018.
The quarterly HVS is the timeliest survey on households, but there are many questions about the accuracy of this survey.
Housing April 28th Weekly Update: Inventory up 1.3% Week-over-week, Up 31.0% Year-over-year
by Calculated Risk on 4/28/2025 08:14:00 AM
Altos reports that active single-family inventory was up 1.3% week-over-week.
Inventory is now up 16.7% from the seasonal bottom in January and is increasing.
Usually, inventory is up about 9% from the seasonal low by this week in the year. So, 2025 is seeing a larger than normal pickup in inventory.
The first graph shows the seasonal pattern for active single-family inventory since 2015.
 Click on graph for larger image.
The red line is for 2025. The black line is for 2019.
Inventory was up 31.0% compared to the same week in 2024 (last week it was up 32.6%), and down 16.1% compared to the same week in 2019 (last week it was down 16.7%).
Inventory will likely pass 2020 same week levels next week and also be close to the peak for 2024.
It now appears inventory will be close to 2019 levels towards the end of 2025.
 This second inventory graph is courtesy of Altos Research.
As of April 25th, inventory was at 729 thousand (7-day average), compared to 719 thousand the prior week.
Mike Simonsen discusses this data regularly on Youtube
Sunday, April 27, 2025
Monday: Housing Vacancies and Homeownership, Dallas Fed Mfg
by Calculated Risk on 4/27/2025 06:17:00 PM
Weekend:
• Schedule for Week of April 27, 2025
Monday:
• At 10:00 AM ET, the Q1 2025 Housing Vacancies and Homeownership from the Census Bureau.
• At 10:30 AM, Dallas Fed Survey of Manufacturing Activity for April.
From CNBC: Pre-Market Data and Bloomberg futures S&P 500 are down 12 and DOW futures are down 75 (fair value).
Oil prices were up over the last week with WTI futures at $63.02 per barrel and Brent at $66.87 per barrel. A year ago, WTI was at $85, and Brent was at $90 - so WTI oil prices are down about 26% year-over-year.
Here is a graph from Gasbuddy.com for nationwide gasoline prices. Nationally prices are at $3.12 per gallon. A year ago, prices were at $3.66 per gallon, so gasoline prices are down $0.54 year-over-year.
Update: Lumber Prices Up 11% YoY
by Calculated Risk on 4/27/2025 08:47:00 AM
This is something to watch again. Here is another monthly update on lumber prices.
SPECIAL NOTE: The CME group discontinued the Random Length Lumber Futures contract on May 16, 2023. I switched to a physically-delivered Lumber Futures contract that was started in August 2022. Unfortunately, this impacts long term price comparisons since the new contract was priced about 24% higher than the old random length contract for the period when both contracts were available.
This graph shows CME random length framing futures through August 2022 (blue), and the new physically-delivered Lumber Futures (LBR) contract starting in August 2022 (Red).
On April 25, 2025, LBR was at $573.00 per 1,000 board feet, up 11% from a year ago.
 Click on graph for larger image.
There is somewhat of a seasonal demand for lumber, and lumber prices frequently peak in the first half of the year.
Last year, prices bottomed in July at $449.00 per 1,000 board feet.
The recent year-over-year increase might be due to the tariffs.
Saturday, April 26, 2025
Real Estate Newsletter Articles this Week: Existing-Home Sales Decreased to 4.02 million SAAR in March; Down 2.4% YoY
by Calculated Risk on 4/26/2025 02:11:00 PM
At the Calculated Risk Real Estate Newsletter this week:
 Click on graph for larger image.
• NAR: Existing-Home Sales Decreased to 4.02 million SAAR in March; Down 2.4% YoY
• New Home Sales Increase to 724,000 Annual Rate in March
• NMHC on Apartments: Market conditions Tightened in Q1 pre-Tariffs
• Lawler: Early Read on Existing Home Sales in March
• California Home Sales Up 4.9% YoY in March; 4th Look at Local Housing Markets
This is usually published 4 to 6 times a week and provides more in-depth analysis of the housing market.
Schedule for Week of April 27, 2025
by Calculated Risk on 4/26/2025 08:11:00 AM
The key report scheduled for this week is the April employment report.
Other key reports include the advance estimate of Q1 GDP, March Personal Income and Outlays, February Case-Shiller house prices, and April vehicle sales.
For manufacturing, the April Dallas Fed manufacturing survey, and the ISM index will be released.
10:00 AM: the Q1 2025 Housing Vacancies and Homeownership from the Census Bureau.
10:30 AM: Dallas Fed Survey of Manufacturing Activity for April.
 9:00 AM: S&P/Case-Shiller House Price Index for February.
This graph shows the nominal seasonally adjusted National Index, Composite 10 and Composite 20 indexes through the most recent report (the Composite 20 was started in January 2000).
The consensus is for a 4.8% year-over-year increase in the Comp 20 index for February, up from 4.7% YoY.
9:00 AM: FHFA House Price Index for February. This was originally a GSE only repeat sales, however there is also an expanded index.
 10:00 AM ET: Job Openings and Labor Turnover Survey for March from the BLS.
 This graph shows job openings (black line), hires (dark blue), Layoff, Discharges and other (red column), and Quits (light blue column) from the JOLTS.
Jobs openings decreased in February to 7.57 million from 7.76 million in January.
The number of job openings (black) were down 10% year-over-year.
7:00 AM ET: The Mortgage Bankers Association (MBA) will release the results for the mortgage purchase applications index.
8:15 AM: The ADP Employment Report for April. This report is for private payrolls only (no government). The consensus is for 130,000 payroll jobs added in April, down from 155,000 added in March.
8:30 AM: Gross Domestic Product, 1st quarter 2025 (Advance estimate). The consensus is that real GDP increased 0.4% annualized in Q1, down from 2.4% in Q4.
9:45 AM: Chicago Purchasing Managers Index for April. The consensus is for a reading of 45.5, down from 47.6 in March.
10:00 AM: Personal Income and Outlays, March 2025. The consensus is for a 0.4% increase in personal income, and for a 0.6% increase in personal spending. And for the Core PCE price index to increase 0.1%. PCE prices are expected to be up 2.6% YoY, and core PCE prices up 2.2% YoY.
10:00 AM: Pending Home Sales Index for March. The consensus is for a 1.0% increase in the index.
8:30 AM: The initial weekly unemployment claims report will be released. The consensus is for initial claims of 218 thousand, down from 222 thousand last week.
10:00 AM ET: ISM Manufacturing Index for April. The consensus is for the ISM to be at 48.1, down from 49.0 in March.
10:00 AM: Construction Spending for March. The consensus is for a 0.3% increase in construction spending.
 All day: Light vehicle sales for April. The consensus expectation is for light vehicle sales to be 16.8 million SAAR in April, down from 17.8 million in March (Seasonally Adjusted Annual Rate).
This graph shows light vehicle sales since the BEA started keeping data in 1967. The dashed line is the sales rate for the previous month.
The WardsAuto estimate is for sales of 17.4 million SAAR in April.
 8:30 AM: Employment Report for April. The consensus is for 130,000 jobs added, and for the unemployment rate to be unchanged at 4.2%.
There were 228,000 jobs added in March, and the unemployment rate was at 4.2%.
This graph shows the jobs added per month since January 2021.
Friday, April 25, 2025
April 25th COVID Update: COVID Deaths Continue to Decline
by Calculated Risk on 4/25/2025 06:55:00 PM
 Note: Mortgage rates are from MortgageNewsDaily.com and are for top tier scenarios.
For deaths, I'm currently using 4 weeks ago for "now", since the most recent three weeks will be revised significantly.
Note: "Effective May 1, 2024, hospitals are no longer required to report COVID-19 hospital admissions, hospital capacity, or hospital occupancy data." So, I'm no longer tracking hospitalizations.
| COVID Metrics | ||||
|---|---|---|---|---|
| Now | Week Ago | Goal | ||
| Deaths per Week | 442 | 444 | ≤3501 | |
| 1my goals to stop weekly posts. 🚩 Increasing number weekly for Deaths. ✅ Goal met. | ||||
 Click on graph for larger image.
This graph shows the weekly (columns) number of deaths reported since Jan 2023.
Although weekly deaths met the original goal to stop posting in June 2023 (low of 314 deaths), I've continued to post since deaths are above the goal again - and I'll continue to post until weekly deaths are once again below the goal.
Weekly deaths are now decreasing following the winter pickup and are heading towards the lows of last June.
 This appears to be a leading indicator for COVID hospitalizations and deaths. This has been moving down.
Nationally COVID in wastewater is "Low".
Philly Fed: State Coincident Indexes Increased in 43 States in March (3-Month Basis)
by Calculated Risk on 4/25/2025 03:53:00 PM
From the Philly Fed:
The Federal Reserve Bank of Philadelphia has released the coincident indexes for the 50 states for March 2025. Over the past three months, the indexes increased in 43 states, decreased in four states, and remained stable in three, for a three-month diffusion index of 78. Additionally, in the past month, the indexes increased in 39 states, decreased in seven states, and remained stable in four, for a one-month diffusion index of 64. For comparison purposes, the Philadelphia Fed has also developed a similar coincident index for the entire United States. The Philadelphia Fed’s U.S. index increased 0.6 percent over the past three months and 0.2 percent in March.Note: These are coincident indexes constructed from state employment data. An explanation from the Philly Fed:
emphasis added
The coincident indexes combine four state-level indicators to summarize current economic conditions in a single statistic. The four state-level variables in each coincident index are nonfarm payroll employment, average hours worked in manufacturing by production workers, the unemployment rate, and wage and salary disbursements deflated by the consumer price index (U.S. city average). The trend for each state’s index is set to the trend of its gross domestic product (GDP), so long-term growth in the state’s index matches long-term growth in its GDP.
 Click on map for larger image.
Here is a map of the three-month change in the Philly Fed state coincident indicators. This map was all red during the worst of the Pandemic and also at the worst of the Great Recession.
The map is mostly positive on a three-month basis.
Source: Philly Fed.
 And here is a graph is of the number of states with one month increasing activity according to the Philly Fed.
 This graph includes states with minor increases (the Philly Fed lists as unchanged).
In March, 41 states had increasing activity including minor increases.
In March, 41 states had increasing activity including minor increases.
The Normal Seasonal Pattern for Median House Prices
by Calculated Risk on 4/25/2025 01:00:00 PM
Yesterday, in the CalculatedRisk Real Estate Newsletter on March existing home sales, NAR: Existing-Home Sales Decreased to 4.02 million SAAR in March; Down 2.4% YoY, I noted:
On a month-over-month basis, median prices increased 1.7% from February and are now down 5.4% from the June 2024 peak. This is less than the normal seasonal increase in the median price for March. Typically, the NAR median price increases in the Spring, and tends to peak seasonally in the June report.Seasonally, median prices typically peak in June (closed sales are mostly for contracts signed in April and May).
And seasonally, prices usually bottom the following January (contracts signed in November and December).
Here is a table of the seasonal percentage increases from January to March, and from January to June (the usual seasonal peak), over the last several years.
The last row shows the seasonal decline from June to January of the following year.
In 2020, prices continued to increase in the 2nd half of the year and didn't peak seasonally until October. And prices only declined slightly in the 2nd half of 2021.
| 2018 | 2019 | 2020 | 2021 | 2022 | 2023 | 2024 | 2025 | |
|---|---|---|---|---|---|---|---|---|
| Jan to Mar | 3.7% | 4.1% | 5.4% | 7.5% | 7.1% | 4.0% | 3.8% | 2.6% |
| Mar to Jun | 9.6% | 9.9% | 4.9% | 12.4% | 9.1% | 9.3% | 8.7% | NA |
| Jan to Jun | 13.7% | 14.4% | 10.6% | 20.8% | 16.8% | 13.7% | 12.8% | NA |
| Jun to Jan | -8.9% | -6.7% | 3.1% | -3.4% | -12.8% | -7.7% | -7.8% | NA |
The 2025 increase in median prices from January to March was less than the normal seasonal increase.
Normally we'd expect median prices to increase about 9% to 10% over the next three months, before declining in the 2nd half of the year. With more and more inventory, and economic uncertainty, the seasonal increase from March to June will probably be less than 9% this year.
Q1 GDP Tracking: No Growth
by Calculated Risk on 4/25/2025 10:13:00 AM
The advance estimate of Q1 GDP is scheduled to be released on Wednesday, April 30th. The consensus is for a 0.2% increase in real GDP, quarter-over-quarter annualized - or essentially no growth in Q1.
From BofA:
We expect 1Q advance GDP to print at a weak 0.4% q/q saar, largely on the back of an import surge driven by front loading ahead of the tariffs. We look for a rise in 1Q inventory accumulation as well, but not enough to offset higher imports. The risks to our inventory tracking and 1Q GDP print are to the downside, since inventories are susceptible to measurement issues. [Apr 17th estimate]From Goldman:
emphasis added
we lowered our Q1 GDP tracking estimate by 0.3pp to -0.2% (quarter-over-quarter annualized). [Apr 24th estimate]And from the Atlanta Fed: GDPNow

The GDPNow model estimate for real GDP growth (seasonally adjusted annual rate) in the first quarter of 2025 is -2.5 percent on April 24, down from -2.2 percent on April 17. The alternative model forecast, which adjusts for imports and exports of gold as described here, is -0.4 percent. After recent releases from the US Census Bureau and the National Association of Realtors, both the standard model’s and the alternative model’s nowcasts of first-quarter real gross private domestic investment growth decreased from 8.9 percent to 7.1 percent. [Apr 24th estimate]
Intercontinental Exchange: Mortgage Delinquency Rate Increased in March
by Calculated Risk on 4/25/2025 08:11:00 AM
Intercontinental Exchange, Inc. (NYSE:ICE) ... today released its March 2025 First Look, which reveals that while delinquency rates edged up slightly year over year (YoY), they remain below pre-pandemic levels.
The ICE First Look reports on month-end delinquency, foreclosure and prepayment statistics sourced from its loan-level database, which covers a majority of the U.S. mortgage market.
Key takeaways from this month’s findings include:
• While serious delinquencies (SDQs) also improved seasonally, they are up 14% (+60K) YoY, with the rise driven entirely by FHA delinquencies, which increased by +63K YoY.
• Higher SDQs, along with the lifting of a VA foreclosure moratorium, fueled a modest bump in foreclosure inventory and sales, which both rose annually for the first time in nearly two years.
• Disaster events, such as hurricanes and wildfires, have led to YoY delinquency increases across several states, including Florida (+44 bps), South Carolina (+17 bps), Georgia (+14 bps) and California (+10 bps).
• Monthly prepayment activity, measured by single-month mortality, jumped to 0.59% – a +30.4% increase over February and the highest level of prepayment activity since November.
emphasis added
 Click on graph for larger image.
Here is a table from ICE.
Thursday, April 24, 2025
Friday: Consumer Sentiment
by Calculated Risk on 4/24/2025 08:46:00 PM
 Note: Mortgage rates are from MortgageNewsDaily.com and are for top tier scenarios.
Friday:
• AT 10:00 AM ET, University of Michigan's Consumer sentiment index (Final for April). The consensus is for a reading of 50.8.
Realtor.com Reports Active Inventory Up 30.0% YoY
by Calculated Risk on 4/24/2025 04:48:00 PM
What this means: On a weekly basis, Realtor.com reports the year-over-year change in active inventory and new listings. On a monthly basis, they report total inventory. For March, Realtor.com reported inventory was up 28.5% YoY, but still down 20.2% compared to the 2017 to 2019 same month levels.
Now - on a weekly basis - inventory is up 30.0% YoY.
Realtor.com has monthly and weekly data on the existing home market. Here is their weekly report: Weekly Housing Trends View—Data for Week Ending April 19, 2025 Here is a graph of the year-over-year change in inventory according to realtor.com.
Inventory was up year-over-year for the 76th consecutive week.
Realtor.com has monthly and weekly data on the existing home market. Here is their weekly report: Weekly Housing Trends View—Data for Week Ending April 19, 2025
• Active inventory climbed 30.0% from a year ago
The number of homes actively for sale remains significantly higher than last year, continuing a 76-week streak of annual gains.
• New listings—a measure of sellers putting homes up for sale—fell this week due to the Easter holiday, by 1.6% from a year ago
After 14 consecutive weeks of growth, the number of newly listed homes has dipped below last year’s level. However, this decline is largely attributed to the timing of the Easter holiday, which fell later this year than last. Looking ahead, we expect new listings to rebound in the coming week—a typical pattern that follows the end of a holiday. In fact, the recent momentum in listings made this March the most active March for new inventory in three years.
• The median list price was up 0.6% year-over-year
The national median list price rose by 0.6% year-over-year, marking the first notable price increase after a stretch of declining or flat trends since last June. While this uptick may signal a warming trend at the national level, local markets may tell a different story. In areas where home shoppers rely on stock market funds for down payments, ongoing uncertainty and volatility in the financial market could tighten buyer budgets, dampen demand, and potentially put downward pressure on prices.
 Here is a graph of the year-over-year change in inventory according to realtor.com.
 Inventory was up year-over-year for the 76th consecutive week.
New listings have generally increased but remain below typical pre-pandemic levels.
Median list prices are up slightly year-over-year.
Hotels: Occupancy Rate Decreased 8.1% Year-over-year due to Easter Timing
by Calculated Risk on 4/24/2025 01:55:00 PM
As expected due to the Easter and Passover holidays, the U.S. hotel industry reported negative year-over-year comparisons, according to CoStar’s latest data through 19 April. ...The following graph shows the seasonal pattern for the hotel occupancy rate using the four-week average.
13-19 April 2025 (percentage change from comparable week in 2024):
• Occupancy: 61.4% (-8.1%)
• Average daily rate (ADR): US$158.00 (-1.3%)
• Revenue per available room (RevPAR): US$97.06 (-9.3%)
emphasis added
 Click on graph for larger image.
The red line is for 2025, blue is the median, and dashed light blue is for 2024. Dashed purple is for 2018, the record year for hotel occupancy.
The 4-week average of the occupancy rate is tracking below both last year and the median rate for the period 2000 through 2024 (Blue).
Note: Y-axis doesn't start at zero to better show the seasonal change.
The 4-week average will mostly move sideways until the summer travel season. We will likely see a hit to occupancy during the summer months due to less international tourism.
Newsletter: NAR: Existing-Home Sales Decreased to 4.02 million SAAR in March; Down 2.4% YoY
by Calculated Risk on 4/24/2025 10:50:00 AM
Today, in the CalculatedRisk Real Estate Newsletter: NAR: Existing-Home Sales Decreased to 4.02 million SAAR in March; Down 2.4% YoY
Excerpt:
Sales in March (4.02 million SAAR) were down 5.9% from the previous month and were 2.4% below the February 2024 sales rate. This was the 2nd consecutive month with a year-over-year decline, following four consecutive months with a year-over-year increases in sales.There is much more in the article.
...
Sales Year-over-Year and Not Seasonally Adjusted (NSA)
The fourth graph shows existing home sales by month for 2024 and 2025.
Sales decreased 2.4% year-over-year compared to March 2024.

NAR: Existing-Home Sales Decreased to 4.02 million SAAR in March; Down 2.4% YoY
by Calculated Risk on 4/24/2025 10:00:00 AM
From the NAR: Existing-Home Sales Receded 5.9% in March
Existing-home sales descended in March, according to the National Association of REALTORS®. Sales slid in all four major U.S. regions. Year-over-year, sales dropped in the Midwest and South, increased in the West and were unchanged in the Northeast.
Total existing-home sales – completed transactions that include single-family homes, townhomes, condominiums and co-ops – fell 5.9% from February to a seasonally adjusted annual rate of 4.02 million in March. Year-over-year, sales drew back 2.4% (down from 4.12 million in March 2024).
...
Total housing inventory registered at the end of March was 1.33 million units, up 8.1% from February and 19.8% from one year ago (1.11 million). Unsold inventory sits at a 4.0-month supply at the current sales pace, up from 3.5 months in February and 3.2 months in March 2024.
emphasis added
Click on graph for larger image.This graph shows existing home sales, on a Seasonally Adjusted Annual Rate (SAAR) basis since 1994.
Sales in March (4.02 million SAAR) were down 5.9% from the previous month and were 2.4% below the February 2024 sales rate. This was the 2nd consecutive month with a year--over-year decline, following four consecutive months with a year-over-year increases in sales.
The second graph shows nationwide inventory for existing homes.
 According to the NAR, inventory increased to 1.33 million in March from 1.23 million the previous month.
 According to the NAR, inventory increased to 1.33 million in March from 1.23 million the previous month.
Headline inventory is not seasonally adjusted, and inventory usually decreases to the seasonal lows in December and January, and peaks in mid-to-late summer.
The last graph shows the year-over-year (YoY) change in reported existing home inventory and months-of-supply. Since inventory is not seasonally adjusted, it really helps to look at the YoY change. Note: Months-of-supply is based on the seasonally adjusted sales and not seasonally adjusted inventory.
 Inventory was up 19.8% year-over-year (blue) in March compared to March 2024.
Months of supply (red) increased to 4.0 months in March from 3.5 months the previous month.
As expected, the sales rate was below the consensus forecast. I'll have more later.
The last graph shows the year-over-year (YoY) change in reported existing home inventory and months-of-supply. Since inventory is not seasonally adjusted, it really helps to look at the YoY change. Note: Months-of-supply is based on the seasonally adjusted sales and not seasonally adjusted inventory.
 Inventory was up 19.8% year-over-year (blue) in March compared to March 2024.
 Months of supply (red) increased to 4.0 months in March from 3.5 months the previous month.
As expected, the sales rate was below the consensus forecast. I'll have more later.
Weekly Initial Unemployment Claims Increase to 222,000
by Calculated Risk on 4/24/2025 08:30:00 AM
The DOL reported:
In the week ending April 19, the advance figure for seasonally adjusted initial claims was 222,000, an increase of 6,000 from the previous week's revised level. The previous week's level was revised up by 1,000 from 215,000 to 216,000. The 4-week moving average was 220,250, a decrease of 750 from the previous week's revised average. The previous week's average was revised up by 250 from 220,750 to 221,000.The following graph shows the 4-week moving average of weekly claims since 1971.
emphasis added
 Click on graph for larger image.
The dashed line on the graph is the current 4-week average. The four-week average of weekly unemployment claims decreased to 220,250.
The previous week was revised up.
Weekly claims were close to the consensus forecast.
Wednesday, April 23, 2025
Thursday: Unemployment Claims, Durable Goods, Existing Home Sales
by Calculated Risk on 4/23/2025 08:36:00 PM
 Note: Mortgage rates are from MortgageNewsDaily.com and are for top tier scenarios.
Thursday:
• At 8:30 AM ET, The initial weekly unemployment claims report will be released. Initial claims were at 215 thousand last week.
• Also at 8:30 AM, Durable Goods Orders for March from the Census Bureau. The consensus is for a 0.8% increase in durable goods orders.
• Also at 8:30 AM, Chicago Fed National Activity Index for March. This is a composite index of other data.
• At 10:00 AM, Existing Home Sales for March from the National Association of Realtors (NAR). The consensus is for 4.14 million SAAR, down from 4.26 million.
• At 11:00 AM, the Kansas City Fed manufacturing survey for April.
April Vehicle Forecast: Sales at 17.4 million SAAR, Up 8.6% YoY
by Calculated Risk on 4/23/2025 06:31:00 PM
From WardsAuto: Pre-Tariff U.S. Light-Vehicle Sales Surge Continues in April, Sapping Dealer Inventory (pay content). Brief excerpt:
If the forecast holds firm, inventory will fall below the year-ago month for the first time in nearly three years. Less inventory could take pressure off automakers and dealers to limit price hikes by absorbing some of the higher costs caused by tariffs, if they remain in place. Conversely, it also means a higher mix of pricier vehicles on dealer lots and lower sales volumes – and automakers, at least for now, are more inclined to emphasize production cuts, and not big discounts to consumers, to manage inventory in the face of weakening demand.
emphasis added
 Click on graph for larger image.
This graph shows actual sales from the BEA (Blue), and Wards forecast for April (Red).
On a seasonally adjusted annual rate basis, the Wards forecast of 17.4 million SAAR, would be down 2.1% from last month, and up 8.6% from a year ago.
Car buyers have rushed to buy over the last couple of months to beat the tariffs. There will be payback in coming months.
AIA: "Business conditions at architecture firms soften further"
by Calculated Risk on 4/23/2025 06:06:00 PM
Note: This index is a leading indicator primarily for new Commercial Real Estate (CRE) investment.
From the AIA: ABI March 2025: Business conditions at architecture firms soften further
The ABI/Deltek Architecture Billings Index dipped further from February to 44.1 in March, as even more firms reported a decline in billings from the previous month. Since the ABI first dropped below 50 in October 2022, following the post-pandemic boom, billings have declined 27 of the last 30 months. Unfortunately, this softness is likely to continue as indicators of future work remain weak. Inquiries into new work declined for the second month in March, while the value of newly signed design contracts fell for the thirteenth consecutive month. Clients are increasingly nervous about the uncertain economic outlook, and many remain wary of starting new projects at this time. However, backlogs at architecture firms remain reasonably healthy at 6.5 months, on average, which means that even though little new work is coming in currently, they still have a decent amount in the pipeline.• Northeast (40.5); Midwest (45.5); South (48.3); West (43.0)
Firm billings continued to decline in all regions of the country in March as well. Billings were softest at firms located in the Northeast for the sixth consecutive month but also weakened further at firms located in the West and Midwest. Firms located in the South reported the smallest decline in billings. Business conditions also remained weak at firms of all specializations, with firms with a multifamily residential specialization continuing to report the softest conditions. Billings were trending stronger at firms with an institutional specialization late last year but have softened significantly since then.
...
The ABI score is a leading economic indicator of construction activity, providing an approximately nine-to-twelve-month glimpse into the future of nonresidential construction spending activity. The score is derived from a monthly survey of architecture firms that measures the change in the number of services provided to clients.
emphasis added
• Sector index breakdown: commercial/industrial (46.9); institutional (46.4); multifamily residential (40.3)
 Click on graph for larger image.
This graph shows the Architecture Billings Index since 1996. The index was at 45.5 in February, down from 45.6 in January. Anything below 50 indicates a decrease in demand for architects' services.
This index has indicated contraction for 27 of the last 30 months.
Note: This includes commercial and industrial facilities like hotels and office buildings, multi-family residential, as well as schools, hospitals and other institutions.
This index usually leads CRE investment by 9 to 12 months, so this index suggests a slowdown in CRE investment throughout 2025 and into 2026.
Multi-family billings remained negative has been negative for the last 32 months. This suggests we will see continued weakness in multi-family starts.
U.S. Births Increased in 2024
by Calculated Risk on 4/23/2025 02:17:00 PM
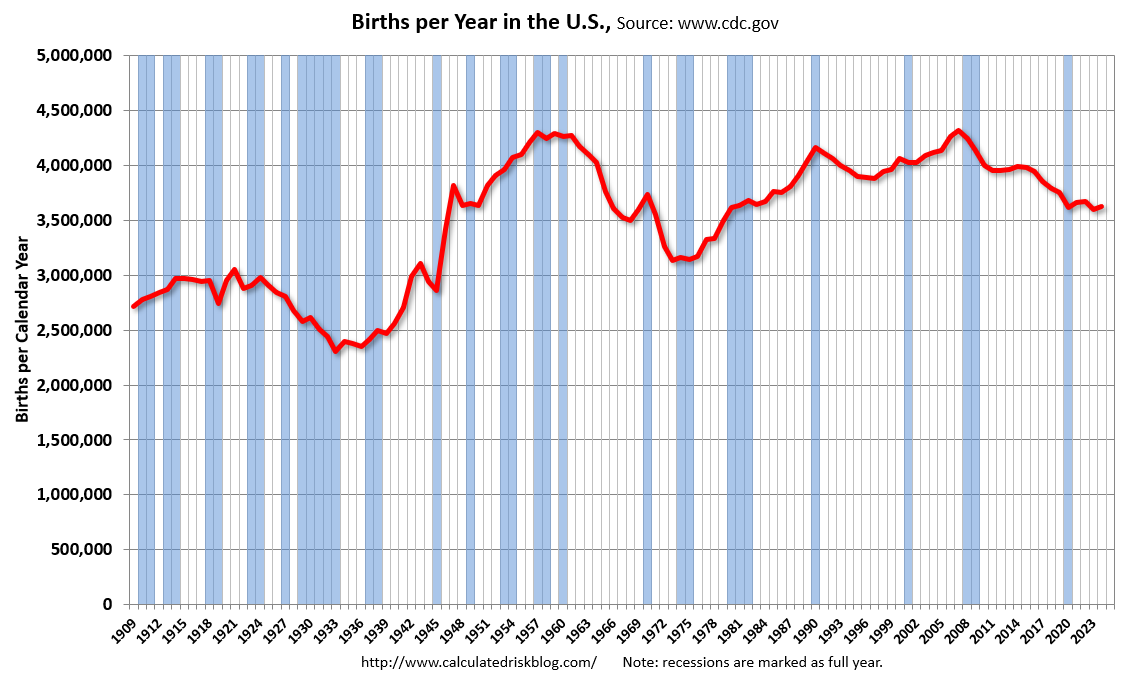
From the National Center for Health Statistics: Births: Provisional Data for 2024. The NCHS reports:
The provisional number of births for the United States in 2024 was 3,622,673, up 1% from 2023. The general fertility rate was 54.6 births per 1,000 females ages 15–44, an increase of less than 1% from 2023. The total fertility rate was 1,626.5 births per 1,000 women in 2024, an increase of less than 1% from 2023. Birth rates declined for females in 5-year age groups 15–24, rose for women in age groups 25–44, and were unchanged for females ages 10–14 and for women ages 45–49 in 2024. The birth rate for teenagers ages 15–19 declined by 3% in 2024 to 12.7 births per 1,000 females; the rates for younger (15–17) and older (18–19) teenagers declined 4% and 3%, respectively.Here is a long-term graph of annual U.S. births through 2023.
emphasis added
 Click on graph for larger image.
Births peaked in 2007 and have generally declined since then.
Note the amazing decline in teenage births.
There is much more in the report.


