Here are the daily travel numbers from the TSA.
This data is as of March 23, 2025.
 Click on graph for larger image.
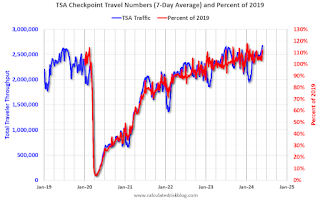
This data shows the 7-day average of daily total traveler throughput from the TSA (Blue).
This data is as of March 23, 2025.
 Click on graph for larger image.
This data shows the 7-day average of daily total traveler throughput from the TSA (Blue).
Air travel is up about 2.6% YoY.
The red line is the percent of 2019 for the seven-day average. Air travel - as a percent of 2019 - is up about 9% from pre-pandemic levels.
The red line is the percent of 2019 for the seven-day average. Air travel - as a percent of 2019 - is up about 9% from pre-pandemic levels.