 RSS Feed
 by Calculated Risk on 3/31/2025 07:17:00 PM
Monday, March 31, 2025
Tuesday: Job Openings, ISM Mfg, Construction Spending, Vehicle Sales
 From Matthew Graham at Mortgage News Daily: Mortgage Rates Inch Lower, But Remain Broadly Sideways
Sideways" has been the dominant theme for mortgage rates for well over a month now. The average top tier 30yr fixed rate fell below 6.82% on February 25th, and moved down to 6.70% the following week. We haven't been outside of that range since then.Tuesday:
Today was just another day in that regard, or perhaps even a prime example considering it was smack dab in the middle of that range. [30 year fixed 6.74%]
emphasis added
• At 10:00 AM ET, Job Openings and Labor Turnover Survey for February from the BLS.
• Also at 10:00 AM, ISM Manufacturing Index for March. The consensus is for the ISM to be at 50.3, unchanged from 50.3 in February.
• Also at 10:00 AM, Construction Spending for February. The consensus is for 0.2% increase in construction spending.
• All Day: Light vehicle sales for March.
FHFA’s National Mortgage Database: Outstanding Mortgage Rates, LTV and Credit Scores
by Calculated Risk on 3/31/2025 02:36:00 PM
Today, in the Calculated Risk Real Estate Newsletter: FHFA’s National Mortgage Database: Outstanding Mortgage Rates, LTV and Credit Scores
A brief excerpt:
Here are some graphs on outstanding mortgages by interest rate, the average mortgage interest rate, borrowers’ credit scores and current loan-to-value (LTV) from the FHFA’s National Mortgage Database through Q4 2024 (just released).There is much more in the article.
...
Here is some data showing the distribution of interest rates on closed-end, fixed-rate 1-4 family mortgages outstanding at the end of each quarter since Q1 2013 through Q4 2024.
This shows the surge in the percent of loans under 3%, and also under 4%, starting in early 2020 as mortgage rates declined sharply during the pandemic. The percent of outstanding loans under 4% peaked in Q1 2022 at 65.1% (now at 54.1%), and the percent under 5% peaked at 85.6% (now at 72.1%). These low existing mortgage rates makes it difficult for homeowners to sell their homes and buy a new home since their monthly payments would increase sharply. This was a key reason existing home inventory levels were so low.
Time is slowly eroding this lock-in effect.

Freddie Mac House Price Index Increased in February; Up 3.4% Year-over-year
by Calculated Risk on 3/31/2025 10:34:00 AM
Today, in the Calculated Risk Real Estate Newsletter: Freddie Mac House Price Index Increased in February; Up 3.4% Year-over-year
A brief excerpt:
Freddie Mac reported that its “National” Home Price Index (FMHPI) increased 0.18% month-over-month on a seasonally adjusted (SA) basis in February. On a year-over-year basis, the National FMHPI was up 3.4% in February, down from up 3.6% YoY in January. The YoY increase peaked at 19.0% in July 2021, and for this cycle, bottomed at up 0.9% YoY in May 2023. ...There is much more in the article!
For cities (Core-based Statistical Areas, CBSA), here are the 30 cities with the largest declines from the peak, seasonally adjusted. Austin continues to be the worst performing city. However, 7 of the 10 cities with the largest price declines are in Florida.

Housing March 31st Weekly Update: Inventory up 1.1% Week-over-week, Up 30.6% Year-over-year
by Calculated Risk on 3/31/2025 08:11:00 AM
Altos reports that active single-family inventory was up 1.1% week-over-week.
Inventory is now up 8.2% from the seasonal bottom in January and is increasing.
The first graph shows the seasonal pattern for active single-family inventory since 2015.
 Click on graph for larger image.
The red line is for 2025. The black line is for 2019.
Inventory was up 30.6% compared to the same week in 2024 (last week it was up 30.3%), and down 19.0% compared to the same week in 2019 (last week it was down 19.5%).
The gap to more normal inventory levels has closed significantly! It now appears inventory will be close to 2019 levels towards the end of 2025.
 This second inventory graph is courtesy of Altos Research.
As of March 28th, inventory was at 676 thousand (7-day average), compared to 668 thousand the prior week.
Mike Simonsen discusses this data regularly on Youtube
Sunday, March 30, 2025
Sunday Night Futures
by Calculated Risk on 3/30/2025 07:11:00 PM
Weekend:
• Schedule for Week of March 30, 2025
Monday:
• At 9:45 AM ET, Chicago Purchasing Managers Index for March. The consensus is for a reading of 45.5, unchanged from 45.5 in February.
• At 10:30 AM, Dallas Fed Survey of Manufacturing Activity for March. This is the last of the regional surveys for March.
From CNBC: Pre-Market Data and Bloomberg futures S&P 500 are down 31 and DOW futures are down 192 (fair value).
Oil prices were up over the last week with WTI futures at $69.36 per barrel and Brent at $73.63 per barrel. A year ago, WTI was at $85, and Brent was at $87 - so WTI oil prices are down about 18% year-over-year.
Here is a graph from Gasbuddy.com for nationwide gasoline prices. Nationally prices are at $3.12 per gallon. A year ago, prices were at $3.51 per gallon, so gasoline prices are down $0.39 year-over-year.
A few comments on the Seasonal Pattern for House Prices
by Calculated Risk on 3/30/2025 10:19:00 AM
Another update ... a few key points:
1) There is a clear seasonal pattern for house prices.
2) The surge in distressed sales during the housing bust distorted the seasonal pattern. This was because distressed sales (at lower price points) happened at a steady rate all year, while regular sales followed the normal seasonal pattern. This made for larger swings in the seasonal factor during the housing bust.
3) The seasonal swings have increased recently without a surge in distressed sales.
 Click on graph for larger image.
This graph shows the month-to-month change in the NSA Case-Shiller National index since 1987 (through January 2025). The seasonal pattern was smaller back in the '90s and early '00s and increased once the bubble burst.
The seasonal swings declined following the bust, however the pandemic price surge changed the month-over-month pattern.
 The second graph shows the seasonal factors for the Case-Shiller National index since 1987. The factors started to change near the peak of the bubble, and really increased during the bust since normal sales followed the regular seasonal pattern - and distressed sales happened all year.
The swings in the seasonal factors were decreasing following the bust but have increased again recently - this time without a surge in distressed sales.
 Click on graph for larger image.
This graph shows the month-to-month change in the NSA Case-Shiller National index since 1987 (through January 2025). The seasonal pattern was smaller back in the '90s and early '00s and increased once the bubble burst.
The seasonal swings declined following the bust, however the pandemic price surge changed the month-over-month pattern.
 The second graph shows the seasonal factors for the Case-Shiller National index since 1987. The factors started to change near the peak of the bubble, and really increased during the bust since normal sales followed the regular seasonal pattern - and distressed sales happened all year.
 The swings in the seasonal factors were decreasing following the bust but have increased again recently - this time without a surge in distressed sales.
Saturday, March 29, 2025
Real Estate Newsletter Articles this Week: New Home Sales Increase to 676,000 Annual Rate in February
by Calculated Risk on 3/29/2025 02:11:00 PM
At the Calculated Risk Real Estate Newsletter this week:
 Click on graph for larger image.
• New Home Sales Increase to 676,000 Annual Rate in February
• Case-Shiller: National House Price Index Up 4.1% year-over-year in January
• Policy and 2025 Housing Outlook
• Fannie and Freddie: Single Family Serious Delinquency Rates Unchanged in February
• Final Look at Local Housing Markets in February and a Look Ahead to March Sales
• Inflation Adjusted House Prices 0.8% Below 2022 Peak
This is usually published 4 to 6 times a week and provides more in-depth analysis of the housing market.
Schedule for Week of March 30, 2025
by Calculated Risk on 3/29/2025 08:11:00 AM
The key report scheduled for this week is the March employment report on Friday.
Other key reports include the February Trade Deficit and March Auto Sales.
For manufacturing, the March ISM Manufacturing and Dallas Fed surveys will be released.
Fed Chair Powell speaks on Friday.
----- Monday, March 31st -----
9:45 AM: Chicago Purchasing Managers Index for March. The consensus is for a reading of 45.5, unchanged from 45.5 in February.
10:30 AM: Dallas Fed Survey of Manufacturing Activity for March. This is the last of the regional surveys for March.
----- Tuesday, April 1st -----
 10:00 AM ET: Job Openings and Labor Turnover Survey for February from the BLS.
This graph shows job openings (black line), hires (dark blue), Layoff, Discharges and other (red column), and Quits (light blue column) from the JOLTS.
Jobs openings increased in January to 7.74 million from 7.51 million in December.
The number of job openings (black) were down 9% year-over-year. Quits were down 3% year-over-year.
10:00 AM: ISM Manufacturing Index for March. The consensus is for the ISM to be at 50.3, unchanged from 50.3 in February.
10:00 AM: Construction Spending for February. The consensus is for 0.2% increase in construction spending.
 All Day: Light vehicle sales for March. The consensus is for light vehicle sales to be 16.6 million SAAR in March, up from 16.0 million in February (Seasonally Adjusted Annual Rate).
This graph shows light vehicle sales since the BEA started keeping data in 1967. The dashed line is the February sales rate.
----- Wednesday, April 2nd -----
7:00 AM ET: The Mortgage Bankers Association (MBA) will release the results for the mortgage purchase applications index.
8:15 AM: The ADP Employment Report for March. This report is for private payrolls only (no government). The consensus is for 119,000 payroll jobs added in March, up from 77,000 added in February.
----- Thursday, April 3rd -----
8:30 AM: The initial weekly unemployment claims report will be released. The consensus is for 225 initial claims up from 224 thousand last week.
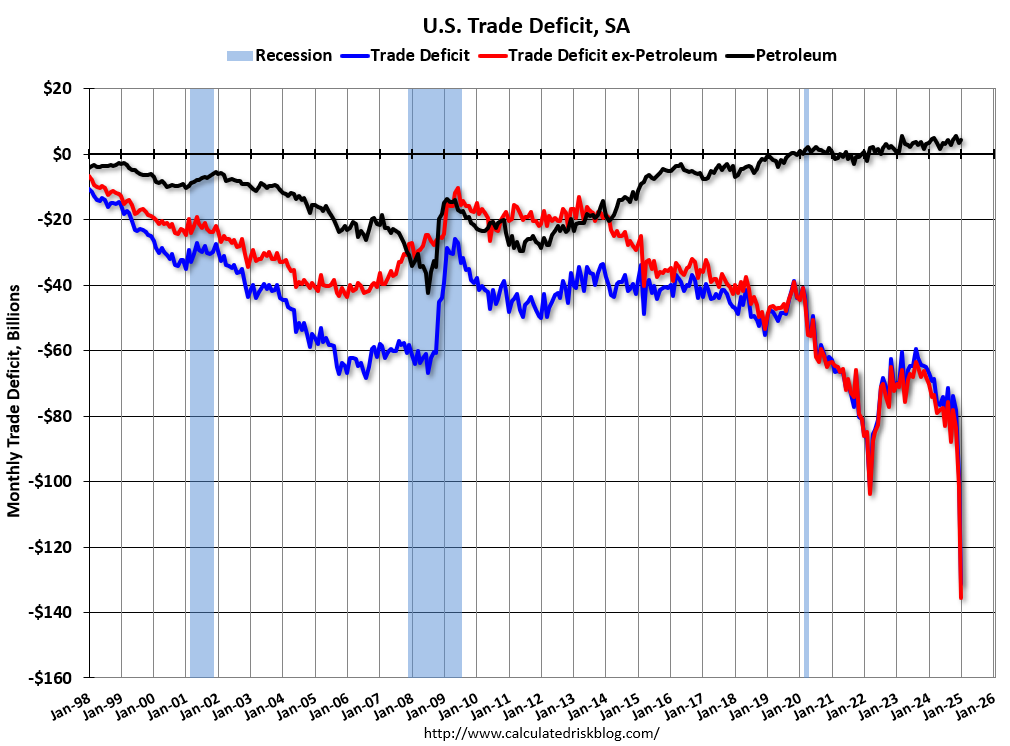
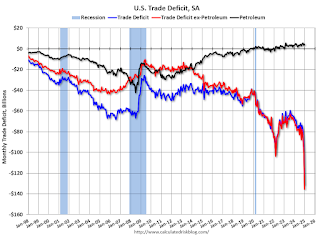 8:30 AM: Trade Balance report for February from the Census Bureau.
This graph shows the U.S. trade deficit, with and without petroleum, through the most recent report. The blue line is the total deficit, and the black line is the petroleum deficit, and the red line is the trade deficit ex-petroleum products.
The consensus is the trade deficit to be $110.0 billion. The U.S. trade deficit was at $131.4 billion in January.
10:00 AM: the ISM Services Index for March.
----- Friday, April 4th -----
 8:30 AM: Employment Report for March. The consensus is for 135,000 jobs added, and for the unemployment rate to be unchanged at 4.1%.
There were 151,000 jobs added in February, and the unemployment rate was at 4.1%.
This graph shows the jobs added per month since January 2021.
11:25 AM: Speech, Fed Chair Jerome Powell, Economic Outlook, At the Society for Advancing Business Editing and Writing (SABEW) Annual Conference, Arlington, Virginia
9:45 AM: Chicago Purchasing Managers Index for March. The consensus is for a reading of 45.5, unchanged from 45.5 in February.
10:30 AM: Dallas Fed Survey of Manufacturing Activity for March. This is the last of the regional surveys for March.
 10:00 AM ET: Job Openings and Labor Turnover Survey for February from the BLS.
 This graph shows job openings (black line), hires (dark blue), Layoff, Discharges and other (red column), and Quits (light blue column) from the JOLTS.
Jobs openings increased in January to 7.74 million from 7.51 million in December.
The number of job openings (black) were down 9% year-over-year. Quits were down 3% year-over-year.
10:00 AM: ISM Manufacturing Index for March. The consensus is for the ISM to be at 50.3, unchanged from 50.3 in February.
10:00 AM: Construction Spending for February. The consensus is for 0.2% increase in construction spending.
 All Day: Light vehicle sales for March. The consensus is for light vehicle sales to be 16.6 million SAAR in March, up from 16.0 million in February (Seasonally Adjusted Annual Rate).
This graph shows light vehicle sales since the BEA started keeping data in 1967. The dashed line is the February sales rate.
7:00 AM ET: The Mortgage Bankers Association (MBA) will release the results for the mortgage purchase applications index.
8:15 AM: The ADP Employment Report for March. This report is for private payrolls only (no government). The consensus is for 119,000 payroll jobs added in March, up from 77,000 added in February.
8:30 AM: The initial weekly unemployment claims report will be released. The consensus is for 225 initial claims up from 224 thousand last week.
 8:30 AM: Trade Balance report for February from the Census Bureau.
 This graph shows the U.S. trade deficit, with and without petroleum, through the most recent report. The blue line is the total deficit, and the black line is the petroleum deficit, and the red line is the trade deficit ex-petroleum products.
The consensus is the trade deficit to be $110.0 billion. The U.S. trade deficit was at $131.4 billion in January.
10:00 AM: the ISM Services Index for March.
 8:30 AM: Employment Report for March. The consensus is for 135,000 jobs added, and for the unemployment rate to be unchanged at 4.1%.
There were 151,000 jobs added in February, and the unemployment rate was at 4.1%.
This graph shows the jobs added per month since January 2021.
11:25 AM: Speech, Fed Chair Jerome Powell, Economic Outlook, At the Society for Advancing Business Editing and Writing (SABEW) Annual Conference, Arlington, Virginia
Friday, March 28, 2025
March 28th COVID Update: COVID Deaths Continue Declining
by Calculated Risk on 3/28/2025 07:15:00 PM
 Note: Mortgage rates are from MortgageNewsDaily.com and are for top tier scenarios.
For deaths, I'm currently using 4 weeks ago for "now", since the most recent three weeks will be revised significantly.
Note: "Effective May 1, 2024, hospitals are no longer required to report COVID-19 hospital admissions, hospital capacity, or hospital occupancy data." So, I'm no longer tracking hospitalizations.
| COVID Metrics | ||||
|---|---|---|---|---|
| Now | Week Ago | Goal | ||
| Deaths per Week | 602 | 658 | ≤3501 | |
| 1my goals to stop weekly posts. 🚩 Increasing number weekly for Deaths. ✅ Goal met. | ||||
 Click on graph for larger image.
This graph shows the weekly (columns) number of deaths reported since Jan 2023.
Although weekly deaths met the original goal to stop posting in June 2023 (low of 314 deaths), I've continued to post since deaths are above the goal again - and I'll continue to post until weekly deaths are once again below the goal.
Weekly deaths are now decreasing following the winter pickup and about double the low of last June.
 This appears to be a leading indicator for COVID hospitalizations and deaths. This has generally been moving down.
Nationally COVID in wastewater is "Low", down from "Moderate" last week according to the CDC.
Fannie and Freddie: Single Family Serious Delinquency Rates Unchanged in February; Multi-Family Delinquency Rate Equals Highest Since 2011 (ex-Pandemic)
by Calculated Risk on 3/28/2025 04:38:00 PM
Today, in the Calculated Risk Real Estate Newsletter: Fannie and Freddie: Single Family Serious Delinquency Rates Unchanged in February
Excerpt:
Freddie Mac reported that the Single-Family serious delinquency rate in February was 0.61%, unchanged from 0.61% January. Freddie's rate is up year-over-year from 0.54% in February 2024, however, this is close to the pre-pandemic level of 0.60%.
Some of the recent increase in the 90+ day delinquency rate is probably related to the hurricanes last year.
Freddie's serious delinquency rate peaked in February 2010 at 4.20% following the housing bubble and peaked at 3.17% in August 2020 during the pandemic.
Fannie Mae reported that the Single-Family serious delinquency rate in February was 0.57%, unchanged from 0.57% in January. The serious delinquency rate is up year-over-year from 0.53% in February 2024, however, this is below the pre-pandemic lows of 0.65%.
The Fannie Mae serious delinquency rate peaked in February 2010 at 5.59% following the housing bubble and peaked at 3.32% in August 2020 during the pandemic.

There is much more in the article.
Q1 GDP Tracking: -0.5% to 1%
by Calculated Risk on 3/28/2025 11:20:00 AM
UPDATE: Updated Goldman tracking this morning.
From BofA:
1Q GDP tracking is down from our recently updated official forecast of 1.5% q/q saar to 1.0% q/q saar. [Mar 28th estimate]From Goldman:
emphasis added
We lowered our Q1 GDP tracking estimate by 0.4pp to +0.6% (quarter-over-quarter annualized). [Mar 28th estimate]
 And from the Atlanta Fed: GDPNow
The GDPNow model estimate for real GDP growth (seasonally adjusted annual rate) in the first quarter of 2025 is -2.8 percent on March 28, down from -1.8 percent on March 26. The alternative model forecast, which adjusts for imports and exports of gold as described here, is -0.5 percent. [Mar 28th estimate]
PCE Measure of Shelter Decreases to 4.3% YoY in February
by Calculated Risk on 3/28/2025 08:56:00 AM
Here is a graph of the year-over-year change in shelter from the CPI report and housing from the PCE report this morning, both through February 2025.
 CPI Shelter was up 4.2% year-over-year in February, down from 4.4% in January, and down from the cycle peak of 8.2% in March 2023.
Housing (PCE) was up 4.3% YoY in February, down from 4.5% in January and down from the cycle peak of 8.3% in April 2023.
Since asking rents are mostly flat year-over-year, these measures will slowly continue to decline over the next year as rents for existing tenants continue to increase.
Since asking rents are mostly flat year-over-year, these measures will slowly continue to decline over the next year as rents for existing tenants continue to increase.
 The second graph shows PCE prices, Core PCE prices and Core ex-housing over the last 3 months (annualized):
Key measures are well above the Fed's target on a 3-month basis. Note: There is possibly some residual seasonality distorting PCE prices in Q1, especially in January.
3-month annualized change:
PCE Price Index: 3.9%
Core PCE Prices: 3.6%
Core minus Housing: 3.5%
Core PCE Prices: 3.6%
Core minus Housing: 3.5%
Personal Income increased 0.8% in February; Spending increased 0.4%
by Calculated Risk on 3/28/2025 08:30:00 AM
The BEA released the Personal Income and Outlays report for February:
Personal income increased $194.7 billion (0.8 percent at a monthly rate) in February, according to estimates released today by the U.S. Bureau of Economic Analysis. Disposable personal income (DPI)—personal income less personal current taxes—increased $191.6 billion (0.9 percent) and personal consumption expenditures (PCE) increased $87.8 billion (0.4 percent).The February PCE price index increased 2.5 percent year-over-year (YoY), unchanged from 2.5 percent YoY in January, and down from the recent peak of 7.2 percent in June 2022.
Personal outlays—the sum of PCE, personal interest payments, and personal current transfer payments—increased $118.4 billion in February. Personal saving was $1.02 trillion in February and the personal saving rate—personal saving as a percentage of disposable personal income—was 4.6 percent.
From the preceding month, the PCE price index for February increased 0.3 percent. Excluding food and energy, the PCE price index increased 0.4 percent.
From the same month one year ago, the PCE price index for February increased 2.5 percent. Excluding food and energy, the PCE price index increased 2.8 percent from one year ago.
emphasis added
The PCE price index, excluding food and energy, increased 2.8 percent YoY, up from 2.7 percent in January, and down from the recent peak of 5.6 percent in February 2022.
The following graph shows real Personal Consumption Expenditures (PCE) through February 2025 (2017 dollars). Note that the y-axis doesn't start at zero to better show the change.
 Click on graph for larger image.
The dashed red lines are the quarterly levels for real PCE.
Personal income was above expectations. PCE was at expectations.
Inflation was above expectations.
Using the two-month method to estimate Q1 real PCE growth, real PCE was increasing at a 0.9% annual rate in Q1 2024. (Using the mid-month method, real PCE was increasing at 0.2%). This suggests weak PCE growth in Q1.
Thursday, March 27, 2025
Friday: Personal Income & Outlays
by Calculated Risk on 3/27/2025 08:13:00 PM
 Note: Mortgage rates are from MortgageNewsDaily.com and are for top tier scenarios.
Friday:
• At 8:30 AM ET, Personal Income and Outlays for February. The consensus is for a 0.4% increase in personal income, and for a 0.6% increase in personal spending. And for the Core PCE price index to increase 0.3%. PCE prices are expected to be up 2.5% YoY, and core PCE prices up 2.7% YoY.
• At 10:00 AM, University of Michigan's Consumer sentiment index (Final for March). The consensus is for a reading of 57.9.
• Also at 10:00 AM, State Employment and Unemployment (Monthly) for February 2025
Realtor.com Reports Active Inventory Up 29.2% YoY
by Calculated Risk on 3/27/2025 05:50:00 PM
What this means: On a weekly basis, Realtor.com reports the year-over-year change in active inventory and new listings. On a monthly basis, they report total inventory. For February, Realtor.com reported inventory was up 27.5% YoY, but still down 22.9% compared to the 2017 to 2019 same month levels.
Now - on a weekly basis - inventory is up 29.2% YoY.
Realtor.com has monthly and weekly data on the existing home market. Here is their weekly report: Weekly Housing Trends View—Data for Week Ending March 22, 2025 Here is a graph of the year-over-year change in inventory according to realtor.com.
Inventory was up year-over-year for the 72nd consecutive week.
Realtor.com has monthly and weekly data on the existing home market. Here is their weekly report: Weekly Housing Trends View—Data for Week Ending March 22, 2025
• Active inventory climbed 29.2% from a year ago
The number of homes actively for sale remains significantly higher than last year, continuing a 72-week streak of annual gains. This year-over-year inventory growth gives buyers more choices and encourages more competitive pricing among sellers. However, the inventory level is still below pre-pandemic norms, and supply constraints in many markets continue to limit buyer flexibility.
• New listings—a measure of sellers putting homes up for sale—increased 8.2%
New listings were up 8.2% compared with this time last year, marking the 11th straight week of annual growth.
• The median list price was unchanged year-over-year
The national median list price was unchanged from a year ago, continuing a 43-week streak where prices have either remained flat or declined compared with the same time last year. Rather than signaling a turnaround, this stability suggests that prices are holding steady as the market adjusts to higher borrowing costs and a growing number of listings.
 Here is a graph of the year-over-year change in inventory according to realtor.com.
 Inventory was up year-over-year for the 72nd consecutive week.
New listings have increased recently but remain below typical pre-pandemic levels.
Median prices are mostly unchanged year-over-year.
Hotels: Occupancy Rate Increased 1.0% Year-over-year
by Calculated Risk on 3/27/2025 02:47:00 PM
The U.S. hotel industry reported positive year-over-year comparisons, according to CoStar’s latest data through 22 March. ...The following graph shows the seasonal pattern for the hotel occupancy rate using the four-week average.
16-22 March 2025 (percentage change from comparable week in 2024):
• Occupancy: 66.0% (+1.0%)
• Average daily rate (ADR): US$165.48 (+1.8%)
• Revenue per available room (RevPAR): US$109.22 (+2.8%)
emphasis added
 Click on graph for larger image.
The red line is for 2025, blue is the median, and dashed light blue is for 2024. Dashed purple is for 2018, the record year for hotel occupancy.
The 4-week average of the occupancy rate is tracking below last year and is lower than the median rate for the period 2000 through 2024 (Blue).
Note: Y-axis doesn't start at zero to better show the seasonal change.
The 4-week average will mostly move sideways until the summer travel season. We might see a hit to occupancy during the summer months due to less international tourism.
Inflation Adjusted House Prices 0.8% Below 2022 Peak; Price-to-rent index is 7.4% below 2022 peak
by Calculated Risk on 3/27/2025 11:28:00 AM
Today, in the Calculated Risk Real Estate Newsletter: Inflation Adjusted House Prices 0.8% Below 2022 Peak
Excerpt:
It has been over 18 years since the housing bubble peak. In the January Case-Shiller house price index released this week, the seasonally adjusted National Index (SA), was reported as being 78% above the bubble peak in 2006. However, in real terms, the National index (SA) is about 12% above the bubble peak (and historically there has been an upward slope to real house prices). The composite 20, in real terms, is 3% above the bubble peak.There is much more in the article!
People usually graph nominal house prices, but it is also important to look at prices in real terms. As an example, if a house price was $300,000 in January 2010, the price would be $440,000 today adjusted for inflation (47% increase). That is why the second graph below is important - this shows "real" prices.
The third graph shows the price-to-rent ratio, and the fourth graph is the affordability index. The last graph shows the 5-year real return based on the Case-Shiller National Index.
...
The second graph shows the same two indexes in real terms (adjusted for inflation using CPI).
In real terms (using CPI), the National index is 0.8% below the recent peak, and the Composite 20 index is 1.2% below the recent peak in 2022. The real National index and the Composite 20 index increased slightly in real terms in January.
It has now been 32 months since the real peak in house prices. Typically, after a sharp increase in prices, it takes a number of years for real prices to reach new highs (see House Prices: 7 Years in Purgatory)

NAR: Pending Home Sales Increase 2.0% in February; Down 3.6% YoY
by Calculated Risk on 3/27/2025 10:00:00 AM
From the NAR: Pending Home Sales Advanced 2.0% in February
Pending home sales improved 2.0% in February according to the National Association of REALTORS®. The Northeast and West experienced month-over-month losses in transactions – with a larger decrease in the West – while the Midwest and South saw gains, which were greatest in the South. Year-over-year, contract signings dropped in all four U.S. regions, with the Midwest undergoing the greatest reduction.Note: Contract signings usually lead sales by about 45 to 60 days, so this would usually be for closed sales in March and April.
The Pending Home Sales Index (PHSI)* – a forward-looking indicator of home sales based on contract signings – grew 2.0% to 72.0 in February. Year-over-year, pending transactions declined 3.6%. An index of 100 is equal to the level of contract activity in 2001.
"Despite the modest monthly increase, contract signings remain well below normal historical levels," said NAR Chief Economist Lawrence Yun. "A meaningful decline in mortgage rates would help both demand and supply – demand by boosting affordability, and supply by lessening the power of the mortgage rate lock-in effect."
...
The Northeast PHSI fell 0.9% from last month to 62.8, down 2.5% from February 2024. The Midwest index inched up 0.7% to 73.3 in February, down 4.7% from the previous year.
The South PHSI jumped 6.2% to 86.0 in February, down 3.4% from a year ago. The West index contracted by 3.0% from the prior month to 55.9, down 3.5% from February 2024.
emphasis added
Q4 GDP Growth Revised up to 2.4% Annual Rate
by Calculated Risk on 3/27/2025 08:44:00 AM
From the BEA: Gross Domestic Product, 4th Quarter and Year 2024 (Third Estimate), GDP by Industry, and Corporate Profits
Real gross domestic product (GDP) increased at an annual rate of 2.4 percent in the fourth quarter of 2024 (October, November, and December), according to the third estimate released by the U.S. Bureau of Economic Analysis. In the third quarter, real GDP increased 3.1 percent.Here is a Comparison of Third and Second Estimates. PCE growth was revised down to 4.0% from 4.2%. Residential investment was revised up from 5.4% to 5.5%.
The increase in real GDP in the fourth quarter primarily reflected increases in consumer spending and government spending that were partly offset by a decrease in investment. Imports, which are a subtraction in the calculation of GDP, decreased. ... Real GDP was revised up 0.1 percentage point from the second estimate, primarily reflecting a downward revision to imports.
emphasis added
Weekly Initial Unemployment Claims Decrease to 224,000
by Calculated Risk on 3/27/2025 08:30:00 AM
The DOL reported:
In the week ending March 22, the advance figure for seasonally adjusted initial claims was 224,000, a decrease of 1,000 from the previous week's revised level. The previous week's level was revised up by 2,000 from 223,000 to 225,000. The 4-week moving average was 224,000, a decrease of 4,750 from the previous week's revised average. The previous week's average was revised up by 1,750 from 227,000 to 228,750.The following graph shows the 4-week moving average of weekly claims since 1971.
emphasis added
 Click on graph for larger image.
The dashed line on the graph is the current 4-week average. The four-week average of weekly unemployment claims decreased to 224,000.
The previous week was revised up.
Weekly claims were close to the consensus forecast.
Wednesday, March 26, 2025
Thursday: GDP, Unemployment Claims, Pending Home Sales
by Calculated Risk on 3/26/2025 07:29:00 PM
 Note: Mortgage rates are from MortgageNewsDaily.com and are for top tier scenarios.
Thursday:
• At 8:30 AM ET, The initial weekly unemployment claims report will be released. The consensus is for 225 initial claims up from 223 thousand last week.
• Also at 8:30 AM, Gross Domestic Product, 4th Quarter and Year 2024 (Third Estimate), GDP by Industry, and Corporate Profits. The consensus is that real GDP increased 2.3% annualized in Q4, unchanged from 2.3% in the second estimate.
• At 10:00 AM, Pending Home Sales Index for February.
• At 11:00 AM, the Kansas City Fed manufacturing survey for March.
Update: Lumber Prices Up 15% YoY
by Calculated Risk on 3/26/2025 02:10:00 PM
This is something to watch again. Here is another monthly update on lumber prices.
SPECIAL NOTE: The CME group discontinued the Random Length Lumber Futures contract on May 16, 2023. I switched to a physically-delivered Lumber Futures contract that was started in August 2022. Unfortunately, this impacts long term price comparisons since the new contract was priced about 24% higher than the old random length contract for the period when both contracts were available.
This graph shows CME random length framing futures through August 2022 (blue), and the new physically-delivered Lumber Futures (LBR) contract starting in August 2022 (Red).
On March 26, 2025, LBR was at $678.00 per 1000 board feet, up 15% from a year ago.
 Click on graph for larger image.
There is somewhat of a seasonal demand for lumber, and lumber prices frequently peak in the first half of the year.
We didn't see a significant runup in the Spring period of 2023 or 2024 due to the housing slowdown.
The recent increase might be due to tariffs. This is the highest price since the pandemic related shortages.
Final Look at Local Housing Markets in February and a Look Ahead to March Sales
by Calculated Risk on 3/26/2025 10:18:00 AM
Today, in the Calculated Risk Real Estate Newsletter: Final Look at Local Housing Markets in February and a Look Ahead to March Sales
A brief excerpt:
After the National Association of Realtors® (NAR) releases the monthly existing home sales report, I pick up additional local market data that is reported after the NAR. This is the final look at local markets in February.There is much more in the article.
The big story for February was that existing home sales decreased year-over-year (YoY) following four consecutive months with a year-over-year increase. Sales at 4.26 million on a Seasonally Adjusted Annual Rate (SAAR) basis were above the consensus estimate; however, this was primarily because of the seasonal adjustment for February. Housing economist Tom Lawler’s estimate was very close (as usual).
Sales averaged over 5.5 million SAAR for the month of February in the 2017-2020 period. So, sales were still about 23% below pre-pandemic levels.
...
Here is a look at months-of-supply using NSA sales. Since this is NSA data, it is likely months-of-supply will increase into the Summer.
Months in red will likely see 6+ months of supply this summer and might see price pressures. There is nothing magical about 6 months; some areas see price declines with less inventory, some more.
Note: This month, for months-of-supply, I broke out Miami (Miami-Dade) from the “Miami Area” this also includes Broward County and Palm Beach.
...
More local data coming in April for activity in March!

MBA: Mortgage Applications Decrease in Latest MBA Weekly Survey
by Calculated Risk on 3/26/2025 07:00:00 AM
From the MBA: Mortgage Applications Decrease in Latest MBA Weekly Survey
Mortgage applications decreased 2.0 percent from one week earlier, according to data from the Mortgage Bankers Association’s (MBA) Weekly Mortgage Applications Survey for the week ending March 21, 2025.
The Market Composite Index, a measure of mortgage loan application volume, decreased 2.0 percent on a seasonally adjusted basis from one week earlier. On an unadjusted basis, the Index decreased 2 percent compared with the previous week. The Refinance Index decreased 5 percent from the previous week and was 63 percent higher than the same week one year ago. The seasonally adjusted Purchase Index increased 1 percent from one week earlier. The unadjusted Purchase Index increased 1 percent compared with the previous week and was 7 percent higher than the same week one year ago.
“Purchase applications saw the strongest weekly pace in almost two months and were 7 percent higher than a year ago. Last week’s purchase activity was driven primarily by a 6 percent increase in FHA applications, as the combination of loosening housing inventory and slowly declining mortgage rates have presented this segment of buyers with more opportunities,” said Joel Kan, MBA’s Vice President and Deputy Chief Economist. “Additionally, VA purchase applications saw a modest increase over the week. Overall applications declined, however, as refinance applications were down 5 percent to its lowest level in a month.”
Added Kan, “Markets remained focused on potential trade policy changes, while the Fed held the funds rate its current level, resulting in the 30-year fixed rate averaging 6.71 percent last week.”
...
The average contract interest rate for 30-year fixed-rate mortgages with conforming loan balances ($806,500 or less) decreased to 6.71 percent from 6.72 percent, with points decreasing to 0.60 from 0.64 (including the origination fee) for 80 percent loan-to-value ratio (LTV) loans.
emphasis added
 Click on graph for larger image.
The first graph shows the MBA mortgage purchase index.
According to the MBA, purchase activity is up 7% year-over-year unadjusted.
Red is a four-week average (blue is weekly).
Purchase application activity is up about 24% from the lows in late October 2023 and is only 3% above the lowest levels during the housing bust.

The second graph shows the refinance index since 1990.
The refinance index declined after increasing sharply the previous two weeks and remains very low.
Tuesday, March 25, 2025
Wednesday: Durable Goods
by Calculated Risk on 3/25/2025 07:15:00 PM
 Note: Mortgage rates are from MortgageNewsDaily.com and are for top tier scenarios.
Wednesday:
• At 7:00 AM ET: The Mortgage Bankers Association (MBA) will release the results for the mortgage purchase applications index.
• At 8:30 AM, Durable Goods Orders for February from the Census Bureau. The consensus is for a 0.7% decrease in durable goods orders.
March Vehicle Forecast: Sales Increase to 16.6 million SAAR, Up 5.9% YoY
by Calculated Risk on 3/25/2025 04:27:00 PM
From WardsAuto: U.S. Light-Vehicle Sales Heading for Long-Time-High Gain in March (pay content). Brief excerpt:
Deliveries appear to have accelerated sharply in the middle of the month, creating momentum that could cause sales to overshoot the forecast. Conversely, overall inventory is relatively lean – and could atypically decline at the end of March from February - so the acceleration could slow before the end of the month after enough stock is pulled from dealer lots.
emphasis added
 Click on graph for larger image.
This graph shows actual sales from the BEA (Blue), and Wards forecast for March (Red).
On a seasonally adjusted annual rate basis, the Wards forecast of 16.6 million SAAR, would be up 3.8% from last month, and up 5.9% from a year ago.
Newsletter: New Home Sales Increase to 676,000 Annual Rate in February
by Calculated Risk on 3/25/2025 11:22:00 AM
Today, in the Calculated Risk Real Estate Newsletter: New Home Sales Increase to 676,000 Annual Rate in February
Brief excerpt:
The Census Bureau reported New Home Sales in February were at a seasonally adjusted annual rate (SAAR) of 676 thousand. The previous three months were revised down, combined.There is much more in the article.
...
The next graph shows new home sales for 2024 and 2025 by month (Seasonally Adjusted Annual Rate). Sales in February 2025 were up 5.1% from February 2024.
New home sales, seasonally adjusted, have increased year-over-year in 20 of the last 23 months. This is essentially the opposite of what happened with existing home sales that had been down year-over-year every month for 3+ years (existing home sales have been up year-over-year for the last 4 or the last 5 months).

New Home Sales Increase to 676,000 Annual Rate in February
by Calculated Risk on 3/25/2025 10:00:00 AM
The Census Bureau reports New Home Sales in February were at a seasonally adjusted annual rate (SAAR) of 676 thousand.
The previous three months were revised down, combined.
Sales of new single-family houses in February 2025 were at a seasonally adjusted annual rate of 676,000, according to estimates released jointly today by the U.S. Census Bureau and the Department of Housing and Urban Development. This is 1.8 percent above the revised January rate of 664,000 and is 5.1 percent above the February 2024 estimate of 643,000.
emphasis added
Click on graph for larger image.The first graph shows New Home Sales vs. recessions since 1963. The dashed line is the current sales rate.
New home sales were slightly below pre-pandemic levels.
The second graph shows New Home Months of Supply.
 The months of supply decreased in February to 8.9 months from 9.0 months in January.
 The all-time record high was 12.2 months of supply in January 2009. The all-time record low was 3.3 months in August 2020.
This is well above the top of the normal range (about 4 to 6 months of supply is normal).
"The seasonally-adjusted estimate of new houses for sale at the end of February was 500,000. This represents a supply of 8.9 months at the current sales rate."Sales were close to expectations of 680 thousand SAAR, however sales for the three previous months were revised down, combined. I'll have more later today.
Newsletter: Case-Shiller: National House Price Index Up 4.1% year-over-year in January
by Calculated Risk on 3/25/2025 09:41:00 AM
Today, in the Calculated Risk Real Estate Newsletter: Case-Shiller: National House Price Index Up 4.1% year-over-year in January
Excerpt:
S&P/Case-Shiller released the monthly Home Price Indices for January ("January" is a 3-month average of November, December and January closing prices). January closing prices include some contracts signed in September, so there is a significant lag to this data. Here is a graph of the month-over-month (MoM) change in the Case-Shiller National Index Seasonally Adjusted (SA).There is much more in the article.
The MoM increase in the seasonally adjusted (SA) Case-Shiller National Index was at 0.57% (a 7.0% annual rate), This was the 24th consecutive MoM increase in the seasonally adjusted index.
On a seasonally adjusted basis, prices increased month-to-month in 19 of the 20 Case-Shiller cities (prices declined in Tampa seasonally adjusted). San Francisco has fallen 5.1% from the recent peak, Tampa is down 1.5% from the peak, and Denver down 0.7%.

Case-Shiller: National House Price Index Up 4.1% year-over-year in January
by Calculated Risk on 3/25/2025 09:00:00 AM
S&P/Case-Shiller released the monthly Home Price Indices for January ("January" is a 3-month average of November, December and January closing prices).
This release includes prices for 20 individual cities, two composite indices (for 10 cities and 20 cities) and the monthly National index.
From S&P S&P CoreLogic Case-Shiller Index Records 4.1% Annual Gain in January 2025
The S&P CoreLogic Case-Shiller U.S. National Home Price NSA Index, covering all nine U.S. census divisions, reported a 4.1% annual return for January, up from a 4% annual gain in the previous month. The 10-City Composite saw an annual increase of 5.3%, up from a 5.2% annual increase in the previous month. The 20-City Composite posted a year-over-year increase of 4.7%, up from a 4.5% increase in the previous month. New York again reported the highest annual gain among the 20 cities with a 7.7% increase in January, followed by Chicago and Boston with annual increases of 7.5% and 6.6%, respectively. Tampa posted the lowest return, falling 1.5%.
...
The pre-seasonally adjusted U.S. National and 20-City Composite Indices presented slight upward trends in January, with both posting 0.1% increases. The 10-City Composite posted a monthly return of 0.2%.
After seasonal adjustment, the 20-City and 10-City Composite Indices posted month-over-month increases of 0.5%. The U.S National posted a month-over-month increase of 0.6%.
“Home price growth continued to moderate in January, reflecting a clear two-part story across the past year,” says Nicholas Godec, CFA, CAIA, CIPM, Head of Fixed Income Tradables & Commodities at S&P Dow Jones Indices. “The National Composite Index posted a 4.1% annual gain, with the bulk of appreciation—4.8%—occurring in the first half of the year. Prices declined 0.7% in the second half, as high mortgage rates and affordability constraints weighed on buyer demand and market activity.
“Among the 20 metro areas tracked by the Composite 20, New York City led annual gains with a 7.7% rise, followed closely by Chicago (7.5%) and Boston (6.5%). Tampa was the only market to post a year over-year decline, falling 1.5%. However, the second half of the year told a different story: San Francisco posted the largest six-month decline at 3.4%, followed by Tampa at 3.2%. Only four of the 20 cities managed to eke out price increases during this period—New York, Chicago, Phoenix, and Boston—highlighting broad-based cooling.
“Rising mortgage rates throughout the year elevated monthly payment burdens, which, combined with already high home prices, pushed affordability to multi-decade lows in many regions. This likely contributed to subdued activity in the back half of the year, with both buyers and sellers exercising caution. Inventory constraints also remain a challenge, particularly in legacy metro areas, where limited new construction continues to restrict supply.
“The strength in markets like New York and Chicago may reflect more normalized valuations relative to frothier regions, along with continued urban recovery trends post-pandemic. On the other hand, Sunbelt markets that experienced sharp run-ups earlier in the cycle—like Tampa and Phoenix—have seen the most pronounced slowdowns.
emphasis added
 Click on graph for larger image.
 The first graph shows the nominal seasonally adjusted Composite 10, Composite 20 and National indices (the Composite 20 was started in January 2000).
The Composite 10 index was up 0.5% in January (SA). The Composite 20 index was up 0.5% (SA) in January.
The National index was up 0.6% (SA) in January.
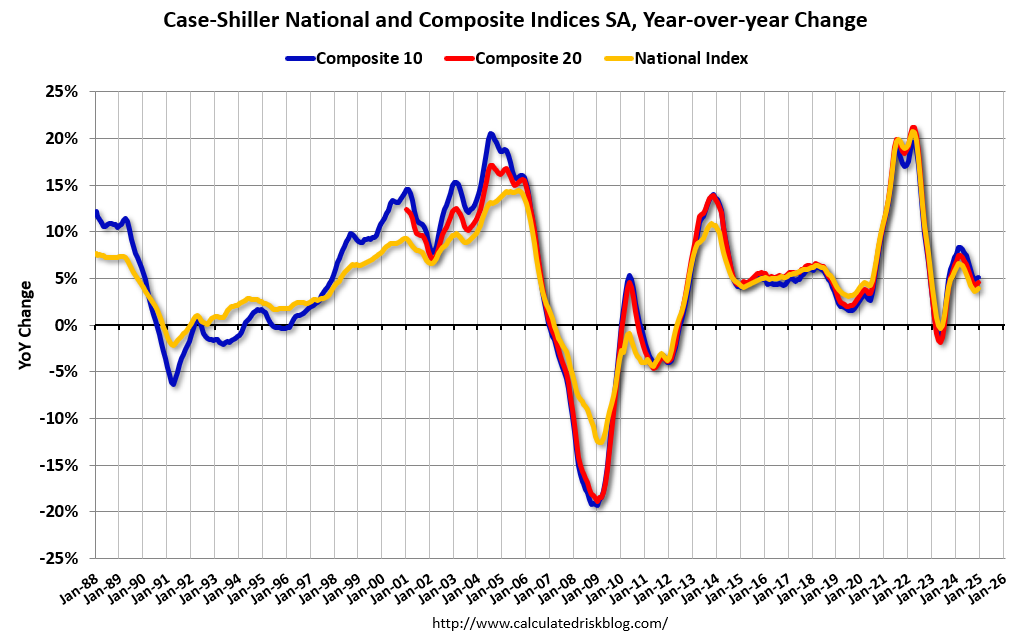
 The second graph shows the year-over-year change in all three indices.
The Composite 10 NSA was up 5.3% year-over-year. The Composite 20 NSA was up 4.7% year-over-year.
The National index NSA was up 4.1% year-over-year.
Annual price changes were slightly higher than expectations. I'll have more later.
Monday, March 24, 2025
Tuesday: Case-Shiller House Prices, New Home Sales
by Calculated Risk on 3/24/2025 07:34:00 PM
 From Matthew Graham at Mortgage News Daily: Mortgage Rates Slightly Higher to Start New Week
The average mortgage lender raised rates modestly on Monday morning--a logical move considering the weakness in the bond market over the weekend. Rates are based directly on bonds. Bond "weakness" means investors are paying less for bonds which, in turn, means that yields (aka "rates") are effectively higher.Tuesday:
...
In the bigger picture, all of this analysis is much ado about nothing. Mortgage rates continue a very flat, narrow orbit around 6.75% for top tier conventional 30yr fixed scenarios. A bigger departure from this range will require a bigger shift in several key economic reports (specifically, inflation reports and the big jobs report that typically comes out on the first Friday of the month). [30 year fixed 6.77%]
emphasis added
• At 9:00 AM ET, S&P/Case-Shiller House Price Index for January. The consensus is for a 4.6% year-over-year increase in the 20-city index for January, up from 4.5% YoY in December.
• Also at 9:00 AM, FHFA House Price Index for January. This was originally a GSE only repeat sales, however there is also an expanded index.
• At 10:00 AM, New Home Sales for February from the Census Bureau. The consensus is for 680 thousand SAAR, up from 657 thousand in January.
• Also at 10:00 AM, Richmond Fed Survey of Manufacturing Activity for March.
TSA: Airline Travel up 3% YoY
by Calculated Risk on 3/24/2025 02:51:00 PM
This is something to watch with less international travel.
Here are the daily travel numbers from the TSA.
This data is as of March 23, 2025.
 Click on graph for larger image.
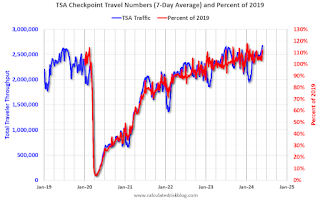
This data shows the 7-day average of daily total traveler throughput from the TSA (Blue).
This data is as of March 23, 2025.
 Click on graph for larger image.
This data shows the 7-day average of daily total traveler throughput from the TSA (Blue).
Air travel is up about 2.6% YoY.
The red line is the percent of 2019 for the seven-day average. Air travel - as a percent of 2019 - is up about 9% from pre-pandemic levels.
The red line is the percent of 2019 for the seven-day average. Air travel - as a percent of 2019 - is up about 9% from pre-pandemic levels.
Policy and 2025 Housing Outlook
by Calculated Risk on 3/24/2025 11:18:00 AM
Today, in the CalculatedRisk Real Estate Newsletter: Policy and 2025 Housing Outlook
Excerpt:
I started the year taking Fed Chair Jerome Powell’s approach to the impact of policy: I’d wait to see what was implemented before changing my outlook.
Now we know a little more. Although there is still significant uncertainty, it appears that tariffs will stay (and likely increase in early April). Deportations will likely pickup. And net legal immigration will slow sharply.
...
Altos Research put out an updated inventory projection last week showing that inventory might end the year at 2019 levels!
If inventory is close to 2019 levels by the end of 2025, and sales remain sluggish, months-of-supply will move up sharply. Sales could pick up if mortgage rates decline, however, if the decline is related to a weaker economy, the increase in unemployment might outweigh any boost from lower mortgage rates.
Note: The pickup in existing home sales in February surprised many analysts (but not readers of this newsletter!). The sales increase in February doesn’t mean sales are recovering, just that analysts underestimated the seasonal adjustment for February, especially this year since there was one fewer working day in February 2025 compared to February 2024. In fact, sales were down YoY.

Housing March 24th Weekly Update: Inventory up 1.9% Week-over-week, Up 30.3% Year-over-year
by Calculated Risk on 3/24/2025 08:11:00 AM
Altos reports that active single-family inventory was up 1.9% week-over-week.
Inventory is now up 7.0% from the seasonal bottom in January and is increasing seasonally.
The first graph shows the seasonal pattern for active single-family inventory since 2015.
 Click on graph for larger image.
The red line is for 2025. The black line is for 2019.
Inventory was up 30.3% compared to the same week in 2024 (last week it was up 29.3%), and down 19.5% compared to the same week in 2019 (last week it was down 20.5%).
The gap to more normal inventory levels has closed significantly!
 This second inventory graph is courtesy of Altos Research.
As of March 21st, inventory was at 668 thousand (7-day average), compared to 656 thousand the prior week.
Mike Simonsen discusses this data regularly on Youtube
Sunday, March 23, 2025
Sunday Night Futures
by Calculated Risk on 3/23/2025 06:51:00 PM
Weekend:
• Schedule for Week of March 23, 2025
Monday:
• At 8:30 AM ET, Chicago Fed National Activity Index for February. This is a composite index of other data.
From CNBC: Pre-Market Data and Bloomberg futures S&P 500 are up 25 and DOW futures are up 160 (fair value).
Oil prices were up over the last week with WTI futures at $68.28 per barrel and Brent at $72.16 per barrel. A year ago, WTI was at $81, and Brent was at $85 - so WTI oil prices are down about 15% year-over-year.
Here is a graph from Gasbuddy.com for nationwide gasoline prices. Nationally prices are at $3.10 per gallon. A year ago, prices were at $3.50 per gallon, so gasoline prices are down $0.40 year-over-year.
The Normal Seasonal Pattern for Median House Prices
by Calculated Risk on 3/23/2025 10:05:00 AM
Last week, in the CalculatedRisk Real Estate Newsletter on March existing home sales, NAR: Existing-Home Sales Increased to 4.26 million SAAR in February; Down 1.2% YoY, I noted:
On a month-over-month basis, median prices increased 1.3% from January and are now down 6.7% from the June 2024 peak. This is about the normal seasonal increase in the median price. Typically, the NAR median price increases in the Spring, and tends to peak seasonally in the June report.Seasonally, median prices typically peak in June (closed sales are mostly for contracts signed in April and May).
And seasonally, prices usually bottom the following January (contracts signed in November and December).
Here is a table of the seasonal percentage increases from January to February, and from January to June (the usual seasonal peak), over the last several years.
The last row shows the seasonal decline from June to January of the following year.
In 2020, prices continued to increase in the 2nd half of the year and didn't peak seasonally until October. And prices only declined slightly in the 2nd half of 2021.
| 2018 | 2019 | 2020 | 2021 | 2022 | 2023 | 2024 | 2025 | |
|---|---|---|---|---|---|---|---|---|
| Jan to Feb | 0.0% | 0.3% | 1.5% | 2.3% | 2.7% | 0.8% | 1.4% | 1.3% |
| Jan to Jun | 13.7% | 14.4% | 10.6% | 20.8% | 16.8% | 13.7% | 12.8% | NA |
| Jun to Jan | -8.9% | -6.7% | 3.1% | -3.4% | -12.8% | -7.7% | -7.8% | NA |
The 2025 increase in median prices from January to February was about the normal seasonal increase.
Normally we'd expect median prices to increase 10% to 12% over the next four months, before declining in the 2nd half of the year. With more inventory, the seasonal pattern will be interesting this year.
Saturday, March 22, 2025
Real Estate Newsletter Articles this Week: Existing-Home Sales Increased to 4.26 million SAAR
by Calculated Risk on 3/22/2025 02:11:00 PM
At the Calculated Risk Real Estate Newsletter this week:
 Click on graph for larger image.
• NAR: Existing-Home Sales Increased to 4.26 million SAAR in February; Down 1.2% YoY
• Housing Starts Increased to 1.501 million Annual Rate in February
• Lennar: "Didn't see typical seasonal pickup after February"
• Lawler: Early Read on Existing Home Sales in February
• California Home Sales Up 2.6% YoY in February; 4th Look at Local Housing Markets
• 3rd Look at Local Housing Markets in February
This is usually published 4 to 6 times a week and provides more in-depth analysis of the housing market.
Schedule for Week of March 23, 2025
by Calculated Risk on 3/22/2025 08:11:00 AM
The key reports scheduled for this week include February New Home sales, the 3rd estimate of Q4 GDP, February Personal Income & Outlays, and January Case-Shiller house prices.
For manufacturing, the March Richmond and Kansas City Fed surveys will be released.
8:30 AM ET: Chicago Fed National Activity Index for February. This is a composite index of other data.
 9:00 AM: S&P/Case-Shiller House Price Index for January.
This graph shows the year-over-year change for the Case-Shiller National, Composite 10 and Composite 20 indexes, through the most recent report (the Composite 20 was started in January 2000).
The consensus is for a 4.6% year-over-year increase in the 20-city index for January, up from 4.5% YoY in December.
9:00 AM: FHFA House Price Index for January. This was originally a GSE only repeat sales, however there is also an expanded index.
 10:00 AM: New Home Sales for February from the Census Bureau.
 This graph shows New Home Sales since 1963. The dashed line is the sales rate for last month.
The consensus is for 680 thousand SAAR, up from 657 thousand in January.
10:00 AM: Richmond Fed Survey of Manufacturing Activity for March.
7:00 AM ET: The Mortgage Bankers Association (MBA) will release the results for the mortgage purchase applications index.
8:30 AM: Durable Goods Orders for February from the Census Bureau. The consensus is for a 0.7% decrease in durable goods orders.
8:30 AM: The initial weekly unemployment claims report will be released. The consensus is for 225 initial claims up from 223 thousand last week.
8:30 AM, Gross Domestic Product, 4th Quarter and Year 2024 (Third Estimate), GDP by Industry, and Corporate Profits. The consensus is that real GDP increased 2.3% annualized in Q4, unchanged from 2.3% in the second estimate.
10:00 AM: Pending Home Sales Index for February.
11:00 AM: the Kansas City Fed manufacturing survey for March.
8:30 AM: Personal Income and Outlays for February. The consensus is for a 0.4% increase in personal income, and for a 0.6% increase in personal spending. And for the Core PCE price index to increase 0.3%. PCE prices are expected to be up 2.5% YoY, and core PCE prices up 2.7% YoY.
10:00 AM: University of Michigan's Consumer sentiment index (Final for March). The consensus is for a reading of 57.9.
10:00 AM: State Employment and Unemployment (Monthly) for February 2025
Friday, March 21, 2025
March 21st COVID Update: COVID Deaths Continue Declining
by Calculated Risk on 3/21/2025 07:28:00 PM
 Note: Mortgage rates are from MortgageNewsDaily.com and are for top tier scenarios.
For deaths, I'm currently using 4 weeks ago for "now", since the most recent three weeks will be revised significantly.
Note: "Effective May 1, 2024, hospitals are no longer required to report COVID-19 hospital admissions, hospital capacity, or hospital occupancy data." So, I'm no longer tracking hospitalizations.
| COVID Metrics | ||||
|---|---|---|---|---|
| Now | Week Ago | Goal | ||
| Deaths per Week | 635 | 692 | ≤3501 | |
| 1my goals to stop weekly posts. 🚩 Increasing number weekly for Deaths. ✅ Goal met. | ||||
 Click on graph for larger image.
This graph shows the weekly (columns) number of deaths reported since Jan 2023.
Although weekly deaths met the original goal to stop posting in June 2023 (low of 314 deaths), I've continued to post since deaths are above the goal again - and I'll continue to post until weekly deaths are once again below the goal.
Weekly deaths are now decreasing following the winter pickup and only double the low last year.
 This appears to be a leading indicator for COVID hospitalizations and deaths. This has mostly moved sideways nationally over the last several weeks. This measure has ticked up in the South and Midwest regions.
Nationally COVID in wastewater is "Moderate", up from "Low" last week according to the CDC.


