 RSS Feed
 by Calculated Risk on 8/31/2024 08:11:00 AM
Saturday, August 31, 2024
Schedule for Week of September 1, 2024
I'll be out of contact from August 20th until Sept 4th.
I'll be back for the August employment report.
The key report this week is the August employment report on Friday.
Other key indicators include the August ISM manufacturing index, August auto sales, and Trade Deficit for July.
All US markets will be closed in observance of the Labor Day holiday.
10:00 AM: ISM Manufacturing Index for August.
10:00 AM: Construction Spending for July.
 All Day: Light vehicle sales for August.
This graph shows light vehicle sales since the BEA started keeping data in 1967. The dashed line is the sales rate for last month.
----- Wednesday, September 4th -----
7:00 AM ET: The Mortgage Bankers Association (MBA) will release the results for the mortgage purchase applications index.
 8:30 AM: Trade Balance report for July from the Census Bureau.
This graph shows the U.S. trade deficit, with and without petroleum, through the most recent report. The blue line is the total deficit, and the black line is the petroleum deficit, and the red line is the trade deficit ex-petroleum products.
10:00 AM: the ISM Services Index for August.
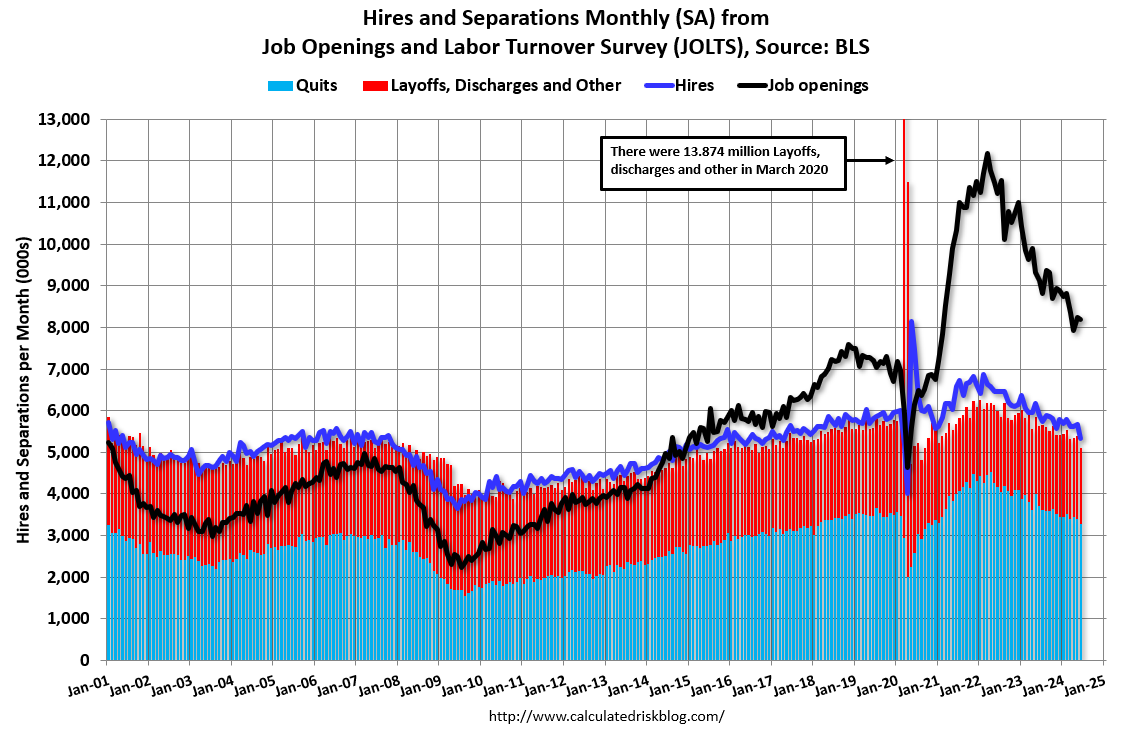
 10:00 AM Job Openings and Labor Turnover Survey for July from the BLS.
This graph shows job openings (yellow line), hires (purple), Layoff, Discharges and other (red column), and Quits (light blue column) from the JOLTS.
Jobs openings decreased in June to 8.18 million from 8.23 million in May.
The number of job openings (black) were down 10% year-over-year and Quits were down 12% year-over-year.
2:00 PM: the Federal Reserve Beige Book, an informal review by the Federal Reserve Banks of current economic conditions in their Districts.
----- Thursday, September 5th -----
8:15 AM: The ADP Employment Report for August. This report is for private payrolls only (no government).
8:30 AM: The initial weekly unemployment claims report will be released.
7:00 AM ET: The Mortgage Bankers Association (MBA) will release the results for the mortgage purchase applications index.
 8:30 AM: Trade Balance report for July from the Census Bureau.
 This graph shows the U.S. trade deficit, with and without petroleum, through the most recent report. The blue line is the total deficit, and the black line is the petroleum deficit, and the red line is the trade deficit ex-petroleum products.
10:00 AM: the ISM Services Index for August.
 10:00 AM Job Openings and Labor Turnover Survey for July from the BLS.
 This graph shows job openings (yellow line), hires (purple), Layoff, Discharges and other (red column), and Quits (light blue column) from the JOLTS.
Jobs openings decreased in June to 8.18 million from 8.23 million in May.
The number of job openings (black) were down 10% year-over-year and Quits were down 12% year-over-year.
2:00 PM: the Federal Reserve Beige Book, an informal review by the Federal Reserve Banks of current economic conditions in their Districts.
8:15 AM: The ADP Employment Report for August. This report is for private payrolls only (no government).
8:30 AM: The initial weekly unemployment claims report will be released.
 8:30 AM: Employment Report for August.
 There were 114,000 jobs added in July, and the unemployment rate was at 4.3%.
This graph shows the jobs added per month since January 2021.
Tuesday, August 27, 2024
From 2007 and 2008: The Compleat UberNerd
by Calculated Risk on 8/27/2024 09:09:00 AM
CR Note: On vacation. I will return on Thursday, Sept 5th (If I don't get lost!)
In December 2006, my friend Doris "Tanta" Dungey started writing for Calculated Risk.
From December 2006, until she passed away from ovarian cancer on Nov 30, 2008, Tanta was my co-blogger. Tanta worked as a mortgage banker for 20 years, and we started chatting in early 2005 about the housing bubble and the changes in lending practices. In 2006, Tanta was diagnosed with late stage cancer, and she took an extended medical leave while undergoing treatment. While on medical leave she wrote for this blog, and her writings received widespread attention and acclaim.
If you want to understand the mortgage industry, read Tanta's posts (here is The Compleat UberNerd and a Compendium of Tanta's Posts).
As an example, here is a brief excerpt from Foreclosure Sales and REO For UberNerds
The following is not an exhaustive discussion of all of the issues involved in foreclosures and REO. It’s a start at unpacking some of the concepts and definitions. We have been seeing, and are going to continue to see, a lot of information presented on foreclosure sales, REO sales, and their impacts on existing home transaction volumes and prices in various market areas. As always with “UberNerd” posts, this is long and excruciating. Proceed with typical motivation as you may consider your own best interest in an open market in blog postings.And an excerpts from Mortgage Servicing for UberNerds
StillLearning asked in the comments about mortgage servicing, and since y’all are nerds, not dummies, here’s my highly-selective occasionally-oversimplified summary for you that skips the boring parts like how your check gets out of the “lockbox” and that stuff. We can discuss extra-credit issues like “excess servicing” and “subservicing” and “SFAS 144 meets MSR” and “negative convexity” and other kinds of inside baseball in the comments. There is a lot that can be said about loan servicing, but let’s start with the basics:Also see In Memoriam: Doris "Tanta" Dungey for photos, links to obituaries in the NY Times, Washington Post and much more.
Servicers have two major types of servicing portfolio: loans they service for themselves and loans they service for other investors. In accounting terms, the “compensation” is the same, meaning that even if you are the noteholder, you pay yourself to service the loans in the same way that an outside investor would pay you, and it shows on the books that way. The differences in compensation stem from the basic fact that one is generally more motivated to do a good job servicing (particularly collecting and efficiently liquidating REO) for one’s own investment than for someone else’s.
Saturday, August 24, 2024
Schedule for Week of August 25, 2024
by Calculated Risk on 8/24/2024 11:53:00 AM
I'll be out of contact from August 20th until Sept 4th.
I'll be back for the August employment report.
The key indicators this week include the second estimate of Q2 GDP, Personal Income and Outlays for July, and Case-Shiller house prices for June.
8:30 AM ET: Chicago Fed National Activity Index for July. This is a composite index of other data.
8:30 AM: Durable Goods Orders for July from the Census Bureau.
10:30 AM: Dallas Fed Survey of Manufacturing Activity for August.
 9:00 AM: S&P/Case-Shiller House Price Index for June.
This graph shows the year-over-year change in the seasonally adjusted National Index, Composite 10 and Composite 20 indexes through the most recent report (the Composite 20 was started in January 2000).
The National index was up 5.9% in May, and is expected to slower further in June.
9:00 AM: FHFA House Price Index for June. This was originally a GSE only repeat sales, however there is also an expanded index.
10:00 AM: Richmond Fed Survey of Manufacturing Activity for August. This is the last of the regional Fed manufacturing surveys for August.
7:00 AM ET: The Mortgage Bankers Association (MBA) will release the results for the mortgage purchase applications index.
8:30 AM: The initial weekly unemployment claims report will be released.
8:30 AM: Gross Domestic Product, 2nd quarter 2024 (second estimate).
10:00 AM: Pending Home Sales Index for July.
8:30 AM: Personal Income and Outlays, July 2024.
9:45 AM: Chicago Purchasing Managers Index for August.
10:00 AM: University of Michigan's Consumer sentiment index (Preliminary for August).
Thursday, August 22, 2024
December 2006: Tanta joined CR!
by Calculated Risk on 8/22/2024 09:01:00 AM
CR Note: On vacation. I will return on Thursday, Sept 5th (If I don't get lost!)
In December 2006, my friend Doris "Tanta" Dungey started writing for Calculated Risk.
When some people say that here are few women bloggers in finance and economics, I remind them that Tanta was the best of all of us!
From December 2006, until she passed away from ovarian cancer on Nov 30, 2008, Tanta was my co-blogger. Tanta worked as a mortgage banker for 20 years, and we started chatting in early 2005 about the housing bubble and the changes in lending practices. In 2006, Tanta was diagnosed with late stage cancer, and she took an extended medical leave while undergoing treatment. While on medical leave she wrote for this blog, and her writings received widespread attention and acclaim.
Here are excerpts from her first two posts:
From December 2006: Let Slip the Dogs of Hell
I still haven’t gotten over the fact that there’s a “capital management” group out there having named itself “Cerberus”. Those of you who were not asleep in Miss Buttkicker’s Intro to Western Civ will recognize Cerberus; the rest of you may have picked up the mythological fix from its reprise as “Fluffy” in the first Harry Potter novel. Wherever you get your culture, Cerberus is the three-headed dog who guards the gates of Hell. It takes three heads to do that, of course, because it’s never clear, in theology or finance, whether the idea is to keep the righteous from falling into the pit or the demons from escaping out of it (the third head is busy meeting with the regulators). Cerberus is relevant not just because it supplies me with today’s metaphor, but because it was the Biggest Dog of three (including Citigroup and Aozora, a Japanese bank) who in April bought a 51% stake in GMAC’s mega-mortgage operation, GM having, of course, once been renowned as one of the Big Three Automakers until it became one of the Big Three Financing Outfits With A Sideline In Cars. I tried to find a link for you to Aozora Bank’s announcement of the purchase, but the only press release I could find for that day involved the loss of customer data. They must have been so busy letting GMAC into the underworld that the dog head keeping the deposit tickets from getting out got distracted.And from December 2006: On Hybrids, Teasers, and Other Mortgage Guidance Problems
...
Now, I’m just a Little Mortgage Weenie, not a Big Finance Dog, but bear with me while I ask some stupid questions. Like: how do the Big Dogs maintain “diverse and flexible production channels” (i.e., little mortgage banker Puppies to sell you correspondent business and little broker Puppies to sell you wholesale business) when “market share currently held by top-tier players” expands to two-thirds (meaning less diverse off-load strategies for the Little Puppies in the “production channels,” putting them at further pipeline/counterparty risk unless they become Bigger Puppies, which makes them competitors instead of “channels,”), while at the same time watching some of the Little Puppies (in whom the Big Dogs have a major equity stake) crawl under the porch to die? I know Citi doesn’t seem to have noticed that the “increased regulatory scrutiny” is not just of “products” but of “wholesale operational/management controls,” but I did.
First of all, a “hybrid ARM” is called a “hybrid” because it is, basically, a cross between a fixed rate and adjustable rate mortgage. Before the early 90s, an “ARM” basically meant a one-year ARM. The initial interest rate was set for one year, and the rate adjusted every year. The only real variations on this theme involved shortening the adjustment frequency: you could get an ARM that adjusted every six months instead of one year.CR Note: If you want to understand the mortgage industry, read Tanta's posts (here is The Compleat UberNerd and a Compendium of Tanta's Posts).
Around the early 90s, the “hybrid ARM” was introduced. It had an initial period in which the rate was “fixed” that didn’t match the subsequent adjustment frequency: this is the classic 3/1, 5/1, 7/1, and even 10/1 ARM. The whole idea of the hybrid ARM was to provide a kind of medium-range risk/reward tradeoff for borrowers and lenders.
Also see In Memoriam: Doris "Tanta" Dungey for photos, links to obituaries in the NY Times, Washington Post and much more.
Monday, August 19, 2024
Calculated Risk on Vacation until Sept 5th
by Calculated Risk on 8/19/2024 07:01:00 PM
I'll be out of contact until Sept 5th.
The key housing reports over the next two weeks are existing home sales on Thursday, New Home sales on Friday, and the Case-Shiller house price index next Tuesday.
Best to all!
LA Port Traffic Increased Sharply Year-over-year in July
by Calculated Risk on 8/19/2024 04:31:00 PM
Container traffic gives us an idea about the volume of goods being exported and imported - and usually some hints about the trade report since LA area ports handle about 40% of the nation's container port traffic.
The following graphs are for inbound and outbound traffic at the ports of Los Angeles and Long Beach in TEUs (TEUs: 20-foot equivalent units or 20-foot-long cargo container).
To remove the strong seasonal component for inbound traffic, the first graph shows the rolling 12-month average.
 Click on graph for larger image.
On a rolling 12-month basis, inbound traffic increased 3.4% in July compared to the rolling 12 months ending in June. Outbound traffic increased 0.7% compared to the rolling 12 months ending the previous month.
The 2nd graph is the monthly data (with a strong seasonal pattern for imports).
 Usually imports peak in the July to October period as retailers import goods for the Christmas holiday, and then decline sharply and bottom in the Winter depending on the timing of the Chinese New Year.
 Usually imports peak in the July to October period as retailers import goods for the Christmas holiday, and then decline sharply and bottom in the Winter depending on the timing of the Chinese New Year.
 Imports were up 47% YoY in July, and exports were up 10% YoY.
In general, it appears port traffic is returning to the pre-pandemic patterns - although this was a very strong July for imports as retailers prepare for holiday shopping.
Lawler: Early Read on Existing Home Sales in July and 3rd Look at Local Housing Markets
by Calculated Risk on 8/19/2024 10:44:00 AM
Today, in the Calculated Risk Real Estate Newsletter: Lawler: Early Read on Existing Home Sales in July and 3rd Look at Local Housing Markets
A brief excerpt:
From housing economist Tom Lawler:There is much more in the article.
Based on publicly-available local realtor/MLS reports released across the country through today, I project that existing home sales as estimated by the National Association of Realtors ran at a seasonally adjusted annual rate of 3.96 million in July, up 1.8% from June’s preliminary pace but down 2.2% from last July’s seasonally adjusted pace.
Unadjusted sales should show an increase from a year ago, with the SA/NSA difference reflecting the higher number of business days this July compared to last July.
Local realtor/MLS reports suggest that the median existing single-family home sales price last month was up by about 3.9% from a year earlier.
CR Note: The National Association of Realtors (NAR) is scheduled to release July Existing Home Sales on Thursday, August 22nd at 10 AM ET. The consensus is for 3.90 million SAAR, up from 3.89 million last month.
...
In July, sales in these markets were up 3.8% YoY. Last month, in June, these same markets were down 12.8% year-over-year Not Seasonally Adjusted (NSA).
Important: There were two more working days in July 2024 compared to July 2023 (22 vs 20), so seasonally adjusted sales will be much lower than the NSA data suggests. This is the opposite of what happened in June.
Sales in all of these markets are down compared to July 2019.
...
More local markets to come!

Housing August 19th Weekly Update: Inventory up 0.8% Week-over-week, Up 40.4% Year-over-year
by Calculated Risk on 8/19/2024 08:12:00 AM
Altos reports that active single-family inventory was up 0.8% week-over-week. Inventory is now up 41.4% from the February seasonal bottom.
 Click on graph for larger image.
This inventory graph is courtesy of Altos Research.
As of August 16th, inventory was at 698 thousand (7-day average), compared to 693 thousand the prior week.
This is the highest level of inventory since June 2020; however, inventory is still well below pre-pandemic levels.

The red line is for 2024. The black line is for 2019.
Inventory was up 40.4% compared to the same week in 2023 (last week it was up 40.5%), and down 26.8% compared to the same week in 2019 (last week it was down 27.5%).
Back in June 2023, inventory was down almost 54% compared to 2019, so the gap to more normal inventory levels is slowly closing.
Mike Simonsen discusses this data regularly on Youtube.
Sunday, August 18, 2024
Sunday Night Futures
by Calculated Risk on 8/18/2024 06:46:00 PM
Weekend:
• Schedule for Week of August 18, 2024
Monday:
• No major economic releases scheduled.
From CNBC: Pre-Market Data and Bloomberg futures S&P 500 are up 6 and DOW futures are up 39 (fair value).
Oil prices were up mostly unchanged over the last week with WTI futures at $76.65 per barrel and Brent at $79.68 per barrel. A year ago, WTI was at $81, and Brent was at $86 - so WTI oil prices are down about 5% year-over-year.
Here is a graph from Gasbuddy.com for nationwide gasoline prices. Nationally prices are at $3.38 per gallon. A year ago, prices were at $3.84 per gallon, so gasoline prices are down $0.43 year-over-year.
Hotels: Occupancy Rate Increased 0.5% Year-over-year
by Calculated Risk on 8/18/2024 09:12:00 AM
The U.S. hotel industry reported positive comparisons year over year, according to CoStar’s latest data through 10 August. ...The following graph shows the seasonal pattern for the hotel occupancy rate using the four-week average.
4-10 August 2024 (percentage change from comparable week in 2023):
• Occupancy: 68.7% (+0.5%)
• Average daily rate (ADR): US$159.49 (+1.4%)
• Revenue per available room (RevPAR): US$109.51 (+1.9%)
emphasis added
 Click on graph for larger image.
The red line is for 2024, blue is the median, and dashed light blue is for 2023. Dashed purple is for 2018, the record year for hotel occupancy.
The 4-week average of the occupancy rate is tracking last year and is below the median rate for the period 2000 through 2023 (Blue).
Note: Y-axis doesn't start at zero to better show the seasonal change.
The 4-week average of the occupancy rate has peaked for 2024, and the average will start declining into the late summer and early Fall.
Saturday, August 17, 2024
Real Estate Newsletter Articles this Week: Housing Starts Decreased to 1.238 million Annual Rate in July
by Calculated Risk on 8/17/2024 02:11:00 PM
At the Calculated Risk Real Estate Newsletter this week:
 Click on graph for larger image.
• Housing Starts: Single Family Down Year-15% over-year in July; Multi-Family Down 18% YoY
• Part 1: Current State of the Housing Market; Overview for mid-August 2024
• Part 2: Current State of the Housing Market; Overview for mid-August 2024
• MBA: Mortgage Delinquencies Increased in Q2 2024
• 2nd Look at Local Housing Markets in July
This is usually published 4 to 6 times a week and provides more in-depth analysis of the housing market.
Schedule for Week of August 18, 2024
by Calculated Risk on 8/17/2024 08:11:00 AM
The key reports this week are July New and Existing Home sales.
Fed Chair Jerome Powell will speak on the "Economic Outlook" at the Jackson Hole Symposium on Friday.
The BLS will release the preliminary employment benchmark revision on Wednesday.
No major economic releases scheduled.
No major economic releases scheduled.
7:00 AM ET: The Mortgage Bankers Association (MBA) will release the results for the mortgage purchase applications index.
10:00 AM: the Bureau of Labor Statistics (BLS) will release the 2024 Preliminary Benchmark Revision to Establishment Survey Data.
During the day: The AIA's Architecture Billings Index for July (a leading indicator for commercial real estate).
2:00 PM: FOMC Minutes, Meeting of July 30-31
8:30 AM: The initial weekly unemployment claims report will be released. The consensus is for 235 thousand initial claims, up from 227 thousand last week.
 10:00 AM: Existing Home Sales for July from the National Association of Realtors (NAR). The consensus is for 3.90 million SAAR, up from 3.89 million last month.
The graph shows existing home sales from 1994 through the report last month.
11:00 AM: the Kansas City Fed manufacturing survey for August.
 10:00 AM: New Home Sales for July from the Census Bureau.
 This graph shows New Home Sales since 1963. The dashed line is the sales rate for last month.
The consensus is for 631 thousand SAAR, up from 617 thousand in June.
Friday, August 16, 2024
August 16th COVID Update: Wastewater Measure Might be Peaking
by Calculated Risk on 8/16/2024 07:31:00 PM
 Note: Mortgage rates are from MortgageNewsDaily.com and are for top tier scenarios.
For deaths, I'm currently using 4 weeks ago for "now", since the most recent three weeks will be revised significantly.
Note: "Effective May 1, 2024, hospitals are no longer required to report COVID-19 hospital admissions, hospital capacity, or hospital occupancy data." So I'm no longer tracking hospitalizations.
| COVID Metrics | ||||
|---|---|---|---|---|
| Now | Week Ago | Goal | ||
| Deaths per Week🚩 | 566 | 473 | ≤3501 | |
| 1my goals to stop weekly posts, 🚩 Increasing number weekly for Deaths ✅ Goal met. | ||||
 Click on graph for larger image.
This graph shows the weekly (columns) number of deaths reported.
Although weekly deaths met the original goal to stop posting, I'm going to continue to post now that deaths are above the goal again.
Weekly deaths are almost double the low of 302 in early June.
 This appears to be a leading indicator for COVID hospitalizations and deaths.
COVID in wastewater turned down in some areas this week - and might be peaking.
Early Q3 GDP Tracking: Low-to-Mid 2%
by Calculated Risk on 8/16/2024 01:33:00 PM
From BofA:
We initiated our 3Q US GDP tracker with the July retail sales print. The 3Q GDP tracking estimate went up from our official forecast of 2.5% q/q saar to 2.6% q/q saar. [August 16th update]From Goldman:
emphasis added
We left our Q3 GDP tracking estimate unchanged at +2.4% (quarter-over-quarter annualized) and our Q3 domestic final sales forecast stands at +2.0%. [August 16th estimate]
 And from the Altanta Fed: GDPNow
 The GDPNow model estimate for real GDP growth (seasonally adjusted annual rate) in the third quarter of 2024 is 2.0 percent on August 16th.
Housing Starts: Single Family Down Year-15% over-year in July; Multi-Family Down 18% YoY
by Calculated Risk on 8/16/2024 09:28:00 AM
Today, in the Calculated Risk Real Estate Newsletter: Housing Starts: Single Family Down Year-15% over-year in July; Multi-Family Down 18% YoY
A brief excerpt:
Total housing starts in July were below expectations and starts in May and June were revised down. A very weak report.There is much more in the article.
The third graph shows the month-to-month comparison for total starts between 2023 (blue) and 2024 (red).
Total starts were down 16.0% in July compared to July 2023.
The YoY decline in total starts was due to a sharp YoY decrease in both multi-family and single-family starts. Single family starts had been up YoY for 12 consecutive months, although with the revisions, single-family starts in May were down slightly year-over-year.

Housing Starts Decreased to 1.238 million Annual Rate in July
by Calculated Risk on 8/16/2024 08:30:00 AM
From the Census Bureau: Permits, Starts and Completions
Housing Starts:
Privately-owned housing starts in July were at a seasonally adjusted annual rate of 1,238,000. This is 6.8 percent below the revised June estimate of 1,329,000 and is 16.0 percent below the July 2023 rate of 1,473,000. Single-family housing starts in July were at a rate of 851,000; this is 14.1 percent below the revised June figure of 991,000. The July rate for units in buildings with five units or more was 363,000.
Building Permits:
Privately-owned housing units authorized by building permits in July were at a seasonally adjusted annual rate of 1,396,000. This is 4.0 percent below the revised June rate of 1,454,000 and is 7.0 percent below the July 2023 rate of 1,501,000. Single-family authorizations in July were at a rate of 938,000; this is 0.1 percent below the revised June figure of 939,000. Authorizations of units in buildings with five units or more were at a rate of 408,000 in July.
emphasis added
Click on graph for larger image.The first graph shows single and multi-family housing starts since 2000.
Multi-family starts (blue, 2+ units) increased in July compared to June. Multi-family starts were down 18.3% year-over-year.
Single-family starts (red) decreased in July and were 14.8% year-over-year.
 The second graph shows single and multi-family housing starts since 1968.
 This shows the huge collapse following the housing bubble, and then the eventual recovery - and the recent collapse and recovery in single-family starts.
Total housing starts in July were below expectations and starts in May and June were revised down. A very weak report.
I'll have more later …
Thursday, August 15, 2024
Friday: Housing Starts
by Calculated Risk on 8/15/2024 07:20:00 PM
 Note: Mortgage rates are from MortgageNewsDaily.com and are for top tier scenarios.
Thursday:
• At 8:30 AM ET, Housing Starts for July. The consensus is for 1.342 million SAAR, down from 1.353 million SAAR in June.
• At 10:00 AM, State Employment and Unemployment (Monthly) for July 2024
• At 10:00 AM, University of Michigan's Consumer sentiment index (Preliminary for August)
Realtor.com Reports Active Inventory Up 35.5% YoY
by Calculated Risk on 8/15/2024 04:30:00 PM
What this means: On a weekly basis, Realtor.com reports the year-over-year change in active inventory and new listings. On a monthly basis, they report total inventory. For July, Realtor.com reported inventory was up 36.6% YoY, but still down 30.6% compared to April 2017 to 2019 levels.
Now - on a weekly basis - inventory is up 35.5% YoY.
Realtor.com has monthly and weekly data on the existing home market. Here is their weekly report: Weekly Housing Trends View—Data for Week Ending August 10, 2024 Here is a graph of the year-over-year change in inventory according to realtor.com.
Inventory was up year-over-year for the 40th consecutive week.
Realtor.com has monthly and weekly data on the existing home market. Here is their weekly report: Weekly Housing Trends View—Data for Week Ending August 10, 2024
• Active inventory increased, with for-sale homes 35.5% above year-ago levels.
For the 40th week in a row, the number of for-sale homes grew compared with one year ago. While the gap with last year has generally been increasing, helping propel inventory to a post-pandemic high in July, this past week the rise was 35.5%, slightly more modest than the rate observed in the prior week..
• New listings–a measure of sellers putting homes up for sale-dipped this week by 2.2% from one year ago.
Despite mortgage rates dropping to their lowest level in over a year, sellers continued to show negative sentiment, leading to a yearly decline in new listings for a second week in a row.
 Here is a graph of the year-over-year change in inventory according to realtor.com.
 Inventory was up year-over-year for the 40th consecutive week.
However, inventory is still historically low.
New listings remain below typical pre-pandemic levels.
MBA: Mortgage Delinquencies Increased in Q2 2024
by Calculated Risk on 8/15/2024 12:57:00 PM
Today, in the Calculated Risk Real Estate Newsletter: MBA: Mortgage Delinquencies Increased in Q2 2024
A brief excerpt:
From the MBA: Mortgage Delinquencies Increase in the Second Quarter of 2024There is much more in the article.The delinquency rate for mortgage loans on one-to-four-unit residential properties increased to a seasonally adjusted rate of 3.97 percent of all loans outstanding at the end of the second quarter of 2024, according to the Mortgage Bankers Association’s (MBA) National Delinquency Survey.The following graph shows the percent of loans delinquent by days past due. Overall delinquencies increased in Q2. The sharp increase in 2020 in the 90-day bucket was due to loans in forbearance (included as delinquent, but not reported to the credit bureaus).
The percent of loans in the foreclosure process decreased year-over-year from 0.53 percent in Q2 2023 to 0.43 percent in Q2 2024 (red) and remains historically low.
...
The primary concern is the increase in 30- and 60-day delinquency rates, and even though the rate is historically low, it has increased from 2.30% in Q2 2023 to 2.96% in Q2 2024. I don’t think this increase is much of a worry, but it is something to watch.

NAHB: Builder Confidence Declined in August
by Calculated Risk on 8/15/2024 10:00:00 AM
The National Association of Home Builders (NAHB) reported the housing market index (HMI) was at 39, down from 41 last month. Any number below 50 indicates that more builders view sales conditions as poor than good.
From the NAHB: Builder Confidence Moves Lower as Market Waits for Rate Cuts
A lack of affordability and buyer hesitation stemming from elevated interest rates and high home prices contributed to a decline in builder sentiment in August.
Builder confidence in the market for newly built single-family homes was 39 in August, down two points from a downwardly revised reading of 41 in July, according to the National Association of Home Builders (NAHB)/Wells Fargo Housing Market Index (HMI) released today. This is the lowest reading since December 2023.
“Challenging housing affordability conditions remain the top concern for prospective home buyers in the current reading of the HMI, as both present sales and traffic readings showed weakness,” said NAHB Chairman Carl Harris, a custom home builder from Wichita, Kan. “The only sustainable way to effectively tame high housing costs is to implement policies that allow builders to construct more attainable, affordable housing.”
Almost three-quarters of the responses to the August HMI were collected during the first week of the month when interest rates averaged 6.73%, according to Freddie Mac. Mortgage rates declined notably the following week to 6.47%, the lowest reading since May 2023.
“With current inflation data pointing to interest rate cuts from the Federal Reserve and mortgage rates down markedly in the second week of August, buyer interest and builder sentiment should improve in the months ahead,” said NAHB Chief Economist Robert Dietz.
The August HMI survey also revealed that 33% of builders cut home prices to bolster sales in August, above the July rate of 31% and the highest share in all of 2024. However, the average price reduction in August held steady at 6% for the 14th straight month. Meanwhile, the use of sales incentives increased to 64% in August from 61% in July, and this was the highest level since April 2019.
...
The HMI index charting current sales conditions in August fell two points to 44 and the gauge charting traffic of prospective buyers also declined by two points to 25. The component measuring sales expectations in the next six months increased one point to 49.
Looking at the three-month moving averages for regional HMI scores, the Northeast fell four points to 52, the Midwest dropped four points to 39, the South decreased two points to 42 and the West held steady at 37.
emphasis added
 Click on graph for larger image.
This graph shows the NAHB index since Jan 1985.
This was below the consensus forecast.
Industrial Production Decreased 0.6% in July
by Calculated Risk on 8/15/2024 09:15:00 AM
From the Fed: Industrial Production and Capacity Utilization
Industrial production fell 0.6 percent in July after increasing 0.3 percent in June. Early July shutdowns concentrated in the petrochemical and related industries due to Hurricane Beryl held down the growth of industrial production by an estimated 0.3 percentage point. Manufacturing output stepped down 0.3 percent as the index for motor vehicles and parts fell nearly 8 percent; manufacturing excluding motor vehicles and parts rose 0.3 percent. The index for mining moved sideways while the index for utilities decreased 3.7 percent. At 102.9 percent of its 2017 average, total industrial production in July was 0.2 percent below its year-earlier level. Capacity utilization moved down to 77.8 percent in July, a rate that is 1.9 percentage points below its long-run (1972–2023) average.
emphasis added
 Click on graph for larger image.
This graph shows Capacity Utilization. This series is up from the record low set in April 2020, and above the level in February 2020 (pre-pandemic).
Capacity utilization at 77.8% is 1.9% below the average from 1972 to 2022. This was below consensus expectations.
Note: y-axis doesn't start at zero to better show the change.
 The second graph shows industrial production since 1967.
Industrial production decreased to 102.9. This is above the pre-pandemic level.
Industrial production was below consensus expectations.
Retail Sales Increased 1.0% in July
by Calculated Risk on 8/15/2024 08:40:00 AM
On a monthly basis, retail sales increased 1.0% from June to July (seasonally adjusted), and sales were up 2.7 percent from July 2023.
From the Census Bureau report:
Advance estimates of U.S. retail and food services sales for July 2024, adjusted for seasonal variation and holiday and trading-day differences, but not for price changes, were $709.7 billion, an increase of 1.0% from the previous month, and up 2.7 percent from July 2023. ... The May 2024 to June 2024 percent change was revised from virtually unchanged to down 0.2 percent.
emphasis added
 Click on graph for larger image.
This graph shows retail sales since 1992. This is monthly retail sales and food service, seasonally adjusted (total and ex-gasoline).
Retail sales ex-gasoline were up 1.0% in July.
The second graph shows the year-over-year change in retail sales and food service (ex-gasoline) since 1993.
Retail and Food service sales, ex-gasoline, increased by 2.9% on a YoY basis.
 The change in sales in July was above expectations, however sales in May and June were revised down.
Weekly Initial Unemployment Claims Decrease to 227,000
by Calculated Risk on 8/15/2024 08:30:00 AM
The DOL reported:
In the week ending August 10, the advance figure for seasonally adjusted initial claims was 227,000, a decrease of 7,000 from the previous week's revised level. The previous week's level was revised up by 1,000 from 233,000 to 234,000. The 4-week moving average was 236,500, a decrease of 4,500 from the previous week's revised average. The previous week's average was revised up by 250 from 240,750 to 241,000.The following graph shows the 4-week moving average of weekly claims since 1971.
emphasis added
 Click on graph for larger image.
The dashed line on the graph is the current 4-week average. The four-week average of weekly unemployment claims decreased to 236,500.
The previous week was revised up.
Weekly claims were lower than the consensus forecast.
Wednesday, August 14, 2024
Thursday: Retail Sales, Unemployment Claims, Industrial Production, Homebuilder Survey
by Calculated Risk on 8/14/2024 07:22:00 PM
 Note: Mortgage rates are from MortgageNewsDaily.com and are for top tier scenarios.
Thursday:
• At 8:30 AM ET, The initial weekly unemployment claims report will be released. The consensus is for 238 thousand initial claims, up from 233 thousand last week.
• Also at 8:30 AM, Retail sales for July is scheduled to be released. The consensus is for 0.3% increase in retail sales.
• Also at 8:30 AM, The New York Fed Empire State manufacturing survey for August. The consensus is for a reading of -6.0, up from -6.6.
• Also at 8:30 AM, the Philly Fed manufacturing survey for August. The consensus is for a reading of 6.5, down from 14.0.
• At 9:15 AM, The Fed will release Industrial Production and Capacity Utilization for July. The consensus is for a 0.1% increase in Industrial Production, and for Capacity Utilization to decrease to 78.7%.
• At 10:00 AM, The August NAHB homebuilder survey. The consensus is for a reading of 42, unchanged from 42. Any number below 50 indicates that more builders view sales conditions as poor than good.
Cleveland Fed: Median CPI increased 0.3% and Trimmed-mean CPI increased 0.2% in July
by Calculated Risk on 8/14/2024 02:58:00 PM
The Cleveland Fed released the median CPI and the trimmed-mean CPI.
According to the Federal Reserve Bank of Cleveland, the median Consumer Price Index rose 0.3% in July. The 16% trimmed-mean Consumer Price Index increased 0.2%. "The median CPI and 16% trimmed-mean CPI are measures of core inflation calculated by the Federal Reserve Bank of Cleveland based on data released in the Bureau of Labor Statistics’ (BLS) monthly CPI report".
 Click on graph for larger image.
This graph shows the year-over-year change for these four key measures of inflation.
Note: The Cleveland Fed released the median CPI details. Fuel oil and other fuels increased at a 25% annual rate in July.
According to the Federal Reserve Bank of Cleveland, the median Consumer Price Index rose 0.3% in July. The 16% trimmed-mean Consumer Price Index increased 0.2%. "The median CPI and 16% trimmed-mean CPI are measures of core inflation calculated by the Federal Reserve Bank of Cleveland based on data released in the Bureau of Labor Statistics’ (BLS) monthly CPI report".
 Click on graph for larger image.
This graph shows the year-over-year change for these four key measures of inflation.
On a year-over-year basis, the median CPI rose 4.3% (up from 4.2% in June), the trimmed-mean CPI rose 3.2% (down from 3.3%), and the CPI less food and energy rose 3.3% (unchanged from 3.3%).
Core PCE is for July was up 2.6% YoY, unchanged from 2.6% in June.
Note: The Cleveland Fed released the median CPI details. Fuel oil and other fuels increased at a 25% annual rate in July.
Rent and Owner's equivalent rent are still high, and if we exclude rent, median CPI would be around 1.5% month-over-month, annualized.
Early Look at 2025 Cost-Of-Living Adjustments and Maximum Contribution Base
by Calculated Risk on 8/14/2024 01:37:00 PM
The BLS reported this morning:
The Consumer Price Index for Urban Wage Earners and Clerical Workers (CPI-W) increased 2.9 percent over the last 12 months to an index level of 308.501 (1982-84=100). For the month, the index increased 0.1 percent prior to seasonal adjustment.CPI-W is the index that is used to calculate the Cost-Of-Living Adjustments (COLA). The calculation dates have changed over time (see Cost-of-Living Adjustments), but the current calculation uses the average CPI-W for the three months in Q3 (July, August, September) and compares to the average for the highest previous average of Q3 months. Note: this is not the headline CPI-U and is not seasonally adjusted (NSA).
• In 2023, the Q3 average of CPI-W was 301.236.
The 2023 Q3 average was the highest Q3 average, so we only have to compare Q3 this year to last year.
 Click on graph for larger image.
This graph shows CPI-W since January 2000. The red lines are the Q3 average of CPI-W for each year.
Note: The year labeled is for the calculation, and the adjustment is effective for December of that year (received by beneficiaries in January of the following year).
CPI-W was up 2.9% year-over-year in July, and although this is early - we need the data for July, August and September - my early guess is COLA will probably be around 2.4% this year, the smallest increase since 1.3% in 2021.
Contribution and Benefit Base
The contribution base will be adjusted using the National Average Wage Index. This is based on a one-year lag. The National Average Wage Index is not available for 2023 yet, although we know wages increased solidly in 2023. If wages increased 5% in 2023, then the contribution base next year will increase to around $177,000 in 2025, from the current $168,600.
Remember - this is an early look. What matters is average CPI-W, NSA, for all three months in Q3 (July, August and September).
Part 2: Current State of the Housing Market; Overview for mid-August 2024
by Calculated Risk on 8/14/2024 10:21:00 AM
Today, in the Calculated Risk Real Estate Newsletter: Part 2: Current State of the Housing Market; Overview for mid-August 2024
A brief excerpt:
Yesterday, in Part 1: Current State of the Housing Market; Overview for mid-August 2024 I reviewed home inventory, housing starts and sales.There is much more in the article.
In Part 2, I will look at house prices, mortgage rates, rents and more.
...
Other measures of house prices suggest prices will be up less YoY in the June Case-Shiller index than in the May report. The NAR reported median prices were up 4.1% YoY in June, down from 5.2% YoY in May.
ICE reported prices were up 4.1% YoY in June, down from 4.7% YoY in May, and Freddie Mac reported house prices were up 5.2% YoY in June, down from 5.7% YoY in May.
Here is a comparison of year-over-year change in the FMHPI, median house prices from the NAR, and the Case-Shiller National index.
The FMHPI and the NAR median prices appear to be leading indicators for Case-Shiller. Based on recent monthly data, and the FMHPI, the YoY change in the Case-Shiller index will likely be lower YoY in June compared to May.

YoY Measures of Inflation: Services, Goods and Shelter
by Calculated Risk on 8/14/2024 08:49:00 AM
Here are a few measures of inflation:
The first graph is the one Fed Chair Powell had mentioned when services less rent of shelter was up around 8% year-over-year. This declined and is now up 4.6% YoY.
 Click on graph for larger image.
This graph shows the YoY price change for Services and Services less rent of shelter through July 2024.
Services were up 4.9% YoY as of July 2024, down from 5.0% YoY in June.
Services less rent of shelter was up 4.6% YoY in July, down from 4.8% YoY in June.
Services less rent of shelter was up 4.6% YoY in July, down from 4.8% YoY in June.
 The second graph shows that goods prices started to increase year-over-year (YoY) in 2020 and accelerated in 2021 due to both strong demand and supply chain disruptions.
Durables were at -4.1% YoY as of July 2024, down from -4.1% YoY in June.
Commodities less food and energy commodities were at -1.7% YoY in July, unchanged from -1.7% YoY in June.
Commodities less food and energy commodities were at -1.7% YoY in July, unchanged from -1.7% YoY in June.
 Here is a graph of the year-over-year change in shelter from the CPI report (through July) and housing from the PCE report (through June)
Shelter was up 5.0% year-over-year in July, down from 5.1% in June. Housing (PCE) was up 5.3% YoY in June, down from 5.5% in May.
The BLS noted: "The index for shelter rose 0.4 percent in July, accounting for nearly 90 percent of the monthly increase in the all items index."
This is still catching up with private data.
Core CPI ex-shelter was up 1.8% YoY in July, unchanged from 1.8% in June.
BLS: CPI Increased 0.2% in July; Core CPI increased 0.2%
by Calculated Risk on 8/14/2024 08:30:00 AM
The Consumer Price Index for All Urban Consumers (CPI-U) increased 0.2 percent on a seasonally adjusted basis, after declining 0.1 percent in June, the U.S. Bureau of Labor Statistics reported today. Over the last 12 months, the all items index increased 2.9 percent before seasonal adjustment.The change in both CPI and core CPI were close to expectations. I'll post a graph later today after the Cleveland Fed releases the median and trimmed-mean CPI.
The index for shelter rose 0.4 percent in July, accounting for nearly 90 percent of the monthly increase in the all items index. The energy index was unchanged over the month, after declining in the two preceding months. The index for food increased 0.2 percent in July, as it did in June. The food away from home index rose 0.2 percent over the month, and the food at home index increased 0.1 percent.
The index for all items less food and energy rose 0.2 percent in July, after rising 0.1 percent the preceding month. Indexes which increased in July include shelter, motor vehicle insurance, household furnishings and operations, education, recreation, and personal care. The indexes for used cars and trucks, medical care, airline fares, and apparel were among those that decreased over the month.
The all items index rose 2.9 percent for the 12 months ending July, the smallest 12-month increase since March 2021. The all items less food and energy index rose 3.2 percent over the last 12 months and was the smallest 12-month increase in that index since April 2021. The energy index increased 1.1 percent for the 12 months ending July. The food index increased 2.2 percent over the last year.
emphasis added
MBA: Mortgage Applications Increased in Weekly Survey
by Calculated Risk on 8/14/2024 07:00:00 AM
From the MBA: Mortgage Applications Increase in Latest MBA Weekly Survey
Mortgage applications increased 16.8 percent from one week earlier, according to data from the Mortgage Bankers Association’s (MBA) Weekly Applications Survey for the week ending August 9, 2024.
The Market Composite Index, a measure of mortgage loan application volume, increased 16.8 percent on a seasonally adjusted basis from one week earlier. On an unadjusted basis, the Index increased 15 percent compared with the previous week. The Refinance Index increased 35 percent from the previous week and was 118 percent higher than the same week one year ago. The seasonally adjusted Purchase Index increased 3 percent from one week earlier. The unadjusted Purchase Index increased 2 percent compared with the previous week and was 8 percent lower than the same week one year ago.
“Rates on both 30- and 15-year fixed rate mortgages decreased for the second consecutive week, and combined with the previous week’s rate moves, spurred another strong week for application activity as borrowers with higher rates took the opportunity to refinance,” said Joel Kan, MBA’s Vice President and Deputy Chief Economist. “Overall applications increased almost 17 percent to the highest level since January 2023, driven by a 35 percent increase in refinance applications. The refinance index also saw its strongest week since May 2022 and was 117 percent higher than a year ago, driven by gains in conventional, FHA, and VA applications. Additionally, purchase applications increased by 3 percent, with small gains seen across the various loan types, indicating that prospective homebuyers are slowly reentering the market.”
...
The average contract interest rate for 30-year fixed-rate mortgages with conforming loan balances ($766,550 or less) decreased to 6.54 percent from 6.55 percent, with points decreasing to 0.57 from 0.58 (including the origination fee) for 80 percent loan-to-value ratio (LTV) loans.
emphasis added
 Click on graph for larger image.
The first graph shows the MBA mortgage purchase index.
According to the MBA, purchase activity is down 8% year-over-year unadjusted.
Red is a four-week average (blue is weekly).
Purchase application activity is up about 10% from the lows in late October 2023, but still below the lowest levels during the housing bust.

The second graph shows the refinance index since 1990.
With higher mortgage rates, the refinance index declined sharply in 2022 - and mostly flat lined for two years - but has increased recently as mortgage rates declined.
Tuesday, August 13, 2024
Wednesday: CPI
by Calculated Risk on 8/13/2024 07:14:00 PM
 Note: Mortgage rates are from MortgageNewsDaily.com and are for top tier scenarios.
Wednesday:
• At 7:00 AM ET, The Mortgage Bankers Association (MBA) will release the results for the mortgage purchase applications index.
• At 8:30 AM, The Consumer Price Index for July from the BLS. The consensus is for a 0.2% increase in CPI, and a 0.2% increase in core CPI. The consensus is for CPI to be up 3.0% year-over-year and core CPI to be up 3.2% YoY.
Summer Teen Employment
by Calculated Risk on 8/13/2024 03:52:00 PM
Here is a look at the change in teen employment over time.
The graph below shows the employment-population ratio for teens (16 to 19 years old) since 1948.
The graph is Not Seasonally Adjusted (NSA), to show the seasonal hiring of teenagers during the summer.
A few observations:
1) Although teen employment has recovered some since the great recession, overall teen employment had been trending down. This is probably because more people are staying in school (a long term positive for the economy).
2) Teen employment was significantly impacted in 2020 by the pandemic.
 Click on graph for larger image.
3) A smaller percentage of teenagers are obtaining summer employment. The seasonal spikes are smaller than in previous decades.
The teen employment-population ratio was 37.9% in July 2024, down from 38.0% in July 2023. The teen participation rate was 43.6% in July 2024, up from 43.1% the previous July.
This has pushed the teen unemployment rate (NSA) up to 13.2% from 12.0% in July 2023.
So, a smaller percentage of teenagers are joining the labor force during the summer as compared to previous years. This could be because of fewer employment opportunities, or because teenagers are pursuing other activities during the summer.
The decline in teenager participation is one of the reasons the overall participation rate has declined (of course, the retiring baby boomers is the main reason the overall participation rate has declined over the last 20+ years).
The decline in teenager participation is one of the reasons the overall participation rate has declined (of course, the retiring baby boomers is the main reason the overall participation rate has declined over the last 20+ years).
Fannie "Real Estate Owned" inventory Decreased 10% in Q2 2024
by Calculated Risk on 8/13/2024 12:01:00 PM
Fannie reported results for Q2 2024. Here is some information on single-family Real Estate Owned (REOs).
Fannie Mae reported the number of REOs decreased to 7,179 at the end of Q2 2024, down 10% from 7,971 at the end of the previous quarter, and down 17% year-over-year from Q2 2023.
For Fannie, this is down 96% from the 166,787 peak number of REOs in Q3 2010.
 Click on graph for larger image.
Here is a graph of Fannie Real Estate Owned (REO).
This is well below the normal level of REOs for Fannie, and there will not be a huge wave of foreclosures.
 Click on graph for larger image.
Here is a graph of Fannie Real Estate Owned (REO).
This is well below the normal level of REOs for Fannie, and there will not be a huge wave of foreclosures.
Part 1: Current State of the Housing Market; Overview for mid-August 2024
by Calculated Risk on 8/13/2024 08:48:00 AM
Today, in the Calculated Risk Real Estate Newsletter: Part 1: Current State of the Housing Market; Overview for mid-August 2024
A brief excerpt:
This 2-part overview for mid-August provides a snapshot of the current housing market.There is much more in the article.
I always focus first on inventory, since inventory usually tells the tale!
...
Here is a graph of new listing from Realtor.com’s July 2024 Monthly Housing Market Trends Report showing new listings were up 3.6% year-over-year in June. New listings are still well below pre-pandemic levels. From Realtor.com:
Sellers continued to list their homes in higher numbers this July as newly listed homes were 3.6% above last year’s levels but substantially less than June’s figure of 6.3%. This marks the ninth month of increasing listing activity after a 17-month streak of decline.Note the seasonality for new listings. December and January are seasonally the weakest months of the year for new listings, followed by February and November. New listings will be up year-over-year in 2024, but still below normal levels.
There are always people that need to sell due to the so-called 3 D’s: Death, Divorce, and Disease. Also, in certain times, some homeowners will need to sell due to unemployment or excessive debt (neither is much of an issue right now).
And there are homeowners who want to sell for a number of reasons: upsizing (more babies), downsizing, moving for a new job, or moving to a nicer home or location (move-up buyers). It is some of the “want to sell” group that has been locked in with the golden handcuffs over the last couple of years, since it is financially difficult to move when your current mortgage rate is around 3%, and your new mortgage rate will around 6.5%.
But time is a factor for this “want to sell” group, and eventually some of them will take the plunge. That is probably why we are seeing more new listings now.

Monday, August 12, 2024
Tuesday: PPI
by Calculated Risk on 8/12/2024 07:10:00 PM
 From Matthew Graham at Mortgage News Daily: Mortgage Rates Effectively Unchanged to Begin New Week
Today was completely different than the previous Monday in that it was a normal, boring day with essentially no change in mortgage rates over the weekend.Tuesday:
...
This could change in the coming days as important new economic reports are released. Wednesday's Consumer Price Index (CPI) is the biggest deal, but tomorrow's Producer Price Index (PPI) could play a supporting role. [30 year fixed 6.55%]
emphasis added
• At 6:00 AM ET, NFIB Small Business Optimism Index for July.
8:30 AM, The Producer Price Index for July from the BLS. The consensus is for a 0.2% increase in PPI, and a 0.2% increase in core PPI.
CPI Previews
by Calculated Risk on 8/12/2024 02:16:00 PM
The key economic report this week is July CPI to be released on Wednesday. The consensus is for a 0.2% increase in CPI, and a 0.2% increase in core CPI. The consensus is for CPI to be up 3.0% year-over-year and core CPI to be up 3.2% YoY.
From BofA:
We forecast headline CPI rose by 0.3% m/m in July, owing mainly to a pickup in core services inflation and energy prices. This would leave the y/y rate unchanged at 3.0%. Meanwhile, we expect core CPI increased by 0.2% m/m. While this is not quite as low as June, it is in line with prior trend in deflation and should meet the Fed's benchmark for beginning rate cuts in September.From Goldman:
We forecast a 0.16% increase (vs. 0.2% consensus) in core CPI prices in July.
We estimate a 0.17% rise in headline CPI, reflecting higher food (+0.15%) and energy (+0.4%) prices.
2nd Look at Local Housing Markets in July
by Calculated Risk on 8/12/2024 11:12:00 AM
Today, in the Calculated Risk Real Estate Newsletter: 2nd Look at Local Housing Markets in July
A brief excerpt:
NOTE: The tables for active listings, new listings and closed sales all include a comparison to July 2019 for each local market (some 2019 data is not available).There is much more in the article.
This is the second look at local markets in July. I’m tracking over 40 local housing markets in the US. Some of the 40 markets are states, and some are metropolitan areas. I’ll update these tables throughout the month as additional data is released.
Closed sales in July were mostly for contracts signed in May and June when 30-year mortgage rates averaged 7.06% and 6.92%, respectively (Freddie Mac PMMS).
...
In July, sales in these markets were up 4.8% YoY. Last month, in June, these same markets were down 10.9% year-over-year Not Seasonally Adjusted (NSA).
Important: There were two more working days in July 2024 compared to July 2023 (22 vs 20), so seasonally adjusted sales will be much lower than the NSA data suggests. This is the opposite of what happened in June.
Sales in all of these markets are down significantly compared to July 2019.
...
Many more local markets to come!

Housing August 12th Weekly Update: Inventory up 1.3% Week-over-week, Up 40.5% Year-over-year
by Calculated Risk on 8/12/2024 08:12:00 AM
Altos reports that active single-family inventory was up 1.3% week-over-week. Inventory is now up 40.2% from the February seasonal bottom.
 Click on graph for larger image.
This inventory graph is courtesy of Altos Research.
As of August 9th, inventory was at 693 thousand (7-day average), compared to 684 thousand the prior week.
This is the highest level of inventory since June 2020; however, inventory is still well below pre-pandemic levels.

The red line is for 2024. The black line is for 2019.
Inventory was up 40.5% compared to the same week in 2023 (last week it was up 39.9%), and down 27.5% compared to the same week in 2019 (last week it was down 28.9%).
Back in June 2023, inventory was down almost 54% compared to 2019, so the gap to more normal inventory levels is slowly closing.
Mike Simonsen discusses this data regularly on Youtube.
Sunday, August 11, 2024
Sunday Night Futures
by Calculated Risk on 8/11/2024 06:49:00 PM
Weekend:
• Schedule for Week of August 11, 2024
Monday:
• No major economic releases scheduled.
From CNBC: Pre-Market Data and Bloomberg futures S&P 500 are down 10 and DOW futures are down 66 (fair value).
Oil prices were up over the last week with WTI futures at $76.84 per barrel and Brent at $79.66 per barrel. A year ago, WTI was at $83, and Brent was at $88 - so WTI oil prices are down about 7% year-over-year.
Here is a graph from Gasbuddy.com for nationwide gasoline prices. Nationally prices are at $3.41 per gallon. A year ago, prices were at $3.82 per gallon, so gasoline prices are down $0.41 year-over-year.


