 RSS Feed
 by Calculated Risk on 7/31/2024 07:16:00 PM
Wednesday, July 31, 2024
Thursday: Unemployment Claims, ISM Mfg, Construction Spending, Vehicle Sales
 Note: Mortgage rates are from MortgageNewsDaily.com and are for top tier scenarios.
Thursday:
• At 8:30 AM ET, The initial weekly unemployment claims report will be released. The consensus is for 230 thousand initial claims, down from 235 thousand last week.
• At 10:00 AM, ISM Manufacturing Index for July. The consensus is for the ISM to be at 49.0, up from 48.5 in June.
• At 10:00 AM, Construction Spending for June. The consensus is for a 0.2% increase in construction spending.
• Late, Light vehicle sales for July from the BEA. The consensus is for light vehicle sales to be 16.2 million SAAR in July, up from 15.3 million in June (Seasonally Adjusted Annual Rate).
FOMC Statement: No Change to Fed Funds Rate
by Calculated Risk on 7/31/2024 02:00:00 PM
Fed Chair Powell press conference video here or on YouTube here, starting at 2:30 PM ET.
FOMC Statement:
Recent indicators suggest that economic activity has continued to expand at a solid pace. Job gains have moderated, and the unemployment rate has moved up but remains low. Inflation has eased over the past year but remains somewhat elevated. In recent months, there has been some further progress toward the Committee's 2 percent inflation objective.
The Committee seeks to achieve maximum employment and inflation at the rate of 2 percent over the longer run. The Committee judges that the risks to achieving its employment and inflation goals continue to move into better balance. The economic outlook is uncertain, and the Committee is attentive to the risks to both sides of its dual mandate.
In support of its goals, the Committee decided to maintain the target range for the federal funds rate at 5-1/4 to 5-1/2 percent;. In considering any adjustments to the target range for the federal funds rate, the Committee will carefully assess incoming data, the evolving outlook, and the balance of risks. The Committee does not expect it will be appropriate to reduce the target range until it has gained greater confidence that inflation is moving sustainably toward 2 percent. In addition, the Committee will continue reducing its holdings of Treasury securities and agency debt and agency mortgage‑backed securities. The Committee is strongly committed to returning inflation to its 2 percent objective.
In assessing the appropriate stance of monetary policy, the Committee will continue to monitor the implications of incoming information for the economic outlook. The Committee would be prepared to adjust the stance of monetary policy as appropriate if risks emerge that could impede the attainment of the Committee's goals. The Committee's assessments will take into account a wide range of information, including readings on labor market conditions, inflation pressures and inflation expectations, and financial and international developments.
Voting for the monetary policy action were Jerome H. Powell, Chair; John C. Williams, Vice Chair; Thomas I. Barkin; Michael S. Barr; Raphael W. Bostic; Michelle W. Bowman; Lisa D. Cook; Mary C. Daly; Austan D. Goolsbee; Philip N. Jefferson; Adriana D. Kugler; and Christopher J. Waller. Austan D. Goolsbee voted as an alternate member at this meeting.
emphasis added
Freddie Mac House Price Index Increased Slightly in June; Up 5.1% Year-over-year
by Calculated Risk on 7/31/2024 10:51:00 AM
Today, in the Calculated Risk Real Estate Newsletter: Freddie Mac House Price Index Increased Slightly in June; Up 5.1% Year-over-year
A brief excerpt:
Freddie Mac reported that its “National” Home Price Index (FMHPI) increased 0.06% month-over-month on a seasonally adjusted (SA) basis in June. On a year-over-year basis, the National FMHPI was up 5.1% in June, down from up 5.7% YoY in May. The YoY increase peaked at 19.1% in July 2021, and for this cycle, bottomed at up 0.9% YoY in May 2023. ...
As of June, 19 states and D.C. were below their previous peaks, Seasonally Adjusted. The largest seasonally adjusted declines from the recent peak were in Idaho (-4.2%), Montana (-2.5%), Arkansas (-2.0), Texas (-1.7%), Hawaii (-1.7%) and Utah (-1.6%).
For cities (Core-based Statistical Areas, CBSA), here are the 30 cities with the largest declines from the peak, seasonally adjusted. Austin continues to be the worst performing city.

There is much more in the article.
NAR: Pending Home Sales Increase 4.8% in June; Down 2.6% Year-over-year
by Calculated Risk on 7/31/2024 10:00:00 AM
From the NAR: Pending Home Sales Rose 4.8% in June
Pending home sales in June ascended 4.8%, according to the National Association of REALTORS®. All four U.S. regions posted monthly gains in transactions. Year-over-year, the Northeast, Midwest and South registered declines, while the West increased.This was above expectations. Note: Contract signings usually lead sales by about 45 to 60 days, so this would usually be for closed sales in July and August.
The Pending Home Sales Index (PHSI)* – a forward-looking indicator of home sales based on contract signings – grew to 74.3 in June. Year over year, pending transactions were down 2.6%. An index of 100 is equal to the level of contract activity in 2001.
"The rise in housing inventory is beginning to lead to more contract signings," said NAR Chief Economist Lawrence Yun. "Multiple offers are less intense, and buyers are in a more favorable position."
...
The Northeast PHSI ascended 3.0% from last month to 65.5, a decline of 0.3% from June 2023. The Midwest index rose 4.7% to 73.7 in June, down 4.2% from one year ago.
The South PHSI increased 6.3% to 89.3 in June, dropping 3.9% from the prior year. The West index climbed 3.4% in June to 58.4, up 1.0% from June 2023.
emphasis added
ADP: Private Employment Increased 122,000 in July
by Calculated Risk on 7/31/2024 08:18:00 AM
Private sector employment increased by 122,000 jobs in July and annual pay was up 4.8 percent year-over-year, according to the July ADP® National Employment ReportTM produced by the ADP Research Institute® in collaboration with the Stanford Digital Economy Lab (“Stanford Lab”). ...This was below the consensus forecast of 168,000. The BLS report will be released Friday, and the consensus is for 175,000 non-farm payroll jobs added in July.
“With wage growth abating, the labor market is playing along with the Federal Reserve's effort to slow inflation,” said Nela Richardson, chief economist, ADP. “If inflation goes back up, it won't be because of labor.”
emphasis added
MBA: Mortgage Applications Decreased in Weekly Survey
by Calculated Risk on 7/31/2024 07:00:00 AM
From the MBA: Mortgage Applications Decrease in Latest MBA Weekly Survey
Mortgage applications decreased 3.9 percent from one week earlier, according to data from the Mortgage Bankers Association’s (MBA) Weekly Applications Survey for the week ending July 26, 2024.
The Market Composite Index, a measure of mortgage loan application volume, decreased 3.9 percent on a seasonally adjusted basis from one week earlier. On an unadjusted basis, the Index decreased 4 percent compared with the previous week. The Refinance Index decreased 7 percent from the previous week and was 32 percent higher than the same week one year ago. The seasonally adjusted Purchase Index decreased 2 percent from one week earlier. The unadjusted Purchase Index decreased 1 percent compared with the previous week and was 14 percent lower than the same week one year ago.
"Mortgage rates were little changed last week, with the 30-year fixed mortgage rate unchanged at 6.82 percent," said Mike Fratantoni, MBA's SVP and Chief Economist. "In recent weeks, there have been some small bursts of refinance activity, particularly for FHA and VA loans. Last week, VA refi application volume dropped sharply, which drove the aggregate result. Borrowers may be waiting for signs that mortgage rates will drift lower as the Federal Reserve begins to cut short-term rates. Purchase volume also dropped slightly because of ongoing affordability challenges.”
...
The average contract interest rate for 30-year fixed-rate mortgages with conforming loan balances ($766,550 or less) remained unchanged at 6.82 percent, with points increasing to 0.62 from 0.59 (including the origination fee) for 80 percent loan-to-value ratio (LTV) loans.
emphasis added
 Click on graph for larger image.
The first graph shows the MBA mortgage purchase index.
According to the MBA, purchase activity is down 14% year-over-year unadjusted.
Red is a four-week average (blue is weekly).
Purchase application activity is up about 6% from the lows in late October 2023, but still below the lowest levels during the housing bust.

The second graph shows the refinance index since 1990.
With higher mortgage rates, the refinance index declined sharply in 2022, and mostly flat lined since then with some increase recently.
Tuesday, July 30, 2024
Wednesday: FOMC Statement, Pending Home Sales, Chicago PMI
by Calculated Risk on 7/30/2024 07:22:00 PM
 Note: Mortgage rates are from MortgageNewsDaily.com and are for top tier scenarios.
Wednesday:
• At 7:00 AM ET, The Mortgage Bankers Association (MBA) will release the results for the mortgage purchase applications index.
• At 8:15 AM: The ADP Employment Report for June. This report is for private payrolls only (no government). The consensus is for 168,000 payroll jobs added in June, up from 150,000 in May.
• At 9:45 AM: Chicago Purchasing Managers Index for July.
• At 10:00 AM: Pending Home Sales Index for June. The consensus is for a 1.5% increase in the index.
• At 2:00 PM: FOMC Meeting Announcement. No change to the Fed Funds rate is expected.
• At 2:30 PM: Fed Chair Jerome Powell holds a press briefing following the FOMC announcement.
HVS: Q2 2024 Homeownership and Vacancy Rates
by Calculated Risk on 7/30/2024 01:23:00 PM
The Census Bureau released the Residential Vacancies and Homeownership report for Q2 2024 today.
The results of this survey were significantly distorted by the pandemic in 2020.
This report is frequently mentioned by analysts and the media to track household formation, the homeownership rate, and the homeowner and rental vacancy rates. However, there are serious questions about the accuracy of this survey.
This survey might show the trend, but I wouldn't rely on the absolute numbers. Analysts probably shouldn't use the HVS to estimate the excess vacant supply or household formation, or rely on the homeownership rate, except as a guide to the trend.
National vacancy rates in the second quarter 2024 were 6.6 percent for rental housing and 0.9 percent for homeowner housing. The rental vacancy rate was higher than the rate in the second quarter 2023 (6.3 percent) and virtually the same as the rate in the first quarter 2024 (6.6 percent).
The homeowner vacancy rate of 0.9 percent was higher than the rate in the second quarter 2023 (0.7 percent) and higher than the rate in the first quarter 2024 (0.8 percent).
The homeownership rate of 65.6 percent was not statistically different from the rate in the second quarter 2023 (65.9 percent) and virtually the same as the rate in the first quarter 2024 (65.6 percent).
emphasis added
 Click on graph for larger image.
The Red dots are the decennial Census homeownership rates for April 1st, 1990, 2000, 2010, and 2020.
The HVS homeownership rate was unchanged at 65.6% in Q2, from 65.6% in Q1.
The HVS homeownership rate was unchanged at 65.6% in Q2, from 65.6% in Q1.
The results in Q2 and Q3 2020 were distorted by the pandemic and should be ignored.
 The HVS homeowner vacancy increased to 0.9% in Q2 from 0.8% in Q1.
 Once again - this probably shows the general trend, but I wouldn't rely on the absolute numbers.
The homeowner vacancy rate declined sharply during the pandemic and includes homes that are vacant and for sale (so this mirrors the low levels of existing home inventory).
 The rental vacancy rate was unchanged at 6.6% in Q2 from 6.6% in Q1. This is up from the low of 5.6% in 2021 and 2022.
The quarterly HVS is the timeliest survey on households, but there are many questions about the accuracy of this survey.
Comments on May Case-Shiller House Prices, FHFA: House Prices Unchanged in May
by Calculated Risk on 7/30/2024 10:18:00 AM
Today, in the Calculated Risk Real Estate Newsletter: Case-Shiller: National House Price Index Up 5.9% year-over-year in May; FHFA House Price Index Unchanged in May, up 5.7% YoY
Excerpt:
S&P/Case-Shiller released the monthly Home Price Indices for May ("May" is a 3-month average of March, April and May closing prices). May closing prices include some contracts signed in January, so there is a significant lag to this data. Here is a graph of the month-over-month (MoM) change in the Case-Shiller National Index Seasonally Adjusted (SA).
The MoM increase in the seasonally adjusted (SA) Case-Shiller National Index was at 0.25%. This was the sixteenth consecutive MoM increase, but this tied December as the smallest MoM increase in the last 15 months.
On a seasonally adjusted basis, prices increased month-to-month in 17 of the 20 Case-Shiller cities. Seasonally adjusted, San Francisco has fallen 7.5% from the recent peak, Seattle is down 5.4% from the peak, Portland down 4.3%, and Phoenix is down 4.3%.

There is much more in the article.
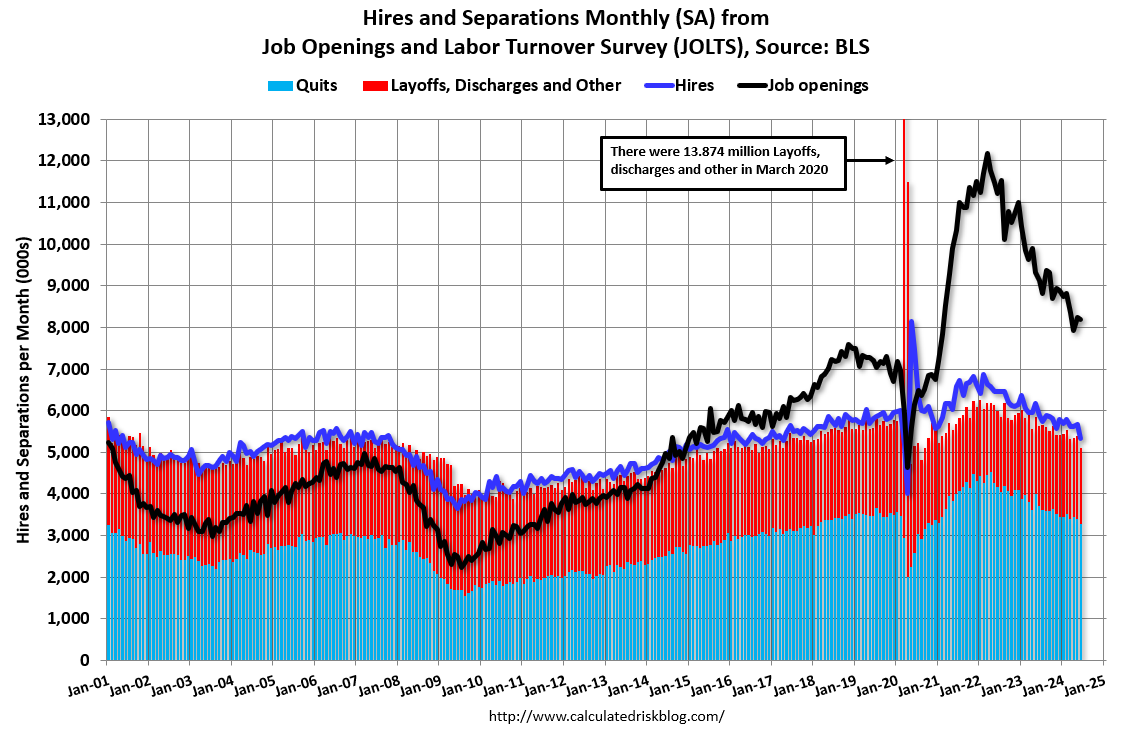
BLS: Job Openings "Unchanged" at 8.2 million in June
by Calculated Risk on 7/30/2024 10:00:00 AM
From the BLS: Job Openings and Labor Turnover Summary
The number of job openings was unchanged at 8.2 million on the last business day of June, the U.S. Bureau of Labor Statistics reported today. Over the month, both the number of hires and total separations were little changed at 5.3 million and 5.1 million, respectively. Within separations, quits (3.3 million) and layoffs and discharges (1.5 million) changed little.The following graph shows job openings (black line), hires (dark blue), Layoff, Discharges and other (red column), and Quits (light blue column) from the JOLTS.
emphasis added
This series started in December 2000.
Note: The difference between JOLTS hires and separations is similar to the CES (payroll survey) net jobs headline numbers. This report is for June; the employment report this Friday will be for July.
 Click on graph for larger image.
Note that hires (dark blue) and total separations (red and light blue columns stacked) are usually pretty close each month. This is a measure of labor market turnover. When the blue line is above the two stacked columns, the economy is adding net jobs - when it is below the columns, the economy is losing jobs.
The spike in layoffs and discharges in March 2020 is labeled, but off the chart to better show the usual data.
Jobs openings decreased in June to 8.18 million from 8.23 million in May.
The number of job openings (black) were down 10% year-over-year.
Quits were down 12% year-over-year. These are voluntary separations. (See light blue columns at bottom of graph for trend for "quits").
Case-Shiller: National House Price Index Up 5.9% year-over-year in May
by Calculated Risk on 7/30/2024 09:00:00 AM
S&P/Case-Shiller released the monthly Home Price Indices for May ("May" is a 3-month average of March, April and May closing prices).
This release includes prices for 20 individual cities, two composite indices (for 10 cities and 20 cities) and the monthly National index.
From S&P S&P CoreLogic Case-Shiller Index Again Breaks Previous Month's All-Time High for May 2024
The S&P CoreLogic Case-Shiller U.S. National Home Price NSA Index, covering all nine U.S. census divisions, reported a 5.9% annual gain for May, down from a 6.4% annual gain in the previous month. The 10-City Composite saw an annual increase of 7.7%, down from an 8.1% annual increase in the previous month. The 20-City Composite posted a year-over-year increase of 6.8%, dropping from a 7.3% increase in the previous month. New York reported the highest annual gain among the 20 cities with a 9.4% increase in May, followed by San Diego and Las Vegas with increases of 9.1% and 8.6%, respectively. Portland once again held the lowest rank for the smallest year-over-year growth, notching a 1.0% annual increase in May.
...
The U.S. National Index, the 20-City Composite, and the 10-City Composite upward trends continued to decelerate from last month, with pre-seasonality adjustment increases of 0.9%, 1.0%, and 1.0%, respectively.
After seasonal adjustment, the U.S. National Index posted the same month-over-month change of 0.3% as last month, while the 20-City and 10-City Composite reported a monthly change of 0.3% and 0.4%, respectively.
“While annual gains have decelerated recently, this may have more to do with 2023 than 2024, as recent performance remains encouraging,” says Brian D. Luke, Head of Commodities, Real & Digital Assets. “Our home price index has appreciated 4.1% year-to-date, the fastest start in two years. Covering the six-month period dating to when mortgage rates peaked, our national index has risen the past four months, erasing the stall experienced late last year. Collectively, all 20 markets covered continue to trade in a homogeneous pattern. Coming into the 2024 presidential election, traditional red states are in a dead heat with blue states, both averaging 5.9% gains annually.
“The Big Apple returned to the top of the leader boards, toppling San Diego from its six-month perch. New York’s 9.4% annual return outpaced San Diego and Las Vegas, by 0.3% and 0.7%, respectively. All 20 markets observed annual gains for the last six months. The last time we saw that long a streak was when all markets rose for three years consecutively during the COVID housing boom. This rally pales in comparison in both duration and annual gains, with above trend growth of 6.2%. The waiting game for the possibility of favorable changes in lending rates continues to be costly for potential buyers as home prices march forward.”
emphasis added
 Click on graph for larger image.
 The first graph shows the nominal seasonally adjusted Composite 10, Composite 20 and National indices (the Composite 20 was started in January 2000).
The Composite 10 index was up 0.4% in May (SA). The Composite 20 index was up 0.3% (SA) in May.
The National index was up 0.3% (SA) in May.
 The second graph shows the year-over-year change in all three indices.
The Composite 10 SA was up 7.7% year-over-year. The Composite 20 SA was up 6.8% year-over-year.
The National index SA was up 5.9% year-over-year.
Annual price changes were close to expectations. I'll have more later.
Monday, July 29, 2024
Tuesday: Case-Shiller House Prices, Job Openings
by Calculated Risk on 7/29/2024 08:15:00 PM
 From Matthew Graham at Mortgage News Daily: Mortgage Rates Start Week at 6 Month Lows
Although the range has been very narrow for the past few weeks, average mortgage rates nonetheless fell to the lowest levels in more than 6 months. Top tier conventional 30yr fixed scenarios are well into the high 6's now, with our proprietary daily average at 6.81, matching the levels seen on July 15th and 18th.Tuesday:
...
The rest of the week is most likely to be determined by economic reports as well as the reaction to Wednesday's Fed announcement. The Fed is not expected to cut rates at this meeting, but some investors will be looking for clues about a September rate cut, currently seen as a near certainty. [30 year fixed 6.81%]
emphasis added
• At 9:00 AM ET, S&P/Case-Shiller House Price Index for May. The consensus is for a 6.0% year-over-year increase in the Comp 20 index for May.
• Also at 9:00 AM, FHFA House Price Index for May. This was originally a GSE only repeat sales, however there is also an expanded index.
• At 10:00 AM ET: Job Openings and Labor Turnover Survey for June from the BLS.
Fannie and Freddie: Single Family Serious Delinquency Rate Mostly Unchanged in June, Multi-family Increased
by Calculated Risk on 7/29/2024 05:05:00 PM
Today, in the Calculated Risk Real Estate Newsletter: Fannie and Freddie: Single Family Serious Delinquency Rate Mostly Unchanged in June, Multi-family Increased
Brief excerpt:
Single-family serious delinquencies were mostly unchanged in June, and multi-family serious delinquencies increased again.
...
Freddie Mac reports that the multi-family delinquencies rate increased to 0.38% in June, up from 0.36% in April, but down from the recent peak of 0.44% in January.
This graph shows the Freddie multi-family serious delinquency rate since 2012. Rates were still high in 2012 following the housing bust and financial crisis.
The multi-family rate increased following the pandemic and has increased recently as rent growth has slowed, vacancy rates have increased, and borrowing rates have increased sharply. The rate surged higher in January and then declined in February and March but has been increasing again. This will be something to watch as more apartments come on the market.

There is much more in the article.
Final Look at Local Housing Markets in June and a Look Ahead to July Sales
by Calculated Risk on 7/29/2024 09:58:00 AM
Today, in the Calculated Risk Real Estate Newsletter: Final Look at Local Housing Markets in June and a Look Ahead to July Sales
A brief excerpt:
In June, sales in these markets were down 13.1% YoY. Last month, in May, these same markets were down 0.1% year-over-year Not Seasonally Adjusted (NSA).There is much more in the article.
...
This was a year-over-year decrease NSA for these markets. However, there were two fewer working days in June 2024 compared to June 2023 (19 vs 21), so seasonally adjusted sales were much higher than the NSA data suggests. Note that the NAR reported sales NSA were down 13.4% YoY in June, almost the same as this local data!
July sales will be mostly for contracts signed in May and June, and mortgage rates decreased slightly to an average of 6.92% in June, down from 7.06% in May. My early expectation is we will see existing home sales at or above the same level in July as compared to June, on a seasonally adjusted annual rate basis (SAAR).
Note for next month (July sales): There were two more working days in July 2024 compared to July 2023 (22 vs 20), so seasonally adjusted sales will be much lower than the NSA data suggests.

Housing July 29th Weekly Update: Inventory up 1.3% Week-over-week, Up 39.4% Year-over-year
by Calculated Risk on 7/29/2024 08:11:00 AM
Altos reports that active single-family inventory was up 1.3% week-over-week. Inventory is now up 37.1% from the February seasonal bottom.
 Click on graph for larger image.
This inventory graph is courtesy of Altos Research.
As of July 26th, inventory was at 677 thousand (7-day average), compared to 668 thousand the prior week.
This is the highest level of inventory since June 2020; however, inventory is still far below pre-pandemic levels.

The red line is for 2024. The black line is for 2019.
Inventory was up 39.4% compared to the same week in 2023 (last week it was up 39.1%), and down 29.4% compared to the same week in 2019 (last week it was down 30.3%).
Back in June 2023, inventory was down almost 54% compared to 2019, so the gap to more normal inventory levels is slowly closing.
Mike Simonsen discusses this data regularly on Youtube.
Sunday, July 28, 2024
Sunday Night Futures
by Calculated Risk on 7/28/2024 06:16:00 PM
Weekend:
• Schedule for Week of July 28, 2024
• FOMC Preview: No Change to Fed Funds Rate
Monday:
• At 10:30 AM ET, Dallas Fed Survey of Manufacturing Activity for July.
From CNBC: Pre-Market Data and Bloomberg futures S&P 500 are up 5 and DOW futures are up 52 (fair value).
Oil prices were lower over the last week with WTI futures at $77.16 per barrel and Brent at $81.13 per barrel. A year ago, WTI was at $81, and Brent was at $84 - so WTI oil prices are down about 5% year-over-year.
Here is a graph from Gasbuddy.com for nationwide gasoline prices. Nationally prices are at $3.48 per gallon. A year ago, prices were at $3.71 per gallon, so gasoline prices are down $0.23 year-over-year.
FOMC Preview: No Change to Fed Funds Rate
by Calculated Risk on 7/28/2024 08:11:00 AM
Most analysts expect there will be no change to the federal funds rate at the meeting this week keeping the target range at 5‑1/4 to 5-1/2 percent. It is likely the FOMC will hint at a possible September rate cut.
Currently market participants expect the next Fed move to be a 25 bp cut announced at the September FOMC meeting. Market participants are also pricing in a 2nd rate cut at the November meeting, and a 3rd rate cut in December.
From Goldman Sachs:
Since the last projections were released, economic growth has been close to expectations, the unemployment rate is slightly higher, and inflation lower than expected (although there are some "base effects" that might push PCE inflation up a little later this year).
1 Projections of change in real GDP and inflation are from the fourth quarter of the previous year to the fourth quarter of the year indicated.
The unemployment rate was at 4.1% in June. This is close to the high end of the June projections.
2 Projections for the unemployment rate are for the average civilian unemployment rate in the fourth quarter of the year indicated.
As of June 2024, PCE inflation increased 2.5 percent year-over-year (YoY). This is at the low end of the June projections.
PCE core inflation increased 2.6 percent YoY in June. This is lower than the June FOMC projections for Q4.
Encouraging inflation news and a further rise in the unemployment rate have pushed Fed officials closer to cutting. The FOMC is set to hold steady next week but is likely to revise its statement to hint that a cut at the following meeting in September has become more likely.
Specifically, we expect the FOMC to revise its statement to say that the unemployment rate has “risen slightly but remains low,” that there has been “further progress” (dropping “modest”) toward the 2% inflation goal, that the risks to the two sides of the mandate “are in” (not “have moved toward”) better balance, and—most importantly—that it now needs only “somewhat” greater confidence in the inflation outlook in order to start lowering interest rates.
emphasis added
From BofA:
The June personal income and outlays report was another tick of the box. Inflation is back on track towards the 2% target even if base effects will lift the y/y rate in 2H. Therefore, the likelihood a rate cuts continues to increase. That said, solid spending and strong GDP growth means the Fed can be patient and await more data. We remain comfortable with our forecast that cuts will start in December, but upcoming inflation and employment data could tip the scale to an earlier cut. Focus now shifts to July data.
Projections will NOT be released at this meeting. For review, here are the June projections.
The BEA's advance estimate for Q2 GDP showed real growth at 2.8% annualized, following 1.4% annualized real growth in Q1. That puts real growth in the first half at 2.1%; at the midpoint of the June FOMC projections.
| GDP projections of Federal Reserve Governors and Reserve Bank presidents, Change in Real GDP1 | ||||
|---|---|---|---|---|
| Projection Date | 2024 | 2025 | 2026 | |
| June 2024 | 1.9 to 2.3 | 1.8 to 2.2 | 1.8 to 2.1 | |
| Mar 2024 | 2.0 to 2.4 | 1.9 to 2.3 | 1.8 to 2.1 | |
The unemployment rate was at 4.1% in June. This is close to the high end of the June projections.
| Unemployment projections of Federal Reserve Governors and Reserve Bank presidents, Unemployment Rate2 | ||||
|---|---|---|---|---|
| Projection Date | 2024 | 2025 | 2026 | |
| June 2024 | 3.9 to 4.2 | 3.9 to 4.3 | 3.9 to 4.3 | |
| Mar 2024 | 3.9 to 4.1 | 3.9 to 4.2 | 3.9 to 4.3 | |
As of June 2024, PCE inflation increased 2.5 percent year-over-year (YoY). This is at the low end of the June projections.
| Inflation projections of Federal Reserve Governors and Reserve Bank presidents, PCE Inflation1 | ||||
|---|---|---|---|---|
| Projection Date | 2024 | 2025 | 2026 | |
| June 2024 | 2.5 to 2.9 | 2.2 to 2.4 | 2.0 to 2.1 | |
| Mar 2024 | 2.3 to 2.7 | 2.1 to 2.2 | 2.0 to 2.1 | |
PCE core inflation increased 2.6 percent YoY in June. This is lower than the June FOMC projections for Q4.
| Core Inflation projections of Federal Reserve Governors and Reserve Bank presidents, Core Inflation1 | ||||
|---|---|---|---|---|
| Projection Date | 2024 | 2025 | 2026 | |
| June 2024 | 2.8 to 3.0 | 2.3 to 2.4 | 2.0 to 2.1 | |
| Mar 2024 | 2.5 to 2.8 | 2.1 to 2.3 | 2.0 to 2.1 | |
Saturday, July 27, 2024
Real Estate Newsletter Articles this Week: Existing-Home Sales Decreased to 3.89 million SAAR in June
by Calculated Risk on 7/27/2024 02:11:00 PM
At the Calculated Risk Real Estate Newsletter this week:
 Click on graph for larger image.
• NAR: Existing-Home Sales Decreased to 3.89 million SAAR in June
• New Home Sales Decrease to 617,000 Annual Rate in June
• Watch Months-of-Supply!
• NMHC: "Apartment Market Conditions Continue to Loosen"
• "Snow Belt to Sun Belt Migration: End of an Era?"
This is usually published 4 to 6 times a week and provides more in-depth analysis of the housing market.
Schedule for Week of July 28, 2024
by Calculated Risk on 7/27/2024 08:11:00 AM
The key report this week is the July employment report.
Other key reports include Case-Shiller house prices for May, ISM manufacturing index and July vehicle sales.
The FOMC meets this week and no change to the Fed Funds rate is expected.
10:30 AM: Dallas Fed Survey of Manufacturing Activity for July.
 9:00 AM: S&P/Case-Shiller House Price Index for May.
This graph shows the year-over-year change in the seasonally adjusted National Index, Composite 10 and Composite 20 indexes through the most recent report (the Composite 20 was started in January 2000).
The consensus is for a 6.0% year-over-year increase in the Comp 20 index for May.
9:00 AM: FHFA House Price Index for May. This was originally a GSE only repeat sales, however there is also an expanded index.
 10:00 AM ET: Job Openings and Labor Turnover Survey for June from the BLS.
 This graph shows job openings (yellow line), hires (purple), Layoff, Discharges and other (red column), and Quits (light blue column) from the JOLTS.
Jobs openings increased in May to 8.14 million from 7.92 million in April.
The number of job openings (yellow) were down 13% year-over-year and Quits were down 14% year-over-year.
10:00 AM: the Q2 2024 Housing Vacancies and Homeownership from the Census Bureau.
7:00 AM ET: The Mortgage Bankers Association (MBA) will release the results for the mortgage purchase applications index.
8:15 AM: The ADP Employment Report for June. This report is for private payrolls only (no government). The consensus is for 168,000 payroll jobs added in June, up from 150,000 in May.
9:45 AM: Chicago Purchasing Managers Index for July.
10:00 AM: Pending Home Sales Index for June. The consensus is for a 1.5% increase in the index.
2:00 PM: FOMC Meeting Announcement. No change to the Fed Funds rate is expected.
2:30 PM: Fed Chair Jerome Powell holds a press briefing following the FOMC announcement.
8:30 AM: The initial weekly unemployment claims report will be released. The consensus is for 230 thousand initial claims, down from 235 thousand last week.
10:00 AM: ISM Manufacturing Index for July. The consensus is for the ISM to be at 49.0, up from 48.5 in June.
10:00 AM: Construction Spending for June. The consensus is for a 0.2% increase in construction spending.
 Late: Light vehicle sales for July from the BEA. The consensus is for light vehicle sales to be 16.2 million SAAR in July, up from 15.3 million in June (Seasonally Adjusted Annual Rate).
This graph shows light vehicle sales since the BEA started keeping data in 1967. The dashed line is the sales rate for last month.
 8:30 AM: Employment Report for July. The consensus is for 175,000 jobs added, and for the unemployment rate to be unchanged at 4.1%.
There were 206,000 jobs added in June, and the unemployment rate was at 4.1%.
This graph shows the jobs added per month since January 2021.
Friday, July 26, 2024
July 26th COVID Update: Wastewater Measure Might Have Peaked
by Calculated Risk on 7/26/2024 07:01:00 PM
 Note: Mortgage rates are from MortgageNewsDaily.com and are for top tier scenarios.
For deaths, I'm currently using 4 weeks ago for "now", since the most recent three weeks will be revised significantly.
Note: "Effective May 1, 2024, hospitals are no longer required to report COVID-19 hospital admissions, hospital capacity, or hospital occupancy data." So I'm no longer tracking hospitalizations.
| COVID Metrics | ||||
|---|---|---|---|---|
| Now | Week Ago | Goal | ||
| Deaths per Week | 368 | 399 | ≤3501 | |
| 1my goals to stop weekly posts, 🚩 Increasing number weekly for Deaths ✅ Goal met. | ||||
 Click on graph for larger image.
This graph shows the weekly (columns) number of deaths reported.
Although weekly deaths met the original goal to stop posting, I'm going to continue to post now that deaths are above the goal again.
 This appears to be a leading indicator for COVID hospitalizations and deaths.
COVID in wastewater was increasing - especially in the West and South - but it might have peaked (except in the South).
"Snow Belt to Sun Belt Migration: End of an Era?"
by Calculated Risk on 7/26/2024 03:15:00 PM
Here is new working paper from Sylvain Leduc and Daniel J. Wilson at the Federal Reserve Bank of San Francisco Snow Belt to Sun Belt Migration: End of an Era
Given climate change projections for coming decades of increasing extreme heat in the hottest U.S. counties and decreasing extreme cold in the coldest counties, our findings suggest the “pivoting” in the U.S. climate-migration correlation over the past 50 years is likely to continue, leading to a reversal of the 20th century Snow Belt to Sun Belt migration pattern.If this sounds familiar, I wrote about this last year: The Long-Term Housing and Population Shift
The impact of climate change will be important for housing.
PCE Measure of Shelter Slows to 5.3% YoY in June
by Calculated Risk on 7/26/2024 08:53:00 AM
Here is a graph of the year-over-year change in shelter from the CPI report and housing from the PCE report this morning, both through June 2024.
 CPI Shelter was up 5.1% year-over-year in June, down from 5.4% in May, and down from the cycle peak of 8.2% in March 2023.
Housing (PCE) was up 5.3% YoY in June, down from 5.5% in May, and down from the cycle peak of 8.3% in April 2023.
Since asking rents are mostly flat year-over-year, these measures will slowly continue to decline over the next year.
Since asking rents are mostly flat year-over-year, these measures will slowly continue to decline over the next year.
 The second graph shows PCE prices, Core PCE prices and Core ex-housing over the last 3 months (annualized):
Key measures are slightly above the Fed's target on a 3-month basis. Note: There appears to be some residual seasonality distorting PCE prices in Q1, especially in January.
3-month annualized change:
PCE Price Index: 1.5%
Core PCE Prices: 2.3%
Core minus Housing: 1.8%
Core PCE Prices: 2.3%
Core minus Housing: 1.8%
Personal Income increased 0.2% in June; Spending increased 0.3%
by Calculated Risk on 7/26/2024 08:30:00 AM
The BEA released the Personal Income and Outlays report for June:
Personal income increased $50.4 billion (0.2 percent at a monthly rate) in June, according to estimates released today by the U.S. Bureau of Economic Analysis. Disposable personal income (DPI), personal income less personal current taxes, increased $37.7 billion (0.2 percent) and personal consumption expenditures (PCE) increased $57.6 billion (0.3 percent).The June PCE price index increased 2.5 percent year-over-year (YoY), down from 2.6 percent YoY in May, and down from the recent peak of 7.0 percent in June 2022.
The PCE price index increased 0.1 percent. Excluding food and energy, the PCE price index increased 0.2 percent. Real DPI increased 0.1 percent in June and real PCE increased 0.2 percent; goods increased 0.2 percent and services increased 0.2 percent .
emphasis added
The PCE price index, excluding food and energy, increased 2.6 percent YoY, unchanged from 2.6 percent in May, and down from the recent peak of 5.4 percent in February 2022.
The following graph shows real Personal Consumption Expenditures (PCE) through June 2024 (2017 dollars). Note that the y-axis doesn't start at zero to better show the change.
 Click on graph for larger image.
The dashed red lines are the quarterly levels for real PCE.
Personal income was slightly below expectations, and PCE was slightly above expectations.
Inflation was slightly below expectations.
Thursday, July 25, 2024
Friday: Personal Income and Outlays
by Calculated Risk on 7/25/2024 08:39:00 PM
 Note: Mortgage rates are from MortgageNewsDaily.com and are for top tier scenarios.
Friday:
• At 8:30 AM ET, Personal Income and Outlays, June 2024. The consensus is for a 0.4% increase in personal income, and for a 0.2% increase in personal spending. And for the Core PCE price index to increase 0.2%. PCE prices are expected to be up 2.6% YoY, and core PCE prices up 2.6% YoY.
• At 10:00 AM, University of Michigan's Consumer sentiment index (Final for July). The consensus is for a reading of 66.0.
Hotels: Occupancy Rate Increased 1.0% Year-over-year
by Calculated Risk on 7/25/2024 02:07:00 PM
The U.S. hotel industry reported higher performance results than the previous week and positive comparisons year over year, according to CoStar’s latest data through 20 July. ...The following graph shows the seasonal pattern for the hotel occupancy rate using the four-week average.
14-20 July 2024 (percentage change from comparable week in 2023):
• Occupancy: 73.5% (+1.0%)
• Average daily rate (ADR): US$165.91 (+2.4%)
• Revenue per available room (RevPAR): US$122.02 (+3.4%)
emphasis added
 Click on graph for larger image.
The red line is for 2024, blue is the median, and dashed light blue is for 2023. Dashed purple is for 2018, the record year for hotel occupancy.
The 4-week average of the occupancy rate is tracking last year and is below the median rate for the period 2000 through 2023 (Blue).
Note: Y-axis doesn't start at zero to better show the seasonal change.
The 4-week average of the occupancy rate will increase seasonally for a few more weeks due to summer recreational travel.
Realtor.com Reports Active Inventory Up 36.9% YoY
by Calculated Risk on 7/25/2024 02:07:00 PM
What this means: On a weekly basis, Realtor.com reports the year-over-year change in active inventory and new listings. On a monthly basis, they report total inventory. For June, Realtor.com reported inventory was up 36.7% YoY, but still down 32.4% compared to April 2017 to 2019 levels.
Now - on a weekly basis - inventory is up 36.9% YoY.
Realtor.com has monthly and weekly data on the existing home market. Here is their weekly report: Weekly Housing Trends View—Data for Week Ending July 20, 2024 Here is a graph of the year-over-year change in inventory according to realtor.com.
Inventory was up year-over-year for the 37th consecutive week.
Realtor.com has monthly and weekly data on the existing home market. Here is their weekly report: Weekly Housing Trends View—Data for Week Ending July 20, 2024
• Active inventory increased, with for-sale homes 36.9% above year-ago levels.
For the 37th week in a row, the number of for-sale homes grew compared with one year ago. This past week, the inventory of homes for sale grew by 36.9% compared with last year, slightly higher than the rate observed in the previous week. Despite nearly 8 months of building inventory, buyers still see more than 30% fewer homes for sale compared with pre-pandemic.
• New listings–a measure of sellers putting homes up for sale–were up this week by 6.4% from one year ago.
This week marks 15 out of the past 16 weeks with new listings growth, similar to the 6.3% annual rate seen in June but roughly half of what it was two months ago. Broadly speaking, the number of new homes for sale remains historically low and is still below the 2017-2022 levels, even with recent improvements.
 Here is a graph of the year-over-year change in inventory according to realtor.com.
 Inventory was up year-over-year for the 37th consecutive week.
However, inventory is still historically low.
New listings remain below typical pre-pandemic levels.
Watch Months-of-Supply!
by Calculated Risk on 7/25/2024 10:55:00 AM
Today, in the Calculated Risk Real Estate Newsletter: Watch Months-of-Supply!
A brief excerpt:
Both inventory and sales are well below normal levels, and I think we need to keep an eye on months-of-supply to forecast price changes. Historically nominal prices declined when months-of-supply approached 6 months - and that is unlikely this year - but we could see months-of-supply back to 2019 levels in the next month or two.There is much more in the article.
As I mentioned in a recent interview with Lance Lambert at ResiClub:"I expect this measure to continue to increase, and be over 4 months soon – and to be above 2019 levels in a few months. This doesn’t mean national price declines, but it suggests price growth will slow significantly later this year. We might see national price decline with months-of-supply above 5 (as opposed to 6) since most potential sellers have substantial equity and might be willing to sell for a little less."Months-of-supply was at 4.1 months in June compared to 4.3 months in June 2019. Note that months-of-supply peaked at 4.3 months in May and June 2019 and then declined to 4.2 months in July 2019.
What would it take to get months-of-supply back to 2019 levels in July?
BEA: Real GDP increased at 2.8% Annualized Rate in Q2
by Calculated Risk on 7/25/2024 08:37:00 AM
From the BEA: Gross Domestic Product, Second Quarter 2024 (Advance Estimate)
Real gross domestic product (GDP) increased at an annual rate of 2.8 percent in the second quarter of 2024, according to the "advance" estimate released by the U.S. Bureau of Economic Analysis. In the first quarter, real GDP increased 1.4 percent.PCE increased at a 2.3% annual rate, and residential investment decreased at a 1.4% rate. The advance Q2 GDP report, with 2.8% annualized increase, was above expectations.
The increase in real GDP primarily reflected increases in consumer spending, private inventory investment, and nonresidential fixed investment. Imports, which are a subtraction in the calculation of GDP, increased (table 2). The increase in consumer spending reflected increases in both services and goods. Within services, the leading contributors were health care, housing and utilities, and recreation services. Within goods, the leading contributors were motor vehicles and parts, recreational goods and vehicles, furnishings and durable household equipment, and gasoline and other energy goods. The increase in private inventory investment primarily reflected increases in wholesale trade and retail trade industries that were partly offset by a decrease in mining, utilities, and construction industries. Within nonresidential fixed investment, increases in equipment and intellectual property products were partly offset by a decrease in structures. The increase in imports was led by capital goods, excluding automotive.
Compared to the first quarter, the acceleration in real GDP in the second quarter primarily reflected an upturn in private inventory investment and an acceleration in consumer spending. These movements were partly offset by a downturn in residential fixed investment.
emphasis added
I'll have more later ...
Weekly Initial Unemployment Claims Decrease to 235,000
by Calculated Risk on 7/25/2024 08:33:00 AM
The DOL reported:
In the week ending July 20, the advance figure for seasonally adjusted initial claims was 235,000, a decrease of 10,000 from the previous week's revised level. The previous week's level was revised up by 2,000 from 243,000 to 245,000. The 4-week moving average was 235,500, an increase of 250 from the previous week's revised average. The previous week's average was revised up by 500 from 234,750 to 235,250.The following graph shows the 4-week moving average of weekly claims since 1971.
emphasis added
 Click on graph for larger image.
The dashed line on the graph is the current 4-week average. The four-week average of weekly unemployment claims increased to 235,500.
The previous week was revised up.
Weekly claims were slightly lower than the consensus forecast.
Wednesday, July 24, 2024
Thursday: GDP, Unemployment Claims, Durable Goods
by Calculated Risk on 7/24/2024 07:27:00 PM
 Note: Mortgage rates are from MortgageNewsDaily.com and are for top tier scenarios.
Thursday:
• At 8:30 AM ET, The initial weekly unemployment claims report will be released. The consensus is for 238 thousand initial claims, down from 243 thousand last week.
• Also at 8:30 AM, Gross Domestic Product, 2nd quarter (advance estimate), and annual update. The consensus is that real GDP increased 1.8% annualized in Q2, up from 1.4% in Q1.
• Also at 8:30 AM, Durable Goods Orders for June from the Census Bureau. The consensus is for a 0.5% increase in durable goods orders.
• At 11:00 AM, Kansas City Fed Survey of Manufacturing Activity for July.
AIA: Architecture Billings Declined in June; Multi-family Billings Declined for 23rd Consecutive Month
by Calculated Risk on 7/24/2024 02:03:00 PM
Note: This index is a leading indicator primarily for new Commercial Real Estate (CRE) investment.
From the AIA: ABI June 2024: Business conditions remain soft at architecture firms
Billings at firms decreased for the seventeenth consecutive month, with an AIA/Deltek Architecture Billings Index (ABI) score of 46.4 (any score below 50 means that billings declined). Although somewhat fewer firms reported a decline in billings in June than in May, the majority continued to experience a decrease from the previous month. Indicators of future work remained generally soft as well, with only slightly more than half of responding firms reporting an increase in inquiries into new work. Firms also reported a decline in the value of newly signed design contracts for the third consecutive month. While many firms still have a healthy backlog of projects in the pipeline, 6.4 months on average, this is the smallest that backlogs have been in more than three years. Despite this ongoing softness, firms remain generally optimistic that conditions will start to improve once interest rates begin to decline but are likely to continue experiencing challenges at least until then.• Northeast (52.2); Midwest (40.9); South (43.9); West (43.1)
Business conditions remained soft at firms across the country in June, except for those located in the Northeast, which reported a slight increase in billings for the first time since January 2023. However, conditions softened further at firms located in the other regions of the country, with particularly weak conditions reported at firms located in the Midwest. Billings also continued to decline at firms of all specializations in June. While conditions remained soft at firms with a multifamily residential specialization, conditions are now weaker at firms with other specializations for the first time in nearly two years, most notably at those with a commercial/industrial specialization.
...
The ABI score is a leading economic indicator of construction activity, providing an approximately nine-to-twelve-month glimpse into the future of nonresidential construction spending activity. The score is derived from a monthly survey of architecture firms that measures the change in the number of services provided to clients.
emphasis added
• Sector index breakdown: commercial/industrial (42.0); institutional (44.3); multifamily residential (45.1)
 Click on graph for larger image.
This graph shows the Architecture Billings Index since 1996. The index was at 46.4 in June, up from 42.4 in May. Anything below 50 indicates a decrease in demand for architects' services.
Note: This includes commercial and industrial facilities like hotels and office buildings, multi-family residential, as well as schools, hospitals and other institutions.
This index usually leads CRE investment by 9 to 12 months, so this index suggests a slowdown in CRE investment into 2025.
Note that multi-family billing turned down in August 2022 and has been negative for twenty-three consecutive months (with revisions). This suggests we will see a further weakness in multi-family starts.
New Home Sales Decrease to 617,000 Annual Rate in June; Median New Home Price is Down 9% from the Peak
by Calculated Risk on 7/24/2024 10:41:00 AM
Today, in the Calculated Risk Real Estate Newsletter: New Home Sales Decrease to 617,000 Annual Rate in June
Brief excerpt:
The Census Bureau reports New Home Sales in June were at a seasonally adjusted annual rate (SAAR) of 617 thousand. The previous three months were revised up sharply, combined.There is much more in the article.
...
The next graph shows new home sales for 2023 and 2024 by month (Seasonally Adjusted Annual Rate). Sales in June 2024 were down 7.4% from June 2023.
This is the 2nd consecutive year-over-year decline following 13 consecutive months with a year-over-year increase.

New Home Sales Decrease to 617,000 Annual Rate in June
by Calculated Risk on 7/24/2024 10:00:00 AM
The Census Bureau reports New Home Sales in June were at a seasonally adjusted annual rate (SAAR) of 617 thousand.
The previous three months were revised up sharply, combined.
Sales of new single-family houses in June 2024 were at a seasonally adjusted annual rate of 617,000, according to estimates released jointly today by the U.S. Census Bureau and the Department of Housing and Urban Development. This is 0.6 percent below the revised May rate of 621,000 and is 7.4 percent below the June 2023 estimate of 666,000.
emphasis added
 Click on graph for larger image.
The first graph shows New Home Sales vs. recessions since 1963. The dashed line is the current sales rate.
New home sales were close to pre-pandemic levels.
The second graph shows New Home Months of Supply.
 The months of supply increased in June to 9.3 months from 9.1 months in May.
 The all-time record high was 12.2 months of supply in January 2009. The all-time record low was 3.3 months in August 2020.
This is well above the top of the normal range (about 4 to 6 months of supply is normal).
"The seasonally-adjusted estimate of new houses for sale at the end of June was 476,000. This represents a supply of 9.3 months at the current sales rate. "Sales were below expectations of 640 thousand SAAR, however sales for the three previous months were revised up significantly, combined. I'll have more later today.
MBA: Mortgage Applications Decreased in Weekly Survey
by Calculated Risk on 7/24/2024 07:00:00 AM
From the MBA: Mortgage Applications Decrease in Latest MBA Weekly Survey
Mortgage applications decreased 2.2 percent from one week earlier, according to data from the Mortgage Bankers Association’s (MBA) Weekly Applications Survey for the week ending July 19, 2024.
The Market Composite Index, a measure of mortgage loan application volume, decreased 2.2 percent on a seasonally adjusted basis from one week earlier. On an unadjusted basis, the Index decreased 2 percent compared with the previous week. The Refinance Index increased 0.3 percent from the previous week and was 38 percent higher than the same week one year ago. The seasonally adjusted Purchase Index decreased 4 percent from one week earlier. The unadjusted Purchase Index decreased 4 percent compared with the previous week and was 15 percent lower than the same week one year ago.
“Mortgage rates continued to ease, with the 30-year fixed rate dipping to 6.82 percent, the lowest level since February 2024,” said Joel Kan, MBA’s Vice President and Deputy Chief Economist. “Refinance applications were up, driven by conventional and FHA application activity, as some borrowers took the opportunity to act. Furthermore, the conventional refi index was at its highest level since September 2022.”
Added Kan, “Purchase applications decreased as ongoing affordability challenges persist with rates at their current levels and with home-price appreciation still strong in many markets.”
...
The average contract interest rate for 30-year fixed-rate mortgages with conforming loan balances ($766,550 or less) decreased to 6.82 percent from 6.87 percent, with points increasing to 0.59 from 0.57 (including the origination fee) for 80 percent loan-to-value ratio (LTV) loans.
emphasis added
 Click on graph for larger image.
The first graph shows the MBA mortgage purchase index.
According to the MBA, purchase activity is down 15% year-over-year unadjusted.
Red is a four-week average (blue is weekly).
Purchase application activity is up slightly from the lows in late October 2023, but still below the lowest levels during the housing bust.

The second graph shows the refinance index since 1990.
With higher mortgage rates, the refinance index declined sharply in 2022, and mostly flat lined since then with some increase recently.
Tuesday, July 23, 2024
Wednesday: New Home Sales, Architecture Billings Index
by Calculated Risk on 7/23/2024 07:22:00 PM
 Note: Mortgage rates are from MortgageNewsDaily.com and are for top tier scenarios.
Wednesday:
• At 7:00 AM ET, The Mortgage Bankers Association (MBA) will release the results for the mortgage purchase applications index.
• At 10:00 AM, New Home Sales for June from the Census Bureau. The consensus is for 640 thousand SAAR, up from 619 thousand in May.
• During the day, The AIA's Architecture Billings Index for June (a leading indicator for commercial real estate).
July Vehicle Sales Forecast: 16.1 million SAAR, Up 1% YoY
by Calculated Risk on 7/23/2024 02:29:00 PM
From WardsAuto: July U.S. Light-Vehicle Sales Tracking to Strongest SAAR So Far in 2024 (pay content). Brief excerpt:
An expected boost to volume in July from lost sales in June, caused by a cyberattack affecting dealer management systems, will not be as big as initially expected. Dealers apparently were quite adept at finding alternative ways to reporting sales and lost volume was less than thought. Still, July’s forecast SAAR of 16.1 million units is the highest for any month this year and inventory will enter August at a five-year high for the period.
emphasis added
 Click on graph for larger image.
This graph shows actual sales from the BEA (Blue), and Wards forecast for July (Red).
On a seasonally adjusted annual rate basis, the Wards forecast of 16.1 million SAAR, would be up 5.3% from last month, and up 1.0% from a year ago.
NAR: Existing-Home Sales Decreased to 3.89 million SAAR in June; Median House Prices Increased 4.1% Year-over-Year
by Calculated Risk on 7/23/2024 10:53:00 AM
Today, in the CalculatedRisk Real Estate Newsletter: NAR: Existing-Home Sales Decreased to 3.89 million SAAR in June
Excerpt:
Sales Year-over-Year and Not Seasonally Adjusted (NSA)There is much more in the article.
The fourth graph shows existing home sales by month for 2023 and 2024.
Sales declined 5.4% year-over-year compared to June 2023. This was the thirty-fourth consecutive month with sales down year-over-year.

NAR: Existing-Home Sales Decreased to 3.89 million SAAR in June
by Calculated Risk on 7/23/2024 10:00:00 AM
From the NAR: Existing-Home Sales Slipped 5.4% in June; Median Sales Price Jumps to Record High of $426,900
Existing-home sales fell in June as the median sales price climbed to the highest price ever recorded for the second consecutive month, according to the National Association of REALTORS®. All four major U.S. regions posted sales declines. Year-over-year, sales waned in the Northeast, Midwest and South but were unchanged in the West.
Total existing-home sales – completed transactions that include single-family homes, townhomes, condominiums and co-ops – receded 5.4% from May to a seasonally adjusted annual rate of 3.89 million in June. Year-over-year, sales also dropped 5.4% (down from 4.11 million in June 2023).
...
Total housing inventory registered at the end of June was 1.32 million units, up 3.1% from May and 23.4% from one year ago (1.07 million). Unsold inventory sits at a 4.1-month supply at the current sales pace, up from 3.7 months in May and 3.1 months in June 2023. The last time unsold inventory posted a four-month supply was May 2020 (4.5 months).
emphasis added
Click on graph for larger image.This graph shows existing home sales, on a Seasonally Adjusted Annual Rate (SAAR) basis since 1994.
Sales in June (3.89 million SAAR) were down 5.4% from the previous month and were 5.4% below the June 2023 sales rate.
The second graph shows nationwide inventory for existing homes.
 According to the NAR, inventory increased to 1.32 million in June from 1.28 million the previous month.
 According to the NAR, inventory increased to 1.32 million in June from 1.28 million the previous month.
Headline inventory is not seasonally adjusted, and inventory usually decreases to the seasonal lows in December and January, and peaks in mid-to-late summer.
The last graph shows the year-over-year (YoY) change in reported existing home inventory and months-of-supply. Since inventory is not seasonally adjusted, it really helps to look at the YoY change. Note: Months-of-supply is based on the seasonally adjusted sales and not seasonally adjusted inventory.
 Inventory was up 23.4% year-over-year (blue) in June compared to June 2023.
Months of supply (red) increased to 4.1 months in June from 3.7 months the previous month.
The sales rate was lower than the consensus forecast. I'll have more later.
The last graph shows the year-over-year (YoY) change in reported existing home inventory and months-of-supply. Since inventory is not seasonally adjusted, it really helps to look at the YoY change. Note: Months-of-supply is based on the seasonally adjusted sales and not seasonally adjusted inventory.
 Inventory was up 23.4% year-over-year (blue) in June compared to June 2023.
 Months of supply (red) increased to 4.1 months in June from 3.7 months the previous month.
The sales rate was lower than the consensus forecast. I'll have more later.


