The graph shows two measures of inflation using a month-over-month change annualized (using a three-month average to smooth the graph). For example, for December 2022, I used an average of December, November and October 2022, divided by the average of November, October and September 2022. (This was just for smoothing).
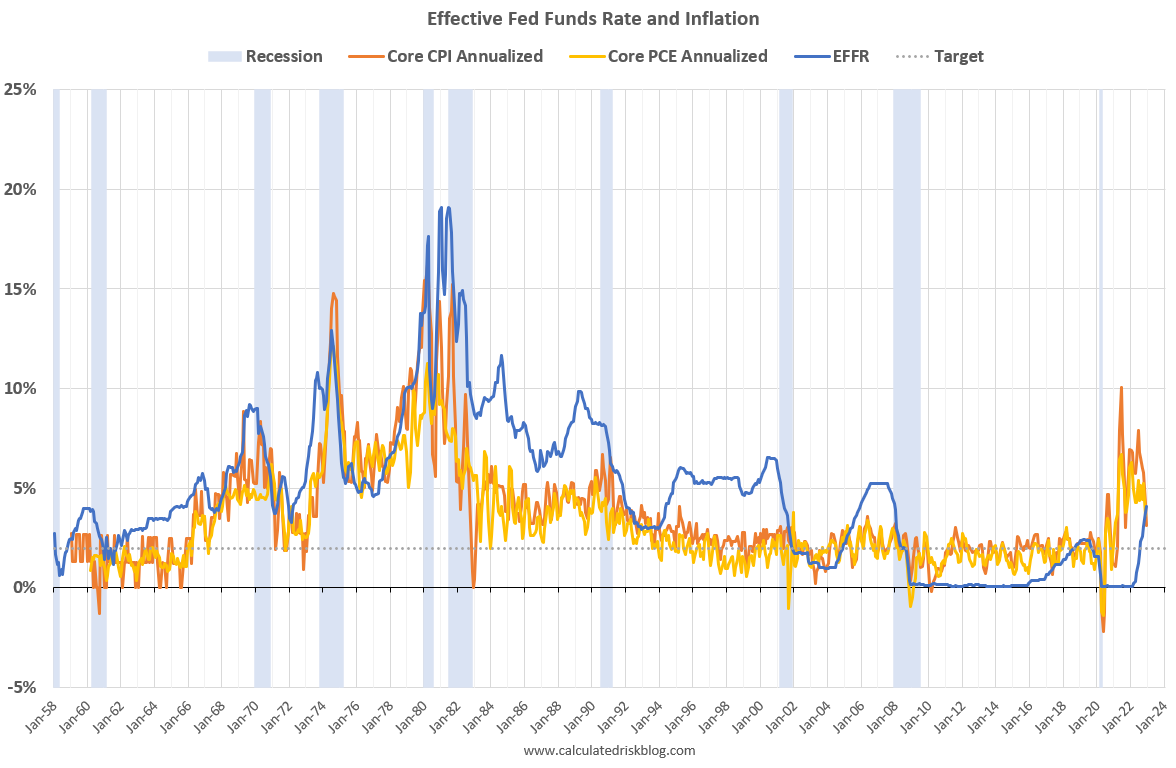 Click on graph for larger image.
In 1974, the Fed started cutting rates before inflation peaked. However, in the Volcker period, the Fed waited until after inflation peaked.
The good news is the inflation has clearly peaked. And since rents are falling faster than seasonally normal - due to the pandemic related changes in household formation - it makes sense for the short term to use core CPI ex-shelter. And that is actually negative for the last 3 months!
NOTE: There was a surge in household formation during the pandemic, pushing up rents sharply, and now household formation has slowed sharply just as more supply will be coming on the market.
 This graph shows the year-over-year change in Core CPI ex-Shelter (blue), and the one month change annualized (red). The year-over-year change was at 4.4% in December, down from 5.2% in November. And the annualized one-month change was negative in October, November and December!