 RSS Feed
 by Calculated Risk on 1/26/2023 01:47:00 PM
Thursday, January 26, 2023
A Few Comments on Q4 GDP and Investment
Note: The first two graphs - Investment Contributions and Residential Investment as a percent of GDP - are useful in predicting Fed induced recessions. RI as a percent of GDP usually turns down well in advance of a recession. This is something I'm watching.
Earlier from the BEA: Gross Domestic Product, Fourth Quarter 2022 (Advance Estimate)
Real gross domestic product (GDP) increased at an annual rate of 2.9 percent in the fourth quarter of 2022, according to the "advance" estimate released by the Bureau of Economic Analysis. In the third quarter, real GDP increased 3.2 percent. ...The advance Q4 GDP report, at 2.9% annualized, was above expectations, partly due to a positive impact from an increase in inventories.
The increase in real GDP reflected increases in private inventory investment, consumer spending, federal government spending, state and local government spending, and nonresidential fixed investment that were partly offset by decreases in residential fixed investment and exports. Imports, which are a subtraction in the calculation of GDP, decreased.
emphasis added
Personal consumption expenditures (PCE) increased at a 2.1% annualized rate in Q4.
The graph below shows the contribution to GDP from residential investment, equipment and software, and nonresidential structures (3 quarter trailing average). This is important to follow because residential investment tends to lead the economy, equipment and software is generally coincident, and nonresidential structure investment trails the economy.
In the graph, red is residential, green is equipment and software, and blue is investment in non-residential structures. So, the usual pattern - both into and out of recessions is - red, green, blue.
Of course - with the sudden economic stop due to COVID-19 - the usual pattern didn't apply.
The dashed gray line is the contribution from the change in private inventories.
 Click on graph for larger image.
Residential investment (RI) decreased at a 26.7% annual rate in Q4. Equipment investment decreased at a 3.7% annual rate, and investment in non-residential structures increased at a 0.4% annual rate.
The contribution to Q4 GDP from investment in private inventories was 1.46 percentage points.
On a 3-quarter trailing average basis, RI (red) is down, equipment (green) is up, and nonresidential structures (blue) is still down.
On a 3-quarter trailing average basis, RI (red) is down, equipment (green) is up, and nonresidential structures (blue) is still down.
I'll post more on the components of non-residential investment once the supplemental data is released.
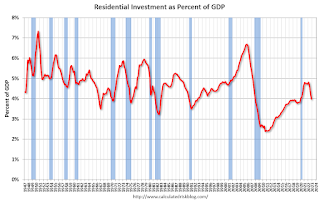 The second graph shows residential investment as a percent of GDP.
Residential Investment as a percent of GDP decreased in Q4.
I'll break down Residential Investment into components after the GDP details are released.
Note: Residential investment (RI) includes new single-family structures, multifamily structures, home improvement, broker's commissions, and a few minor categories.
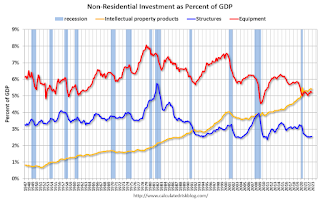 The third graph shows non-residential investment in
structures, equipment and "intellectual property products".
The third graph shows non-residential investment in
structures, equipment and "intellectual property products".
Investment in non-residential structures increased slightly in Q4 as a percent GDP.


