Other key reports include Job Openings, the June ISM Service survey and the Trade Deficit for May.
All US markets will be closed in observance of Independence Day
8:00 AM: Corelogic House Price index for May.
7:00 AM ET: The Mortgage Bankers Association (MBA) will release the results for the mortgage purchase applications index.
 10:00 AM ET: Job Openings and Labor Turnover Survey for May from the BLS.
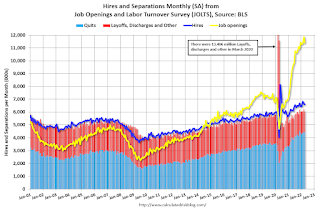
 This graph shows job openings (yellow line), hires (purple), Layoff, Discharges and other (red column), and Quits (light blue column) from the JOLTS.
Jobs openings decreased in April to 11.400 million from 11.855 million in March.
The number of job openings (yellow) were up 23% year-over-year and quits were up 10% year-over-year.
10:00 AM: the ISM Services Index for June. The consensus is for a reading of 54.5, down from 55.9.
2:00 PM: FOMC Minutes, Meeting of June 14-15, 2022
8:15 AM: The ADP Employment Report for June will NOT be released.
"ADP Research Institute (ADPRI) and the Stanford Digital Economy Lab (the "Lab") announced they will retool the ADP National Employment Report (NER) methodology to provide a more robust, high-frequency view of the labor market and trajectory of economic growth. In preparation for the changeover to the new report and methodology, ADPRI will pause issuing the current report and has targeted August 31, 2022 ..."8:30 AM: The initial weekly unemployment claims report will be released. The consensus is for 225 thousand down from 231 thousand last week.
 8:30 AM: Trade Balance report for May from the Census Bureau.
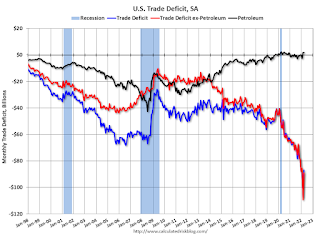
 This graph shows the U.S. trade deficit, with and without petroleum, through the most recent report. The blue line is the total deficit, and the black line is the petroleum deficit, and the red line is the trade deficit ex-petroleum products.
The consensus is the trade deficit to be $84.9 billion. The U.S. trade deficit was at $87.1 billion the previous month.
 8:30 AM: Employment Report for June. The consensus is for 270,000 jobs added, and for the unemployment rate to be unchanged at 3.6%.
There were 390,000 jobs added in May, and the unemployment rate was at 3.6%.
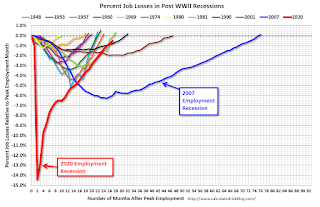
This graph shows the job losses from the start of the employment recession, in percentage terms.
The current employment recession was by far the worst recession since WWII in percentage terms. However, the current employment recession, 26 months after the onset, has recovered quicker than the previous two recessions.