Housing Starts:
Privately‐owned housing starts in December were at a seasonally adjusted annual rate of 1,702,000. This is 1.4 percent above the revised November estimate of 1,678,000 and is 2.5 percent (±13.8 percent)* above the December 2020 rate of 1,661,000. Single‐family housing starts in December were at a rate of 1,172,000; this is 2.3 percent below the revised November figure of 1,199,000. The December rate for units in buildings with five units or more was 524,000.
An estimated 1,595,100 housing units were started in 2021. This is 15.6 percent (±4.0 percent) above the 2020 figure of 1,379,600.
Building Permits:
Privately‐owned housing units authorized by building permits in December were at a seasonally adjusted annual rate of 1,873,000. This is 9.1 percent above the revised November rate of 1,717,000 and is 6.5 percent above the December 2020 rate of 1,758,000. Single‐family authorizations in December were at a rate of 1,128,000; this is 2.0 percent above the revised November figure of 1,106,000. Authorizations of units in buildings with five units or more were at a rate of 675,000 in December. [Special Note: In December, there was a large increase in building permits issued in Philadelphia, PA. Philadelphia enacted several real estate tax changes for residential projects permitted after December 31, 2021.]
An estimated 1,724,700 housing units were authorized by building permits in 2021. This is 17.2 percent (±0.6 percent) above the 2020 figure of 1,471,100.
emphasis added
 Click on graph for larger image.
The first graph shows single and multi-family housing starts for the last several years.
Multi-family starts (blue, 2+ units) increased in December compared to November. Multi-family starts were up 53% year-over-year in December.
Single-family starts (red) decreased in December and were down 10.9% year-over-year.
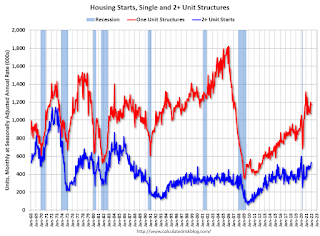 The second graph shows single and multi-family housing starts since 1968.
 This shows the huge collapse following the housing bubble, and then the eventual recovery (but still not historically high).
Total housing starts in December were above expectations and starts in October and November were revised up slightly, combined.
I'll have more later …