Here are five economic reasons to be thankful this Thanksgiving. (Hat Tip to Neil Irwin who started doing this several years ago)
1) A Falling Unemployment Rate.
 The unemployment rate was at 4.6% in October. The unemployment rate is down from 14.8% in April 2020 (the highest since the Great Depression).
The unemployment rate is down from 6.9% a year ago (October 2020).
There are still 4.3 million fewer jobs than in February 2020, but this is significant improvement in the unemployment rate.
2) Falling unemployment claims.
 This graph shows the 4-week moving average of weekly claims since 1971.
2) Falling unemployment claims.
 This graph shows the 4-week moving average of weekly claims since 1971.
Weekly claims declined to 199,000 last week, the lowest level since 1969!
The dashed line on the graph is the current 4-week average. The four-week average of weekly unemployment claims decreased to 252,250 - the lowest since March 2020.
This is a huge decline in regular unemployment claims.
3) Job Openings Near Series High.
There were 10.4 million job openings in September, just below the record 11.1 million in July 2021.
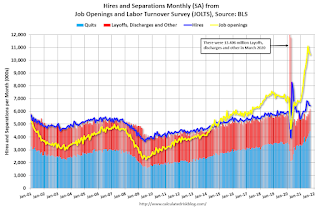 This graph shows job openings (yellow line), hires (dark blue), Layoff, Discharges and other (red column), and Quits (light blue column) from the JOLTS.
The number of job openings (yellow) were up 58% year-over-year.
Quits were up 34% year-over-year to a new record high. These are voluntary separations. (See light blue columns at bottom of graph for trend for "quits").
A large number of job openings, and rising quits, are positive signs for workers.
4) Mortgage Debt as a Percent of GDP is much lower than during Housing Bubble
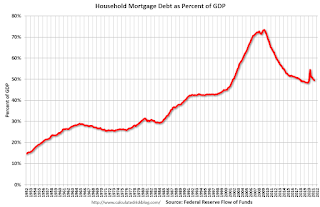 This graph shows household mortgage debt as a percent of GDP. Note this graph was impacted by the sharp decline in Q2 2020 GDP.
Mortgage debt increased by $222 billion in Q2 2021. This was the largest quarterly increase in mortgage debt since 2006.
Mortgage debt is up $573 billion from the peak during the housing bubble, but, as a percent of GDP is at 49.6% - down from Q1 - and down from a peak of 73.3% of GDP during the housing bubble.
5) Mortgage Delinquency Rate Declining Quickly
Two graphs for this one. The first graph, based on data from the MBA through Q3 2021, shows the percent of loans delinquent by days past due. Overall delinquencies decreased in Q3.
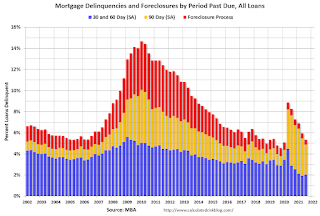 The sharp increase last year in the 90-day bucket was due to loans in forbearance (included as delinquent, but not reported to the credit bureaus).
The percent of loans in the foreclosure process declined further, and was at the lowest level since 1981.
And from Freddie Mac for October:
 Freddie Mac reported that the Single-Family serious delinquency rate in October was 1.32%, down year-over-year from 2.89% in October 2020.
Freddie's serious delinquency rate peaked in February 2010 at 4.20% following the housing bubble, and peaked at 3.17% in August 2020 during the pandemic.
These are mortgage loans that are "three monthly payments or more past due or in foreclosure". Mortgages in forbearance are being counted as delinquent in this monthly report, but are not reported to the credit bureaus.
The dashed line on the graph is the current 4-week average. The four-week average of weekly unemployment claims decreased to 252,250 - the lowest since March 2020.
This is a huge decline in regular unemployment claims.
3) Job Openings Near Series High.
There were 10.4 million job openings in September, just below the record 11.1 million in July 2021.
 This graph shows job openings (yellow line), hires (dark blue), Layoff, Discharges and other (red column), and Quits (light blue column) from the JOLTS.
 The number of job openings (yellow) were up 58% year-over-year.
Quits were up 34% year-over-year to a new record high. These are voluntary separations. (See light blue columns at bottom of graph for trend for "quits").
A large number of job openings, and rising quits, are positive signs for workers.
4) Mortgage Debt as a Percent of GDP is much lower than during Housing Bubble
 This graph shows household mortgage debt as a percent of GDP. Note this graph was impacted by the sharp decline in Q2 2020 GDP.
Mortgage debt increased by $222 billion in Q2 2021. This was the largest quarterly increase in mortgage debt since 2006.
Mortgage debt is up $573 billion from the peak during the housing bubble, but, as a percent of GDP is at 49.6% - down from Q1 - and down from a peak of 73.3% of GDP during the housing bubble.
5) Mortgage Delinquency Rate Declining Quickly
Two graphs for this one. The first graph, based on data from the MBA through Q3 2021, shows the percent of loans delinquent by days past due. Overall delinquencies decreased in Q3.
 The sharp increase last year in the 90-day bucket was due to loans in forbearance (included as delinquent, but not reported to the credit bureaus).
The percent of loans in the foreclosure process declined further, and was at the lowest level since 1981.
And from Freddie Mac for October:
 Freddie Mac reported that the Single-Family serious delinquency rate in October was 1.32%, down year-over-year from 2.89% in October 2020.
Freddie's serious delinquency rate peaked in February 2010 at 4.20% following the housing bubble, and peaked at 3.17% in August 2020 during the pandemic.
These are mortgage loans that are "three monthly payments or more past due or in foreclosure". Mortgages in forbearance are being counted as delinquent in this monthly report, but are not reported to the credit bureaus.
Happy Thanksgiving to All!