Total housing starts in June were above expectations, however starts in April and May were revised down.
Single family starts increased in June, and were up 28% year-over-year. Starts declined at the beginning of the pandemic, and then increased due to strong demand.
The volatile multi-family sector is up 31% year-over-year.
The housing starts report showed total starts were up 6.3% in June compared to the previous month, and total starts were up 29.1% year-over-year compared to June 2020.
The housing starts report showed total starts were up 6.3% in June compared to the previous month, and total starts were up 29.1% year-over-year compared to June 2020.
Low mortgage rates, limited existing home inventory, and favorable demographics have given a boost to single family housing starts.
The first graph shows the month to month comparison for total starts between 2020 (blue) and 2021 (red).
 Click on graph for larger image.
Starts were up 29.1% in June compared to June 2020. The year-over-year comparison will be more difficult starting in July.
In 2020, starts were off to a strong start before the pandemic, and with low interest rates, and little competing existing home inventory, starts finished 2020 strong.
Starts were solid in the first half of 2021.
Below is an update to the graph comparing multi-family starts and completions. Since it usually takes over a year on average to complete a multi-family project, there is a lag between multi-family starts and completions. Completions are important because that is new supply added to the market, and starts are important because that is future new supply (units under construction is also important for employment).
These graphs use a 12 month rolling total for NSA starts and completions.
 The blue line is for multifamily starts and the red line is for multifamily completions.
The rolling 12 month total for starts (blue line) increased steadily for several years following the great recession - then mostly moved sideways.
These graphs use a 12 month rolling total for NSA starts and completions.
 The blue line is for multifamily starts and the red line is for multifamily completions.
 The rolling 12 month total for starts (blue line) increased steadily for several years following the great recession - then mostly moved sideways.
Completions (red line) had lagged behind starts, but have caught up again.
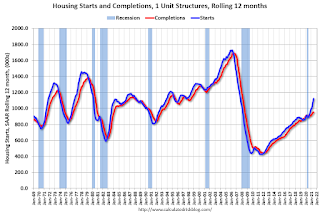 The last graph shows single family starts and completions. It usually only takes about 6 months between starting a single family home and completion - so the lines are much closer. The blue line is for single family starts and the red line is for single family completions.
Single family starts are getting back to more normal levels, but I still expect some further increases in single family starts and completions on a rolling 12 month basis - especially given the low level of existing home inventory.