And check out COVID Act Now to see how each state is doing.
Almost 32,000 US deaths have been reported in March due to COVID.
 Click on graph for larger image.
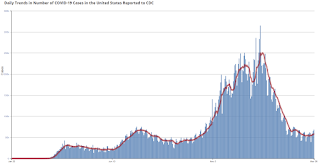
This graph shows the daily (columns) 7 day average (line) of positive tests reported.
This data is from the CDC.
 Click on graph for larger image.
This graph shows the daily (columns) 7 day average (line) of positive tests reported.
This data is from the CDC.
The 7-day average is 58,598, up from 57,249 yesterday, and well above the low following the summer surge of 35,000.
The second graph shows the number of people hospitalized.
 This data is also from the CDC.
The CDC cautions that due to reporting delays, the area in grey will probably increase.
The second graph shows the number of people hospitalized.
 This data is also from the CDC.
The CDC cautions that due to reporting delays, the area in grey will probably increase.
The current 7-day average is 32,843, down slightly from 32,871 yesterday, but well above the post-summer surge low of 23,000.