This table shows the amount of unemployment insurance and "Other" transfer payments since February 2020 (pre-crisis level). The increase in "Other" was mostly due to other parts of the relief acts (including direct payments).
| Selected Transfer Payments Billions of dollars, SAAR | ||
|---|---|---|
| Other | Unemployment Insurance | |
| Feb-20 | $506 | $28 |
| Mar-20 | $515 | $74 |
| Apr-20 | $3,379 | $493 |
| May-20 | $1,360 | $1,356 |
| Jun-20 | $758 | $1,405 |
| Jul-20 | $760 | $1,331 |
| Aug-20 | $692 | $636 |
| Sep-20 | $936 | $359 |
| Oct-20 | $731 | $305 |
| Nov-20 | $619 | $281 |
| Dec-20 | $655 | $308 |
| Jan-21 | $2,337 | $571 |
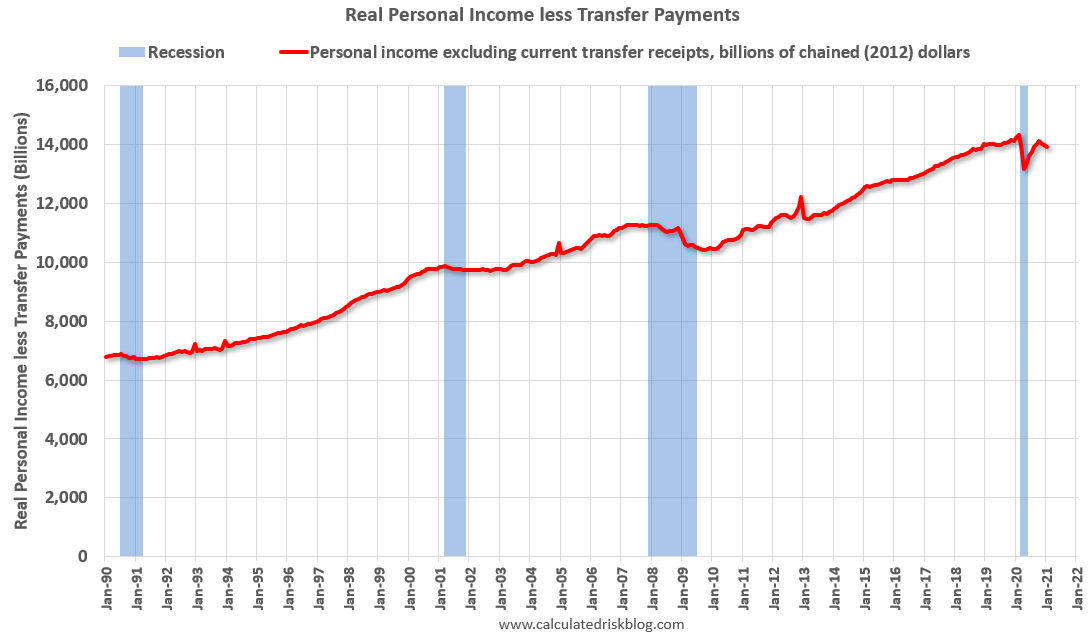
A key measure of the health of the economy (Used by NBER in recession dating) is Real Personal Income less Transfer payments.
 Click on graph for larger image.
This graph shows real personal income less transfer payments since 1990.
This measure of economic activity decreased 0.5% in January, compared to December, and was down 2.8% compared to February 2020 (previous peak).
 Another way to look at this data is as a percent of the previous peak.
Real personal income less transfer payments was off 8.1% in April. This was a larger decline than the worst of the great recession.
Currently personal income less transfer payments are still off 2.8% (dashed line).